3371
QUIQI – using a QUality Index for the analysis of Quantitative Imaging data1Department for Clinical Neuroscience, Lausanne University Hospital and University of Lausanne, Lausanne, Switzerland, 2Wellcome Centre for Human Neuroimaging, Queen Square Institute of Neurology, UCL, London, London, United Kingdom
Synopsis
Image degradation due to head motion is ubiquitous in MRI, reduces sensitivity, hinders clinical diagnosis and increases the risk of spurious findings. The few existing objective measures of degradation are often used sub-optimally, to remove the most degraded datasets from analysis. Using a large dataset (N~1400) we show how to incorporate an validated index of degradation into the analysis of group studies. The benefit is demonstrated for the case of healthy age-related difference in brain relaxometry data using the SPM software. However, the proposed framework is flexible with broad potential, including the analysis of other metrics and body regions.
Introduction
Head movement leads to degradation of MRI data that hampers clinical diagnosis and increases the risk of spurious findings1–3. Quantitative measures of motion degradation4–10 allow the exclusion of affected datasets from analysis3,5. However, the calculation of a threshold for exclusion pertains to the specifics of each study (e.g. demographics, data type, etc.), precluding generalisation. Also, even subtle head motions, reported in ~40-50% of study participants, have an observable impact on MRI-based brain measures3,11,12. A preferable solution would be a data analysis framework that assigns weights to each dataset, calculated from a measure of motion degradation to achieve optimal sensitivity to brain change. We introduce such a framework here, using the motion degradation index (MDI) described in10. In a standard General Linear Model (GLM) analysis, we show the relationship between this MDI and the residual errors after model fitting, which invalidates the assumption of uniform variance (‘homoscedasticity’) of standard GLM approaches. To address this, we use this relationship to compute weights for each dataset using the restricted maximum likelihood (ReML) algorithm of the SPM software, designed for the analysis of functional MRI data (pre-whitening and group-level analysis)13. This approach restores the validity of the homoscedasticity assumption. We compare the statistical efficiency of the proposed framework with a standard approach where the most degraded datasets are excluded from analysis.Methods
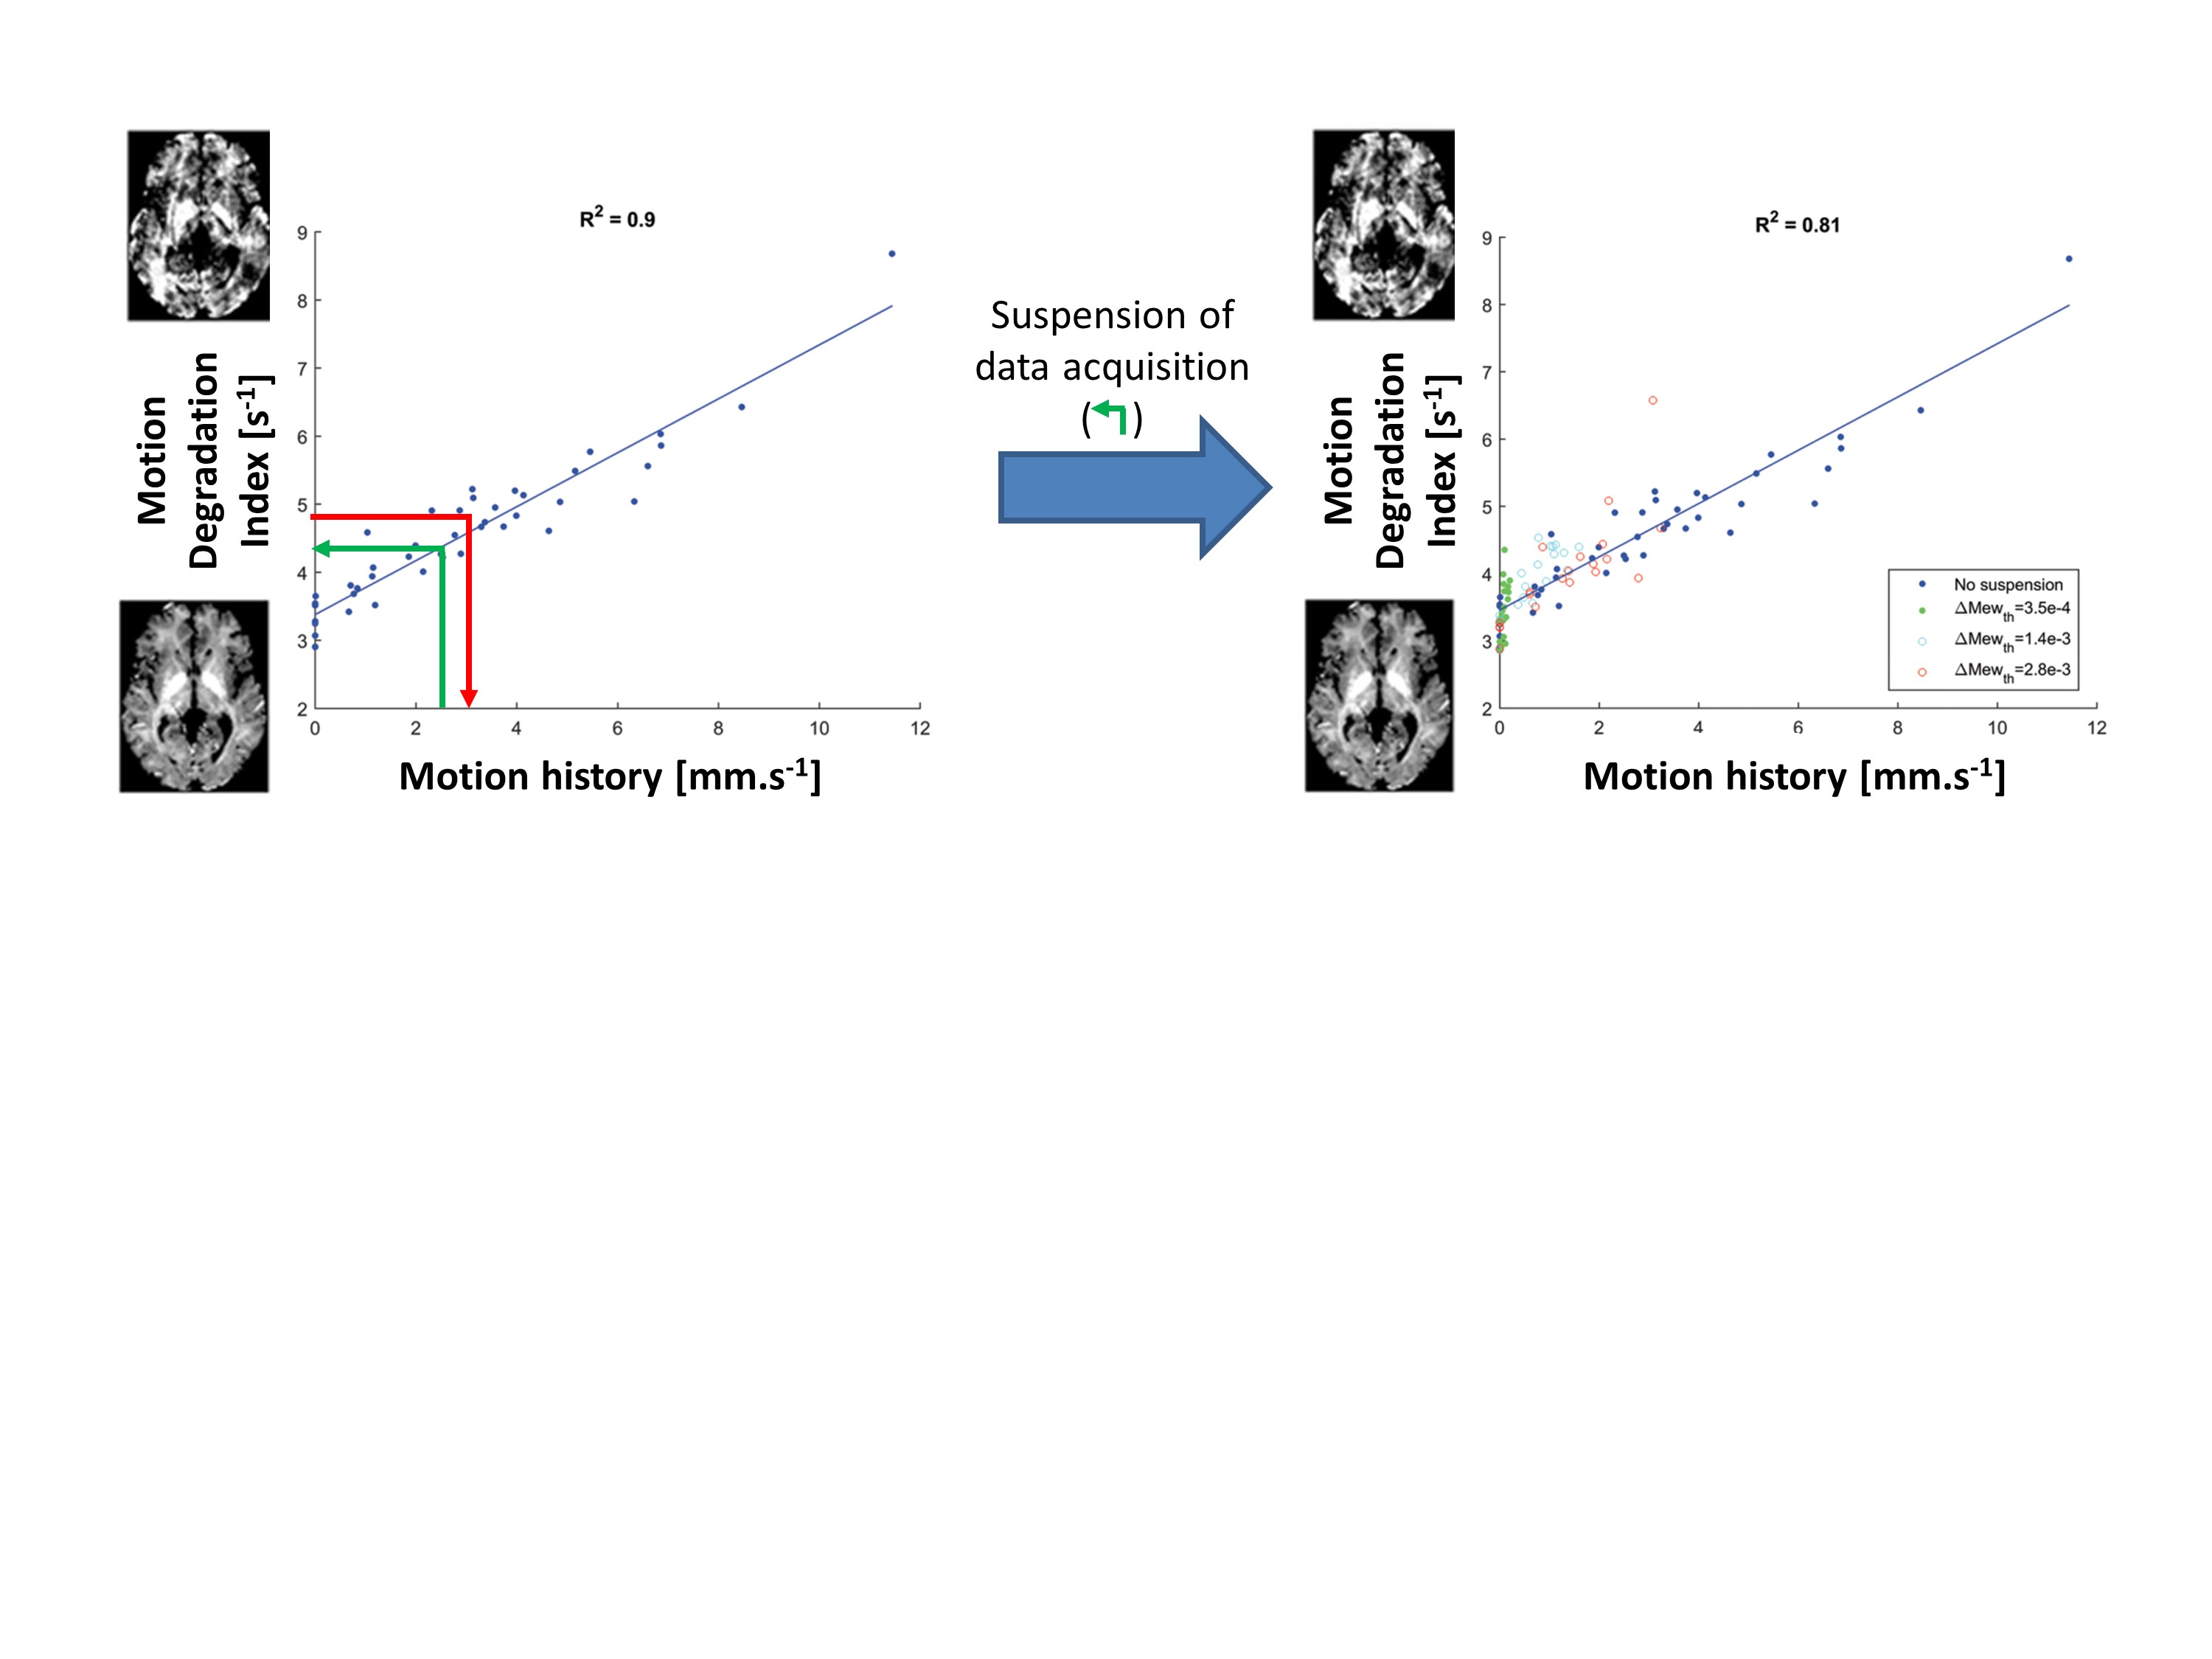
MRI data was acquired on 1398 healthy participants recruited from the population of Lausanne, Switzerland (mean age: 56y.o; SD: 14y.o.; BrainLaus/PsyCoLaus study14, full protocol described in15,16). Here we consider the data acquired using a multi-echo FLASH readout with proton density-weighted contrast, used to compute maps of the effective transverse relaxation rate R2*. As an MDI, we used the standard deviation of the R2* maps in white matter10. This index has been validated against the history of head motion during data acquisition (figure 1) and allows the quantification of motion degradation even when the actual motion history is unknown. The R2* maps were spatially normalized to group space as in17,18. A study of healthy age-related differences in R2* was conducted in grey and white matter, using a 2nd-order polynomial model of age embedded in the GLM framework of SPM12. Additional regressors controlling for gender and total intracranial volume were also included in the analysis. The proposed framework was compared against an analysis that excluded datasets with an MDI value above 4.5s-1. This threshold accounts for the systematic increase in the MDI at 1mm3 resolution compared to 1.5mm3 10,20 and led to the exclusion of 17% of the cohort from analysis, in-line with previous studies3,5.Results
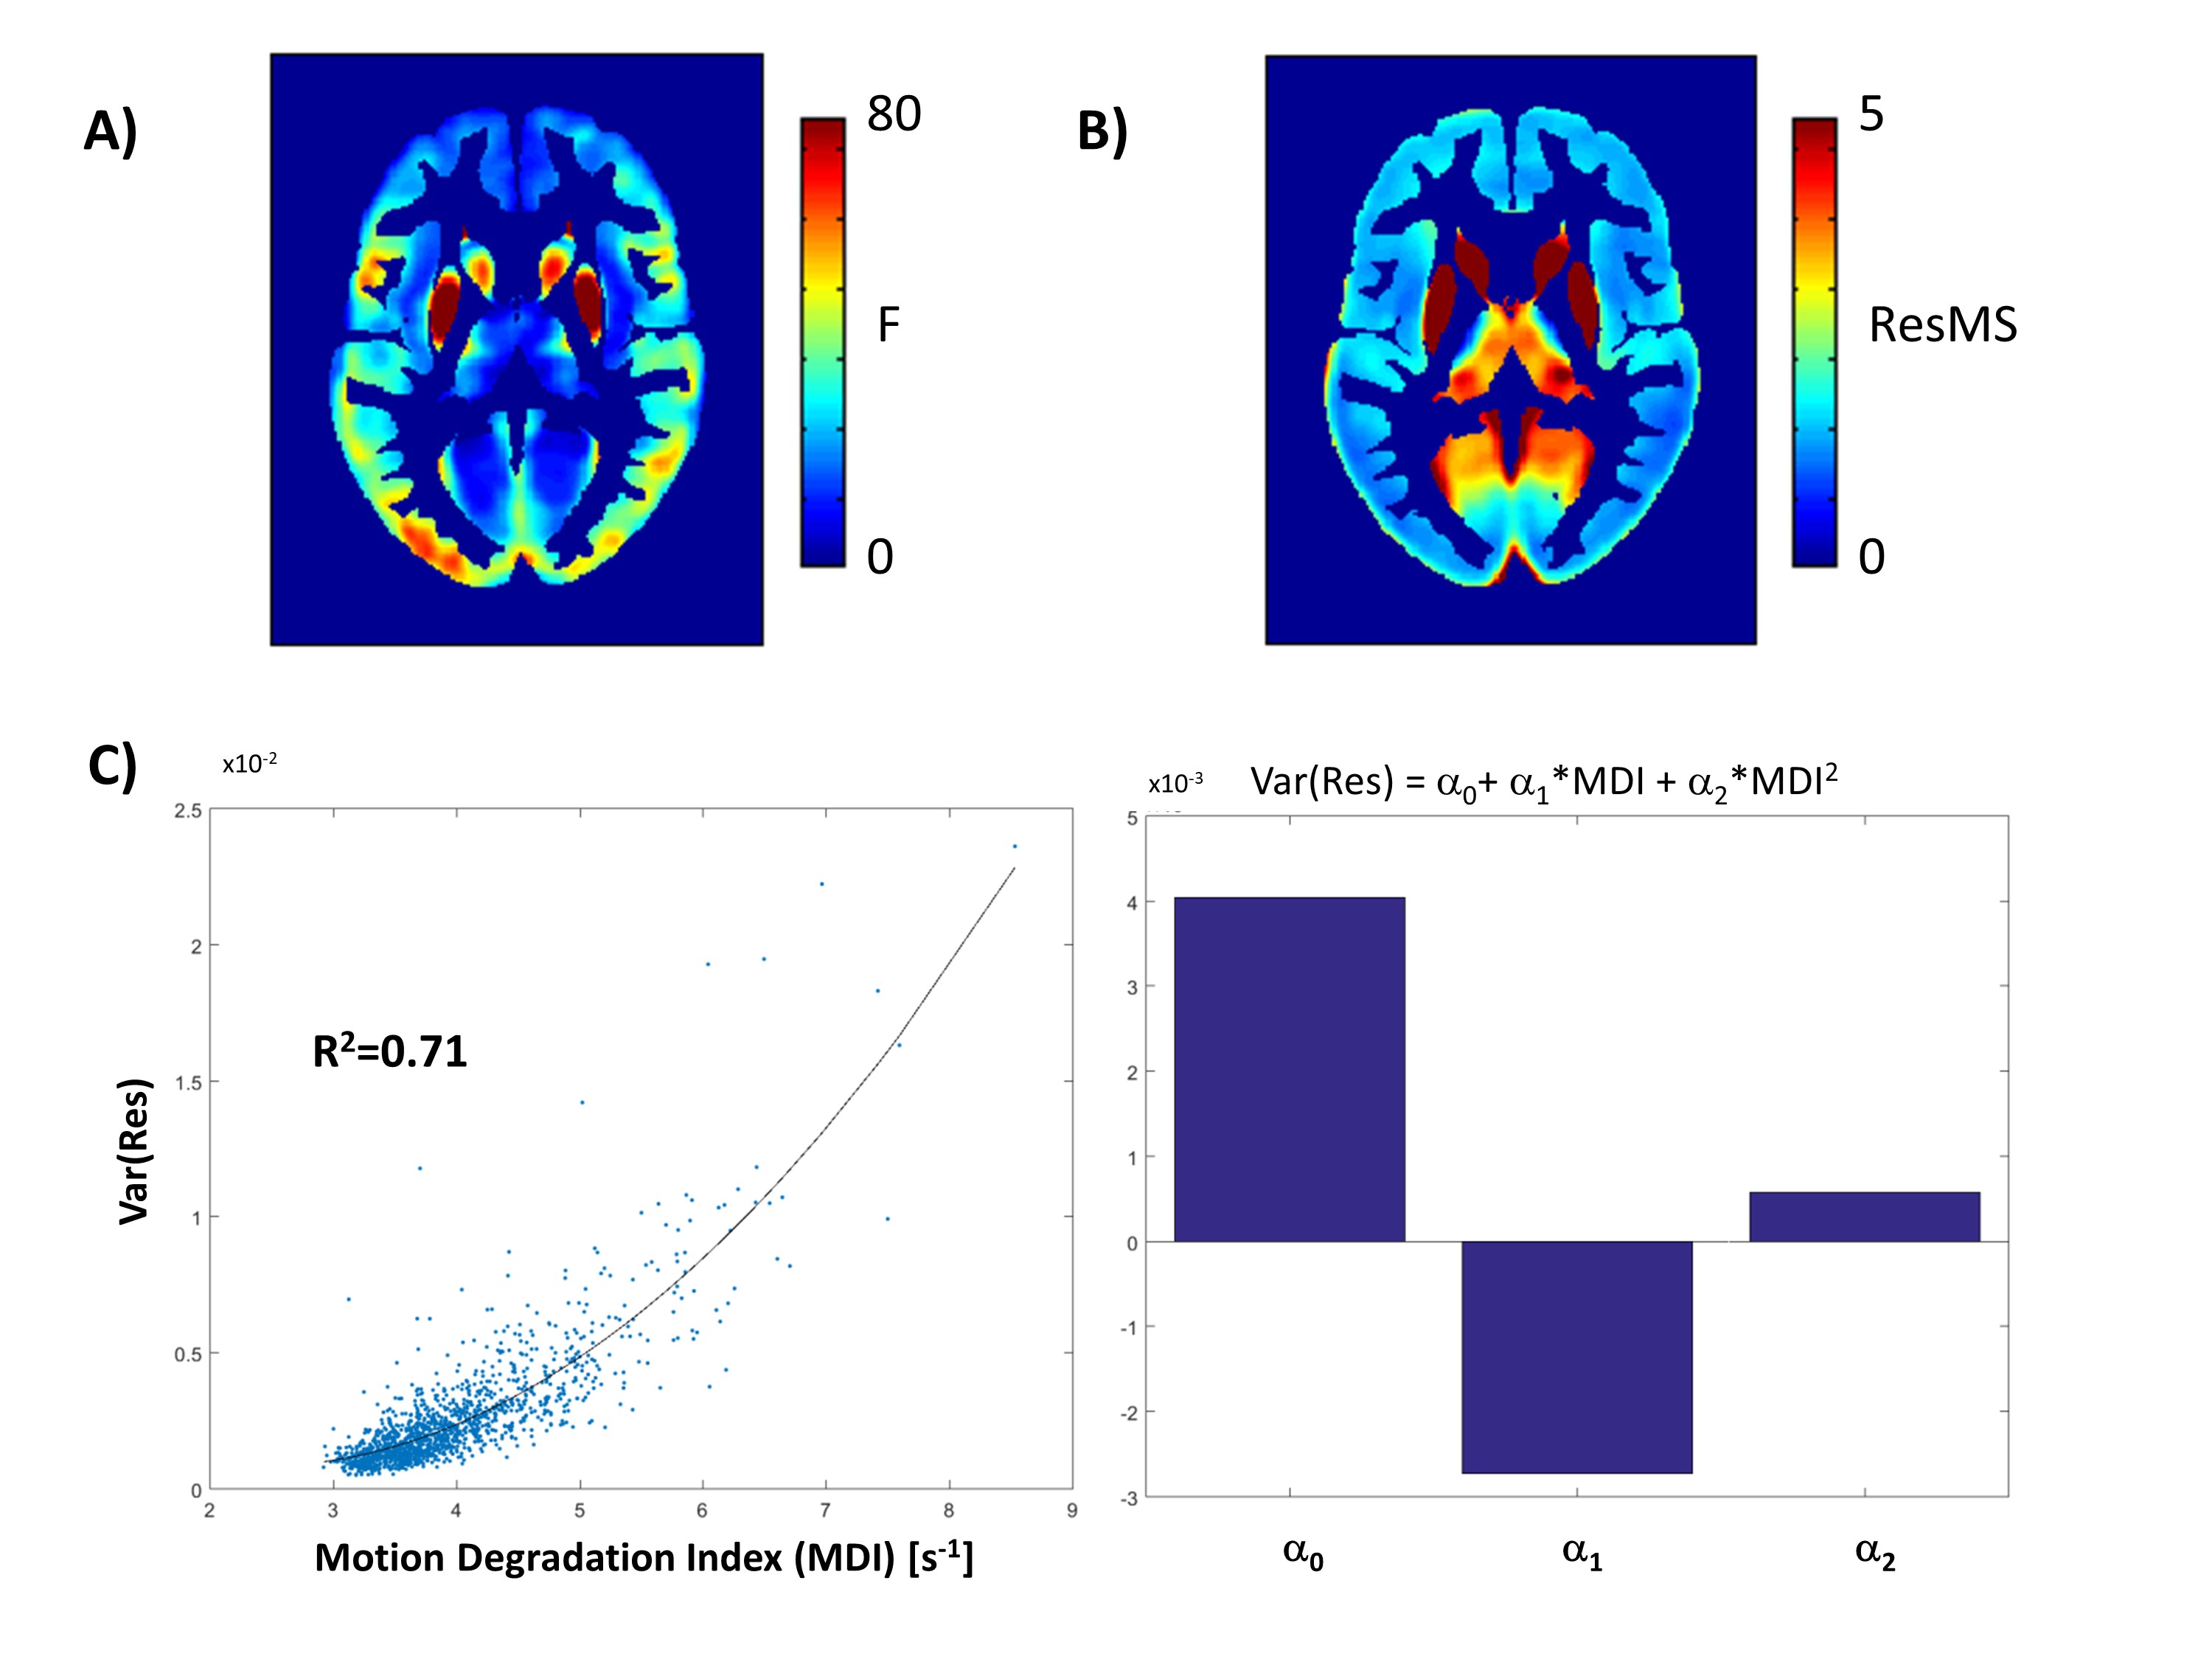
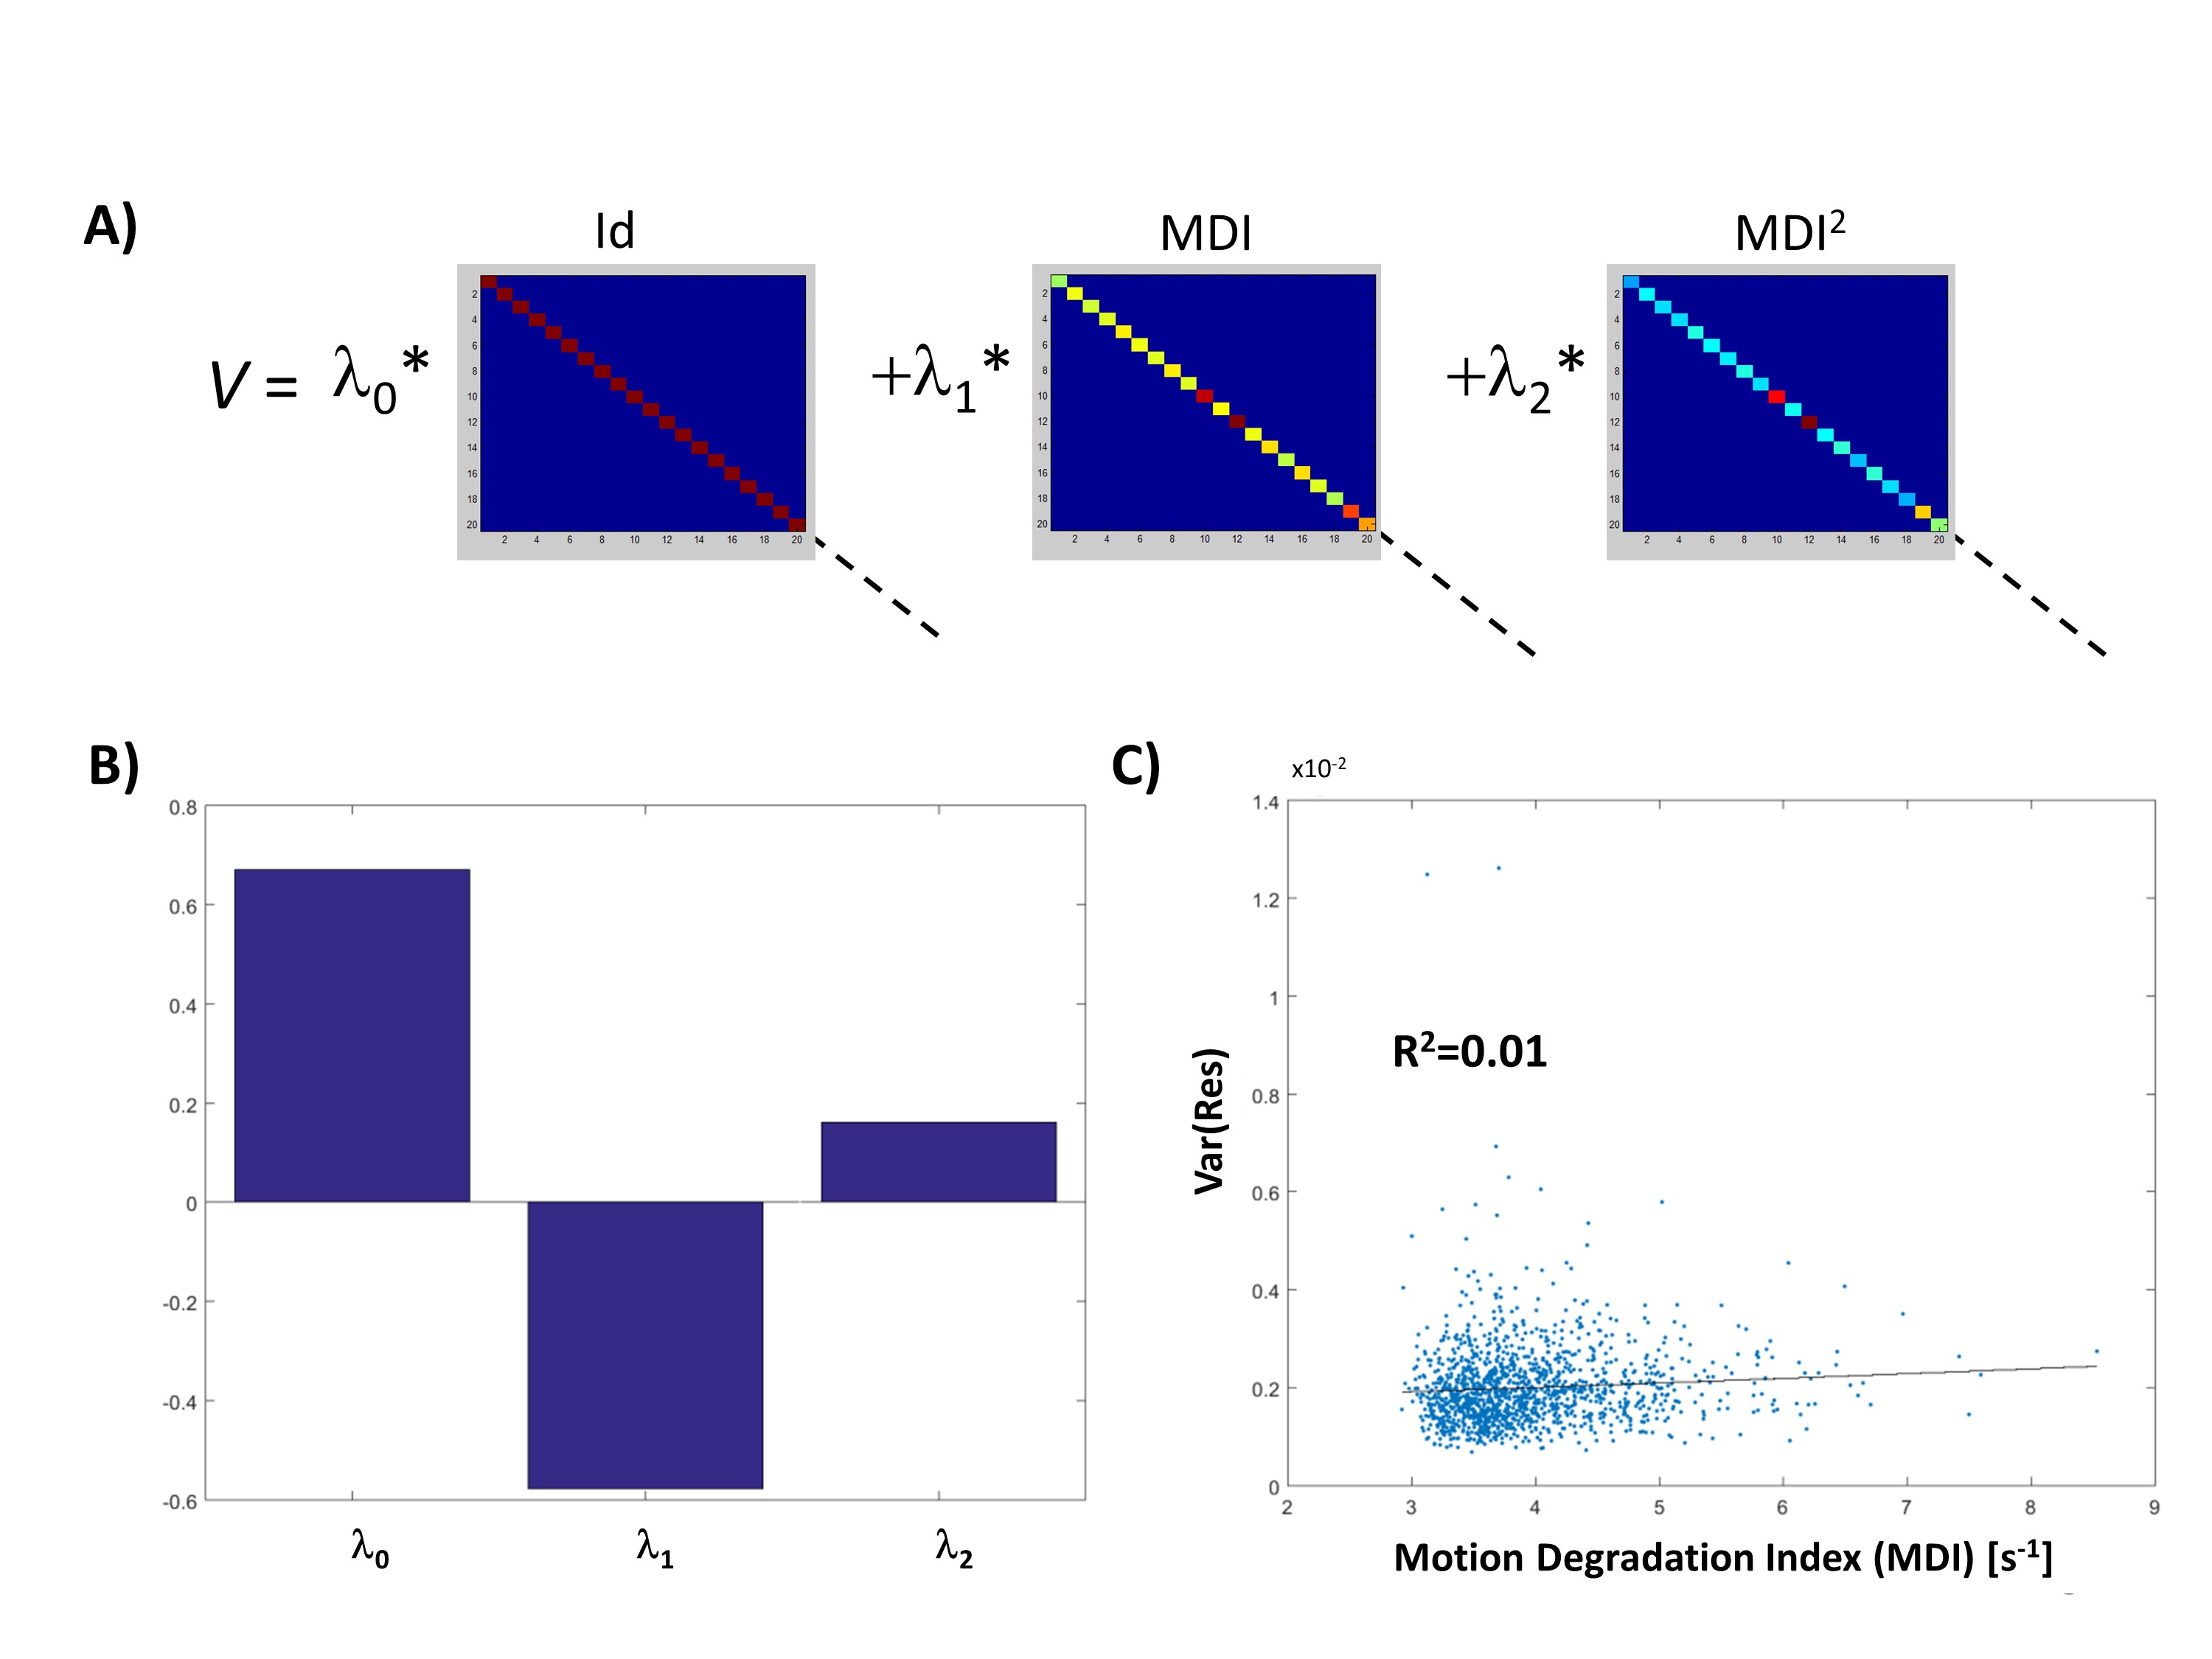
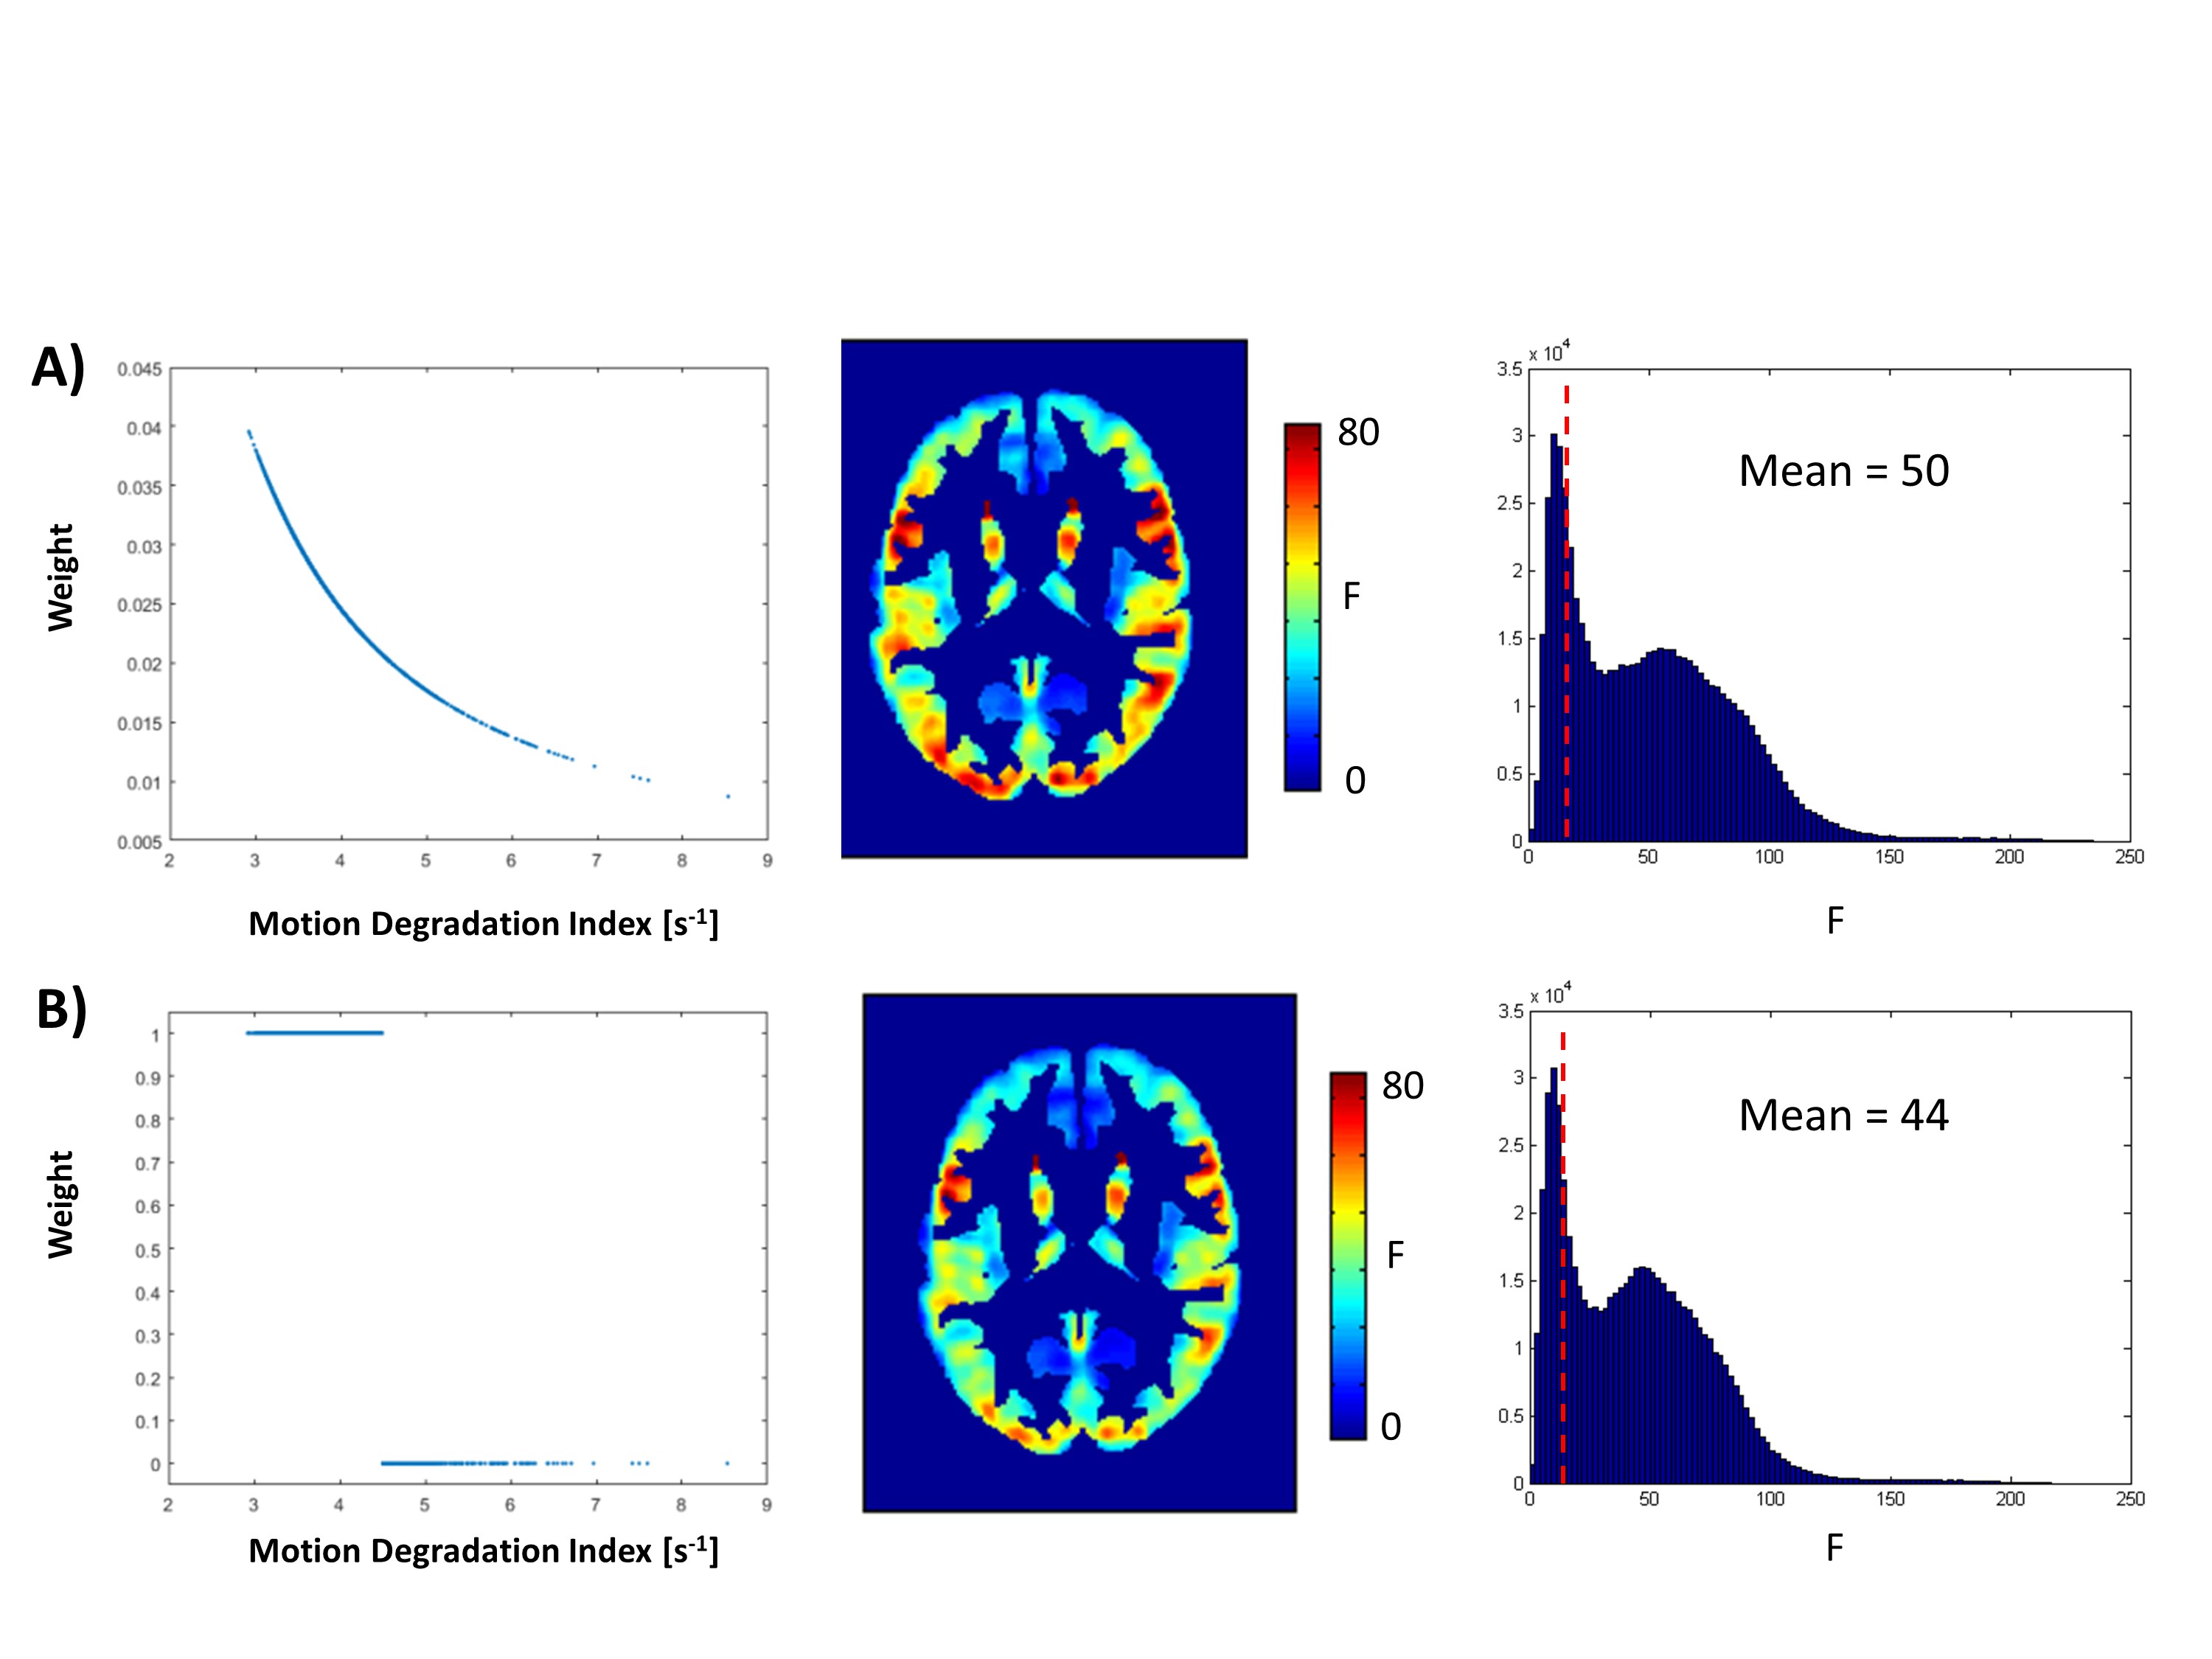
In a standard analysis, significant age-associated differences in R2* were found in grey matter. These were particularly pronounced in sub-cortical areas due to age-related iron accumulation in these regions17,19 (see figure 2A). Figure 2B shows a map of the mean-square residuals (‘ResMS’), obtained from the fit of the ageing model to the R2* maps. Regions of highest residuals included sub-cortical and basal areas (i.e. cerebellum, brainstem). The variance of the residual maps, calculated across voxels for each dataset, closely follows a 2nd-order polynomial dependence on the MDI value (R2=0.71, see figure 2C; white matter: R2=0.82, data not shown). From figure 2C, the set of basis functions required by ReML to compute the noise covariance matrix V included an offset term, as well as linear and quadratic terms of MDI values in their diagonals (figure 3A). The hyper-parameters l estimated by ReML (figure 3B) closely matched the polynomial estimates of figure 2C. From the estimate of V, dataset-specific weights W were computed turning a standard (ordinary-least squares, OLS) analysis into a weighted-least square (WLS) analysis. This removed the dependence of the residual errors on the MDI (R2=0.01, see figure 3B; white matter: R2=0.16, data not shown). Figure 4 shows maps and histograms of F-scores of age-associated differences in R2* for the proposed WLS analysis (A) and from a standard OLS analysis after removal of the datasets with an MDI above 4.5s-1 (B). A significant age-associated change in R2* was found in 84% and 80% of grey-matter voxels respectively. The proposed WLS approach led to an average increase of 17% in F-scores compared to removal of the most degraded datasets.Discussion
In a GLM analysis, motion degradation invalidates the fundamental assumption of uniform variance in standard ordinary-least squares approaches (‘homoscedasticity’). To address this issue, we propose a framework that incorporates measures of motion degradation into the analysis of MRI data. From these measures, weights are computed for each dataset to restore the validity of the homoscedasticity assumption. This framework circumvents the need to remove the datasets most affected by motion degradation and leads to optimal sensitivity to brain change. The framework was assessed by conducting a study of age-related brain changes using relaxometry data computed from one multi-echo dataset. However, it is broad and flexible: it can accommodate other metrics of motion degradation and is applicable to other brain metrics. In future work we will show its applicability to relaxometry data computed from multiple contrasts (e.g. T1 or MT maps21,22).Acknowledgements
AL is supported by the Swiss National Science Foundation (project grant Nr. 320030_184784) and the ROGER DE SPOELBERCH foundation. MFC is supported by the MRC and Spinal Research Charity through the ERA-NET Neuron joint call (MR/R000050/1). The Wellcome Centre for Human Neuroimaging is supported by core funding from the Wellcome [203147/Z/16/Z].References
1. Andre JB, Bresnahan BW, Mossa-Basha M, et al. Toward Quantifying the Prevalence, Severity, and Cost Associated With Patient Motion During Clinical MR Examinations. J Am Coll Radiol. 2015;12(7):689-695. doi:10.1016/j.jacr.2015.03.007
2. Havsteen I, Ohlhues A, Madsen KH, Nybing JD, Christensen H, Christensen A. Are Movement Artifacts in Magnetic Resonance Imaging a Real Problem?—A Narrative Review. Front Neurol. 2017;8:232. doi:10.3389/fneur.2017.00232
3. Satterthwaite TD, Wolf DH, Loughead J, et al. Impact of in-scanner head motion on multiple measures of functional connectivity: Relevance for studies of neurodevelopment in youth. Neuroimage. 2012;60(1):623-632. doi:10.1016/J.NEUROIMAGE.2011.12.063
4. Zarrar S, Steven G, Qingyang L, et al. The Preprocessed Connectomes Project Quality Assessment Protocol - a resource for measuring the quality of MRI data. Front Neurosci. 2015;9. doi:10.3389/conf.fnins.2015.91.00047
5. Mortamet B, Bernstein MA, Jack CR, et al. Automatic quality assessment in structural brain magnetic resonance imaging. Magn Reson Med. 2009;62(2):365-372. doi:10.1002/mrm.21992
6. Joanes DN, Gill CA. Comparing measures of sample skewness and kurtosis. J R Stat Soc Ser D (The Stat. 1998;47(1):183-189. doi:10.1111/1467-9884.00122
7. Dale AM, Fischl B, Sereno MI. Cortical Surface-Based Analysis: I. Segmentation and Surface Reconstruction. Neuroimage. 1999;9(2):179-194. doi:10.1006/NIMG.1998.0395
8. Alfaro-Almagro F, Jenkinson M, Bangerter NK, et al. Image processing and Quality Control for the first 10,000 brain imaging datasets from UK Biobank. Neuroimage. 2018;166:400-424. doi:10.1016/J.NEUROIMAGE.2017.10.034
9. Tisdall MD, Reuter M, Qureshi A, Buckner RL, Fischl B, van der Kouwe AJW. Prospective motion correction with volumetric navigators (vNavs) reduces the bias and variance in brain morphometry induced by subject motion. Neuroimage. 2016;127:11-22. doi:10.1016/J.NEUROIMAGE.2015.11.054
10. Castella R, Arn L, Dupuis E, Callaghan MF, Draganski B, Lutti A. Controlling motion artefact levels in MR images by suspending data acquisition during periods of head motion. Magn Reson Med. 2018. doi:10.1002/mrm.27214
11. Reuter M, Tisdall MD, Qureshi A, Buckner RL, van der Kouwe AJW, Fischl B. Head motion during MRI acquisition reduces gray matter volume and thickness estimates. Neuroimage. 2015;107:107-115. doi:10.1016/J.NEUROIMAGE.2014.12.006
12. Alexander-Bloch A, Clasen L, Stockman M, et al. Subtle in-scanner motion biases automated measurement of brain anatomy from in vivo MRI. Hum Brain Mapp. 2016;37(7):2385-2397. doi:10.1002/hbm.23180
13. Friston KJ, Glaser DE, Henson RNA, Kiebel S, Phillips C, Ashburner J. Classical and Bayesian Inference in Neuroimaging: Applications. Neuroimage. 2002;16(2):484-512. doi:10.1006/NIMG.2002.1091
14. Preisig M, Waeber G, Vollenweider P, et al. The PsyCoLaus study: methodology and characteristics of the sample of a population-based survey on psychiatric disorders and their association with genetic and cardiovascular risk factors. BMC Psychiatry. 2009;9(1):9. doi:10.1186/1471-244X-9-9
15. Melie-Garcia L, Slater D, Ruef A, et al. Networks of myelin covariance. Hum Brain Mapp. 2018;39(4):1532-1554. doi:10.1002/hbm.23929
16. Lorio S, Kherif F, Ruef A, et al. Neurobiological Origin of Spurious Brain Morphological Changes: A Quantitative MRI Study. Hum Brain Mapp. 2016;37:1801-1815. doi:10.1002/hbm.23137
17. Draganski B, Ashburner J, Hutton C, et al. Regional specificity of MRI contrast parameter changes in normal ageing revealed by voxel-based quantification (VBQ). Neuroimage. 2011;55(4):1423-1434. doi:10.1016/j.neuroimage.2011.01.052
18. Tabelow K, Balteau E, Ashburner J, et al. hMRI – A toolbox for quantitative MRI in neuroscience and clinical research. Neuroimage. 2019;194:191-210. doi:10.1016/J.NEUROIMAGE.2019.01.029
19. Callaghan MF, Freund P, Draganski B, et al. Widespread age-related differences in the human brain microstructure revealed by quantitative magnetic resonance imaging. Neurobiol Aging. 2014;35(8):1862-1872. doi:10.1016/j.neurobiolaging.2014.02.008
20. Slater DA, Melie‐Garcia L, Preisig M, Kherif F, Lutti A, Draganski B. Evolution of white matter tract microstructure across the life span. Hum Brain Mapp. 2019;40(7):2252-2268. doi:10.1002/hbm.24522
21. Helms G, Dathe H, Dechent P. Quantitative FLASH MRI at 3T using a rational approximation of the Ernst equation. Magn Reson Med. 2008;59(3):667-672. doi:10.1002/mrm.21542
22. Helms G, Dathe H, Kallenberg K, Dechent P. High-resolution maps of magnetization transfer with inherent correction for RF inhomogeneity and T1 relaxation obtained from 3D FLASH MRI. Magn Reson Med. 2008;60(6):1396-1407. doi:10.1002/mrm.21732
Figures