3351
Effective Flip Angle of Enhanced Navigator-Gated 3D Spoiled Gradient-Recalled Echo Sequence1Global MR Applications and Workflow, GE Healthcare Japan, Hino, Japan, 2Department of Radiology, Fukuoka university, Fukuoka, Japan, 3Radiology Center, Fukuoka University Hospital, Fukuoka, Japan
Synopsis
An enhanced navigator-gated 3D-SPGR (eNAV-3D-SPGR) enables free-breathing T1-weighted abdominal MRI with navigator echo signal enhancement. In this study, we calculated effective flip angle of eNav-3D-SPGR in simulation and examined its validity for obtaining desired contrast. Simulation shows that the effective flip angle of 30° was achieved with eNav-3D-SPGR when the flip angle was set to 36.8°. Actual scan resulted in the similar signal ratios between the conventional method with flip angle 30° and eNav-3D-SPGR at flip angle of 37°. eNav-3D-SPGR with the desired effective flip angle can be useful for accurate motion detection when the liver MRI signal is low.
Introduction
Navigator-gated 3D spoiled gradient-recalled echo (3D-SPGR) sequence is a widely used technique for free-breathing T1-weighted abdominal MRI with minimal respiratory motion artifacts.1–3 An enhanced navigator-gated 3D-SPGR (eNAV-3D-SPGR) was developed for navigator echo signal enhancement by wait insertion and variable flip angles of imaging excitation RF pulses.4 This technique resulted in accurate motion detection but can reduce T1-weighted contrast due to an increased longitudinal magnetization recovery. In this study, we calculated effective flip angle of eNav-3D-SPGR in simulation and examined its validity for obtaining desired T1-weighted contrast.Methods
Pulse Sequence: The pulse sequence was based on the previously reported eNAV-3D-SPGR sequence.4 As shown in Figure 1a, a navigator pulse sequence followed an imaging block. A 20-ms wait period was inserted before the navigator sequence for the magnetization recovery. The imaging block consisted of a SPECIR pulse and image acquisition sequences, and imaging excitation RF flip angles were varied with linear ramp-up and ramp-down (Figure 1b) for further magnetization recovery and for reduction of artifacts in SPGR images. The conventional navigator-gated 3D-SPGR (cNAV-3D-SPGR) did not have the wait period and used a constant flip angle train.Computer Simulation: SPGR imaging signal was calculated for cNAV-3D-SPGR and eNAV-3D-SPGR. Nine loops of imaging block and navigator sequence were repeated for steady-state establishment, and the tenth repetition was used to evaluate the signal intensity. The signal was inverse-Fourier transformed into the image domain, and the peak value of the image signal was used for signal comparison. The calculation was performed three times with different T1 values (344 ms: liver after gadxetic acid injection,5 1328 ms: spleen6, 898 ms: muscle6). Signal ratios of liver-to-spleen and liver-to-muscle were calculated for flip angles from 1° to 50° with a step size of 0.1°.
Data Acquisition: We performed all experiments on a GE 3 T MR750w imaging system using floating anterior and embedded posterior coil arrays. The eNAV-3D-SPGR and cNAV-3D-SPGR scans were performed with three patients 15-25 minutes after gadoxetate injection. 3D data were acquired in the axial orientation with imaging parameters: ARC acceleration factor = 2 × 1, compressed sensing factor = 1.7, TR/TE = 6.6/2.7 ms, FOV = 35 × 19.75 cm2, matrix = 416 × 320, slice thickness = 2.0 mm, receiver bandwidth = ±62.5 kHz. The eNAV-3D-SPGR scan was performed with flip angle 30°. The eNAV-3D-SPGR scan was performed twice, one with flip angle 30° and the other with the flip angle whose effective value was 30° based on the simulation. Approximate scan time was 120 s, and it varied depending on the breathing pattern.
Data Analysis: Circular ROIs were placed on the liver parenchyma, paraspinal muscle and spleen in the same transverse plane, and the liver-to-spleen and liver-to-muscle signal ratios were calculated. Navigator signal-to-noise ratio was also calculated using two navigator echoes with the same respiratory position. Navigator signal was defined by the average signal intensity in the 1 cm ROI placed just below the liver upper edge detected with a previously proposed method,7 and noise was defined by the square root of the standard deviation of the subtracted signal using the same ROI.
Results
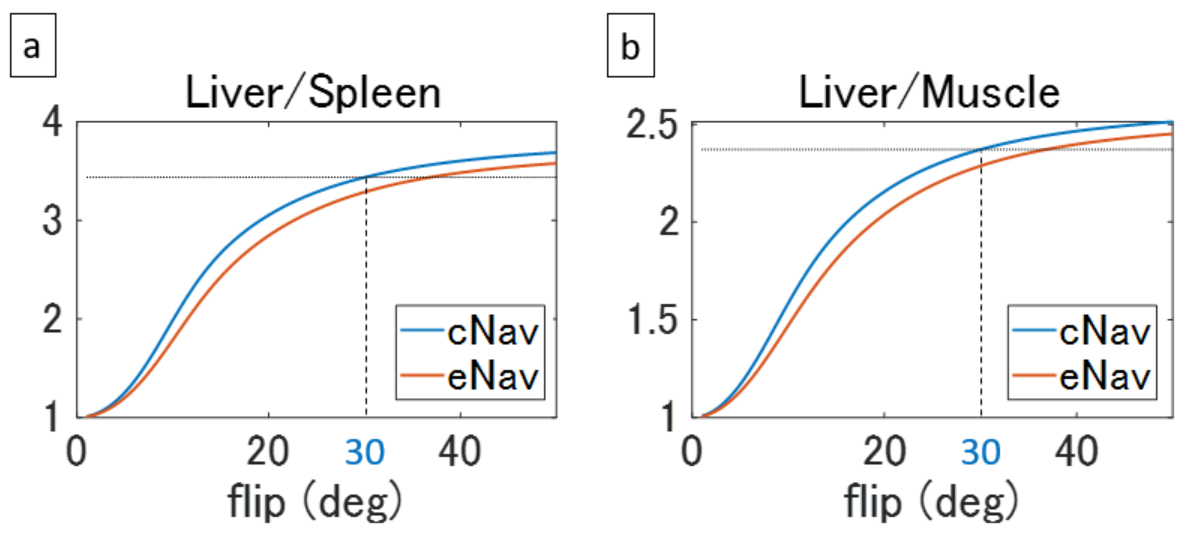
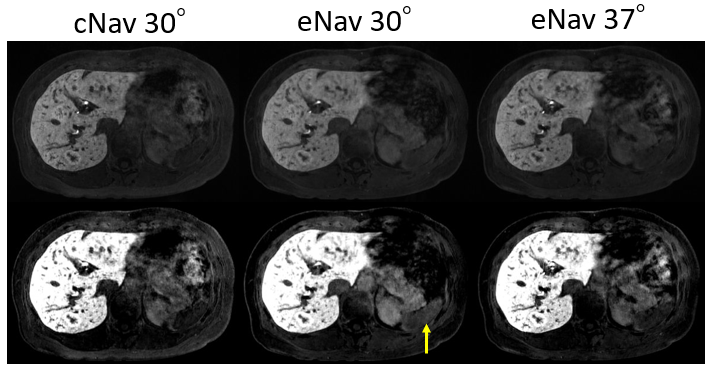
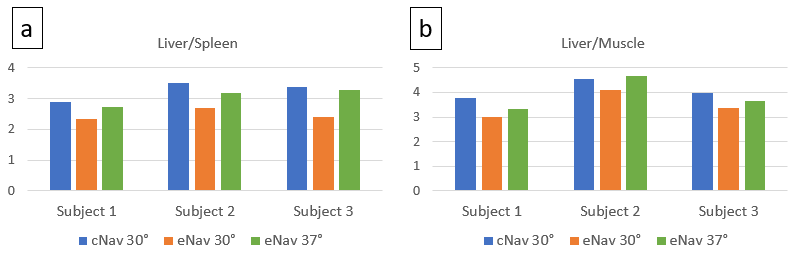
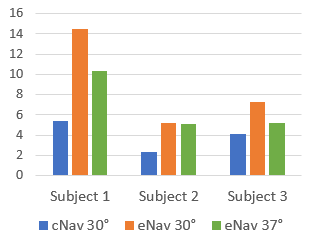
Figure 2 shows the signal ratios calculated in simulation. The ratios of eNAV-3D-SPGR were lower than cNAV-3D-SPGR as expected, and the ratio of eNav-3D-SPGR at flip angle of 36.8° was equal to that of cNAV-3D-SPGR at flip angle of 30° for both liver-to-spleen and liver-to-muscle. This implies that the effective flip angle of 30° was achieved with eNav-3D-SPGR when the flip angle was set to 36.8°. Based on the simulation results, MRI experiments were performed with the flip angles 30° and 37° for eNav-3D-SPGR. Example images are shown in Figure 3. The spleen signal was relatively high in eNav-3D-SPGR with flip angle of 30° compared to cNav-3D-SPGR with the same flip angle, while the signal was suppressed in eNav-3D-SPGR with flip angle 37°. Quantitative analysis shows that the liver-to-spleen and liver-to-muscle ratios were lower for eNav-3D-SPGR with flip angle of 30° than those of cNav-3D-SPGR, and this was recovered with the use of flip angle 37° in eNav-3D-SPGR (Figure 4). Navigator SNR was the highest with eNav-3D-SPGR with flip angle 30°, and eNav-3D-SPGR with flip angle 37° has higher navigator SNR than c Nav-3D-SPGR with flip angle 30°.Discussion and Conclusion
We have calculated the effective flip angle of eNav-3D-SPGR in simulation and have shown that eNav-3D-SPGR of effective flip angle 30° has similar T1-weighted contrast to that of cNav-3D-SPGR of actual flip angle 30°. Navigator SNR was higher in eNav-3D-SPGR even the actual flip angle was higher (37° vs. 30°) because of ramp-down of flip angles and wait period just before the navigator sequence (Figure 1). Therefore, eNav-3D-SPGR with the desired effective flip angle can be useful for accurate motion detection when the liver MRI signal is low due to weak gadoxetate uptake. Clinical evaluation with a large number of subjects is required in future.Acknowledgements
No acknowledgement found.References
1. Vasanawala SS, Iwadate Y, Church DG et al. Navigated abdominal T1-W MRI permits free-breathing image acquisition with less motion artifact. Pediatr Radiol. 2010;40:340–4.
2. Young PM, Brau AC, Iwadate Y et al. Respiratory navigated free breathing 3D spoiled gradient-recalled echo sequence for contrast-enhanced examination of the liver: diagnostic utility and comparison with free breathing and breath-hold conventional examinations. Am J Roentgenol. 2010;195:687–691.
3. Nagle SK, Busse RF, Brau AC et al. High resolution free-breathing 3D T1-weighted hepatobiliary MRI using gadoxetic acid optimized for 1.5T. J Magn Reson Imaging 2012;36:890–899.
4. Iwadate Y, Brau AC, Vasanawala SS et al. Enhancement of respiratory navigator-gated three-dimensional spoiled gradient-recalled echo sequence with variable flip angle scheme. Magn Reson Med 2014;72:172–7.
5. Katsube T, Okada M, Kumano S et al. Estimation of liver function using T1 mapping on Gd-EOB-DTPA-enhanced magnetic resonance imaging. Invest Radiol 2011;46:277–83.
6. de Bazelaire CM, Duhamel GD, Rofsky NM et al. MR imaging relaxation times of abdominal and pelvic tissues measured in vivo at 3.0 T: preliminary results. Radiology 2004;230:652–659.
7. Du YP, Saranathan M, Foo TK. An accurate, robust, and computationally efficient navigator algorithm for measuring diaphragm positions. J Cardiovasc Magn Reson. 2004;6:483–90.
Figures