3349
Quantitative Assessment MR-Assisted PET Respiratory Motion Correction in Colorectal Liver Metastases using PET/MR
Sihao Chen1,2, Cihat Eldeniz2, Yasheng Chen3, and Hongyu An2
1Biomedical Engineering, Washington University in St. Louis, Saint Louis, MO, United States, 2Mallinckrodt Institute of Radiology, Washington University in St. Louis, Saint Louis, MO, United States, 3Department of Neurology, Washington University in St. Louis, Saint Louis, MO, United States
1Biomedical Engineering, Washington University in St. Louis, Saint Louis, MO, United States, 2Mallinckrodt Institute of Radiology, Washington University in St. Louis, Saint Louis, MO, United States, 3Department of Neurology, Washington University in St. Louis, Saint Louis, MO, United States
Synopsis
Respiratory motion causes signal blurring and reduced tumor-to-background ratio (TBR). Simultaneous PET/MR imaging uniquely allows for MR-assisted motion correction in PET imaging, potentially leading to improved PET images for detection of lesions. In this study, we implemented several MR-assisted PET motion correction methods, including gated reconstruction (gated MoCo), reconstruct-transform-average (RTA) and motion-compensated image reconstruction (MCIR), to FDG imaging of colorectal liver metastases. We quantitatively compared TBR and CNR in FDG avid liver lesions. Our results demonstrated improvement of TBR and CNR using MCIR.
Introduction
Respiratory motion has negative effects on PET images. It adversely affects quantitative analysis and diagnostic accuracy of lesions due to signal blurring and reduced TBR1,2. Simultaneous PET/MR imaging allows for MR-assisted MoCo that estimates and compensates for motion on PET. In this study, we evaluated the performance among gated reconstruction, RTA and MCIR. We quantitatively assessed the improvement of TBR using MR-assisted MoCo techniques in a cohort of four patients with colorectal liver metastases.Methods
Four patients with colorectal liver metastases were imaged on a Siemens Biograph mMR PET/MRI scanner. Prior to imaging, patients were administrated with 18F-Fluorodeoxyglucose (FDG). Eovist was injected for dynamic-contrast-enhanced (DCE) and hepatobiliary contrast (20 minutes post injection) MRI imaging. A self-navigated free breathing MR motion correction method (CAPTURE: Consistently acquired projections for tuned and robust estimation), was utilized to derive deformable motion3. The acquisition parameters were: TE/TR=1.66ms/3.5ms, FOV=360mm×360mm, voxel size=1.125×1.125×3mm3. 2000 radial spokes were acquired for 5 minutes and they were then divided into 5 respiratory phases based on the respiration motion binning information derived by CAPTURE sequence. Motion vector fields (MVF) were derived from nonlinear registration between different MR respiratory phases. The MR-derived motion binning was then used to rebin the simultaneously acquired listmode PET data. Three MR-assisted PET MoCo techniques were performed. The first one was gated reconstruction (gated MoCo), in which listmode PET gated from a single respiratory phase (end-expiration) was reconstructed. The second one was reconstruct-transform-average (RTA), also known as post-reconstruction registration (PRR)4. In RTA, each gated motion-free PET was reconstructed independently and MR-derived MVFs were used to warp gated PET images from different motion phases into a single reference phase. The third one was motion-compensated image reconstruction (MCIR), which incorporated the motion information directly into the iterative PET ordered-subsets expectation-maximization (OSEM) algorithm5. Non-Motion corrected (non-MoCo) and MoCo PET images were compared for TBR and contrast-to-noise ratio (CNR). Lesion ROIs were manually drawn on FDG avid liver lesions on non-MoCo PET images and background ROIs were defined within normal liver region free of lesions. Three TBR values, TBRmax, TBRpeak and TBRmean were calculated by dividing the SUV values (SUVmax, SUVpeak and SUVmean) of the legion ROI from background ROI (SUVmean). CNR was calculated by subtracting the lesion ROI (SUVmean) by the background ROI (SUVmean) before dividing by the standard deviation of the SUV in the background ROI.Results
Figure 1 shows 4 sets of reconstructed PET images and hepatobiliary contrast MR images. Using hepatobiliary contrast MR images, two lesions were identified in two patients, and one lesion was identified in the remaining 2 patients. FDG is positive in 5 out of the 6 lesions, while negative in one lesion. TBR comparison among various MoCo schemes was only performed in the 5 FDG positive lesions. As demonstrated in Figure 1, MCIR and gated MoCo reconstructed PET images are sharper than the non-MoCo image. The TBR values in the 5 lesions reconstructed using RTA were either slightly increased or decreased when compared to non-MoCo reconstruction. Overall, TBR increased in both MCIR and gated MoCo reconstructed PET images. However, as expected gated MoCo has high noise due to only one fifth of data was used in this single-gated reconstruction. In light of that, the TBR values of the five lesions in the non-MoCo and MCIR images were summarized and compared in Table 1. TBRs were all increased in MCIR images when compared to non-MoCo (Figure 2a-c). These improvements reached statistical significance in TBRmax and TBRpeak, but not in TBRmean probably due to TBRmean being less sensitive and a small sample size. Though the gated MoCo method can provide sharper images, it contains high noise by only using the end-expiration phase listmode data. In contrast, MCIR method used all listmode data by incorporating MVF into the OSEM reconstruction. As demonstrated in Table 2 and Figure 2d, CNR in the MCIR images was higher than that in the gated MoCo in all lesions. However, this increase did not reach statistical significance due to the small sample size.Discussion and Conclusion
Our results demonstrated that MCIR provides improved image quality by increasing TBR and CNR. It provides sharp and less noisy images and is more robust when compared to gated MoCo and RTA. MR has been the method of choice to image patient with colorectal liver metastases due to its sensitivity in detecting small lesions using hepatobiliary contrast. However, MR is not specific in differentiating lesions with different metabolic profiles. In our cohort, we found one MR positive but PET FDG negative lesion, suggesting that this lesion is metabolic inactive. In another patient (Figure 1), MR showed a large homogeneous lesion while PET revealed spatial heterogeneity with low FDG uptake at the center of the lesion but high FDG uptake at the outside rim of lesion. It suggested that this lesion has a necrotic center but aggressive tumor tissue around the necrosis. Our findings demonstrate that simultaneous PET/MR is advantageous by combing the strength of MR (high sensitivity in detecting lesions) and PET (high specificity by assessing tissue metabolic status). Future study in a large cohort is needed to examine the clinical utility of PET/MR in liver diseases.Acknowledgements
No acknowledgement found.References
1. Nehmeh, Sadek A., et al. "Effect of respiratory gating on quantifying PET images of lung cancer." Journal of nuclear medicine 43.7 (2002): 876-881. 2. Nehmeh, S. A., et al. "Effect of respiratory gating on reducing lung motion artifacts in PET imaging of lung cancer." Medical physics 29.3 (2002): 366-371. 3. Eldeniz, Cihat, et al. "CAPTURE: Consistently Acquired Projections for Tuned and Robust Estimation: A Self-Navigated Respiratory Motion Correction Approach." Investigative radiology 53.5 (2018): 293-305. 4. Picard, Yani, and Christopher J. Thompson. "Motion correction of PET images using multiple acquisition frames." IEEE transactions on medical imaging 16.2 (1997): 137-144. 5. Qiao, Feng, et al. "A motion-incorporated reconstruction method for gated PET studies." Physics in Medicine & Biology 51.15 (2006): 3769.Figures
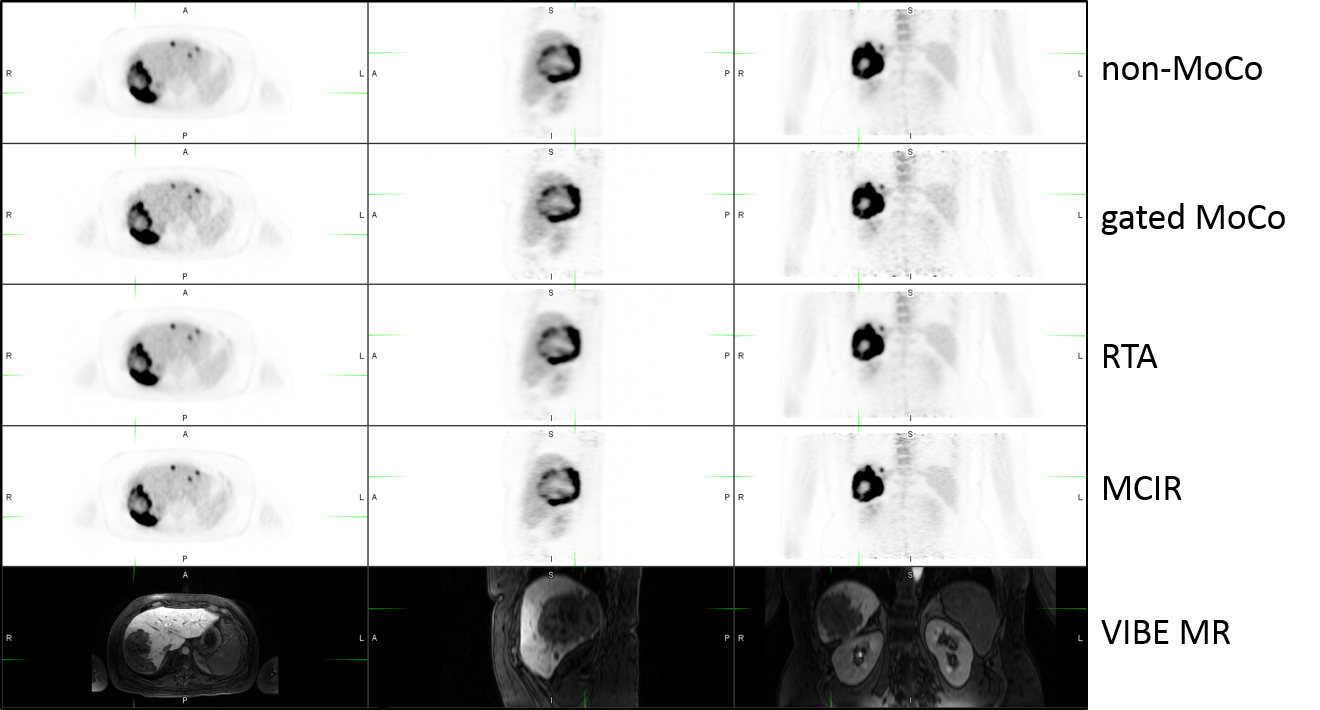
Figure
1. Reconstructed PET
and hepatobiliary contrast
MR (20mins
post Eovist
injection)
in axial,
sagittal and coronal views (from left to right). Rows from top to bottom are
non-MoCo, gated MoCo, RTA,
MCIR, and hepatobiliary
contrast
MR (breath-hold VIBE ).
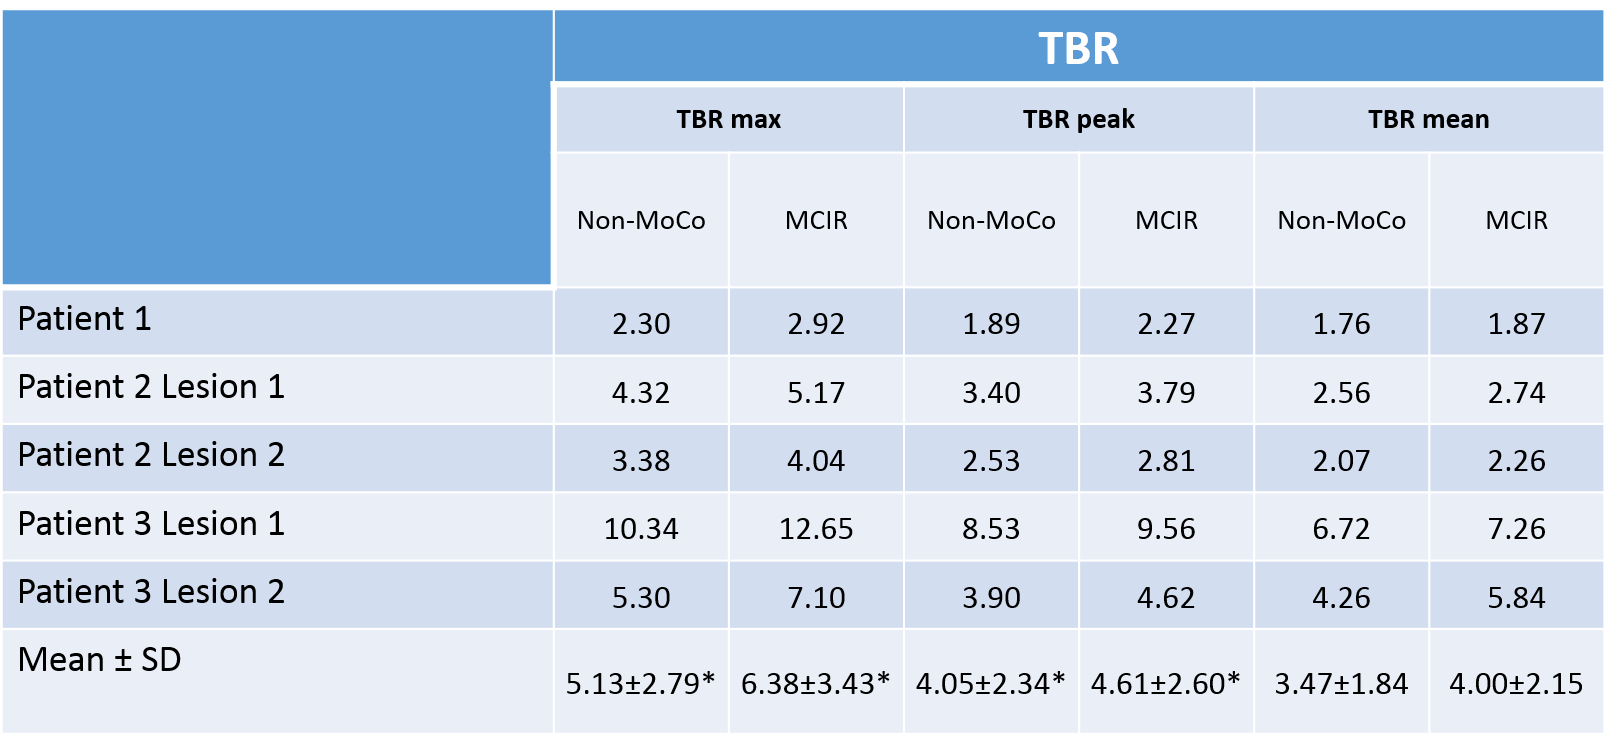
Table
1. Table of TBR values
at the 5 lesions of non-MoCo
and MCIR reconstruction.
*
implies statistically significant TBR
difference between non-MoCo
and MCIR
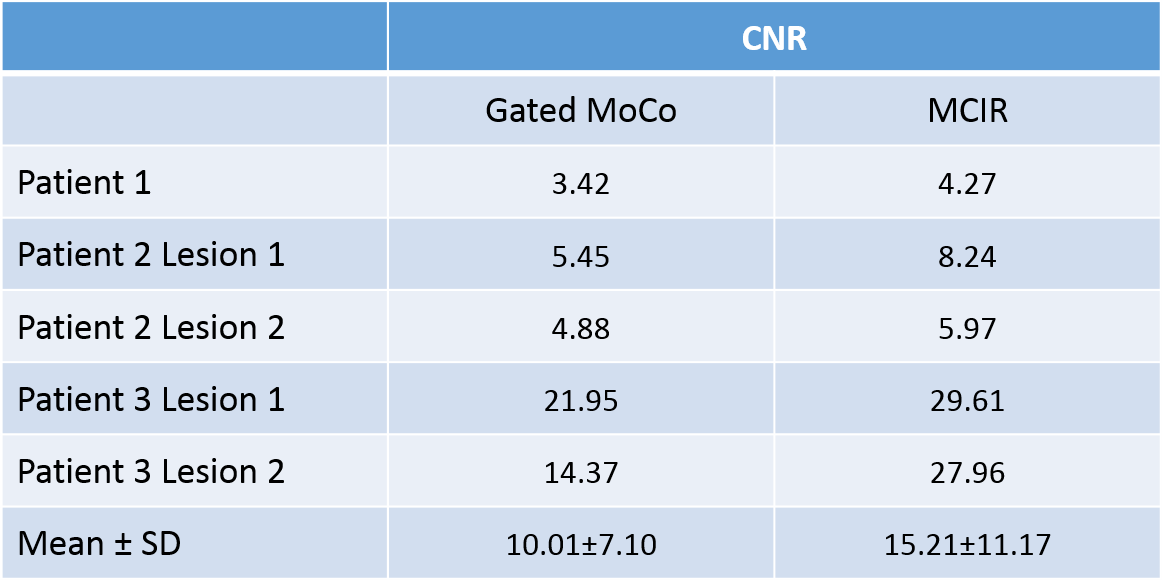
Table
2. Table of CNR
values in the five lesions of gated
MoCo and MCIR
reconstruction
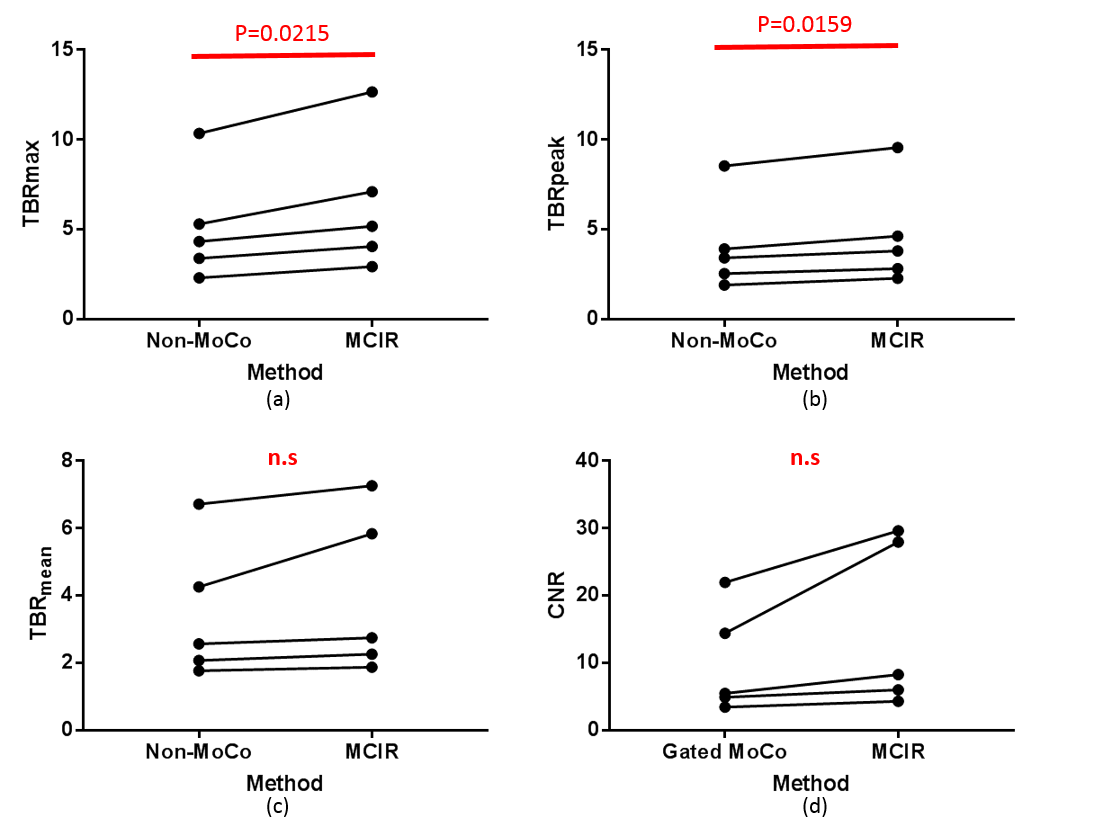
Figure
2.
Spaghetti plots of TBRmax,
TBRpeak,
TBRmean
between non-MoCo and MCIR (a,
b, c) and
CNR between gated MoCo and MCIR (d).
Statistically
significant p-values are shown in red at the top.