3342
Impact of cardiac function on objective evaluation of motion correction on cardiovascular magnetic resonance T1 mapping1Department of Radiology, West China Hospital of Sichuan University, Chengdu 610041, China, Chengdu, China, 2Department of Radiology, Key Laboratory of Obstetric & Gynecologic and Pediatric Diseases and Birth Defects of Ministry of Education, West China Second University Hospital, China, Chengdu, China, 3MR Collaboration, Siemens Healthineers Ltd., Shanghai, China, Shanghai, China
Synopsis
Quantitative evaluation of whether cardiac function affects the motion correction effect on cardiovascular magnetic resonance T1 mapping was conducted. Pre- and post-contrast T1 values, ECV values, SNR, and CNR were measured and compared between MOCO and non-MOCO images in groups with either preserved left ventricular function or impaired left ventricular function. Motion-corrected images showed good T1 and ECV value agreement compared to images without correction. The group with preserved left ventricular function showed greater improvement after motion correction than the impaired left ventricular function group.
Introduction
Quantification of myocardial T1 relaxation and extracellular volume (ECV) has potential value for the diagnosis of various heart diseases1,2. Patients are often told to hold their breath during the MR scan in order to stop the movement of the chest which would likely cause image artifacts. However, it is difficult for many patients, especially the elderly and those with left ventricular dysfunction, to strictly comply with this request. This may lead to severe image artifacts and unsuccessful MR scans3,4. The image motion correction (MOCO) technique allows patients to breathe freely during the MR scan and uses MOCO algorithms to reduce motion artifacts, allowing higher-quality MR images5-11. The MOCO technique has been applied to several sequences, such as phase-sensitive inversion recovery with motion correction (PSIR-MOCO) for late gadolinium enhancement assessment and modified look-locker inversion recovery (MOLLI) for T1-mapping imaging3,12. However, normal breathing is still preferred under these circumstances. The performance of MOCO for patients with left ventricular dysfunction who may have inconsistent and less regular breathing patterns is still unclear. In this study, we explored whether the implementation of MOCO in MOLLI sequencing would affect the clinical assessment of cardiac function.Methods
We retrospectively recruited 56 patients (38 males, 30 females, mean age 58.0±12.9 years) with diabetes mellitus (DM), end-stage renal disease (ESRD), chronic total occlusion of the coronary artery (CTO) or other diseases, as well as 14 asymptomatic participants. All cardiovascular magnetic resonance scans were performed using a 3T MR scanner (MAGNETOM Skyra, Siemens Healthcare, Erlangen, Germany) with an 18-channel body coil combined with a 32-channel phased-array spine coil (12 of 32 channels were used). The consecutive standard short-axis cine images as well as T1-mapping examinations with and without MOCO were acquired. All T1 maps were obtained using the MOLLI sequence with 5(3)3 and 4(1)3(1)2 scan schemes for pre- and post-contrast T1-mapping imaging, respectively. The commercially available software cvi42 (Circle Cardiovascular Imaging Inc., Calgary, Alberta, Canada) was used by an experienced observer for image analysis. The endocardial and epicardial borders for the myocardium and blood pool were manually delineated in short-axis cine and T1-mapping images to obtain the left ventricular ejection fraction (left ventricular ejection fraction [EF]), T1 and ECV values, signal-to-noise ratio (SNR), and contrast-to-noise ratio (CNR). To explore the impact of cardiac function on MOCO, the participants were divided into either a left ventricular dysfunction group (left ventricular EF ≤ 50%), or a preserved left ventricular function group (left ventricular EF>50%). MedCalc 18.9.1 (MedCalc Software, Ostend, Belgium) was used for the statistical analyses. The agreement between MOCO and non-MOCO sequencing was assessed using a concordance correlation coefficient (CCC). The paired-sample t-test or Mann‐Whitney U test was used to compare the SNR and CNR. A two-tailed p-value < 0.05 was considered to be statistically significant.Results
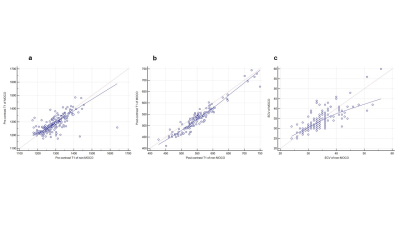
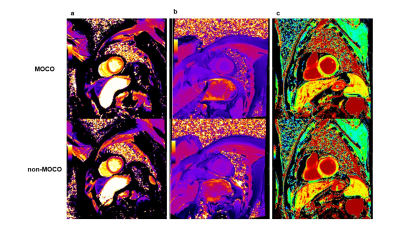
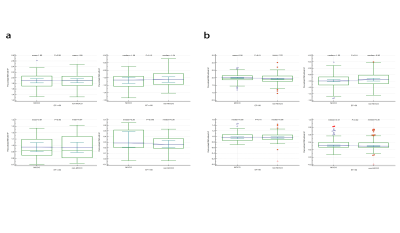
There were good to excellent correlations between the MOCO and non-MOCO groups in native T1 values, post-contrast T1 values, and ECV values measurement (CCC = 0.66, CCC = 0.90 and CCC = 0.76, respectively) (Figure 1). 22.1% (15/68) of subjects were identified as having left ventricular dysfunction according to their left ventricular EF. An improved image quality was found after motion correction (Figure 2). For the pre-contrast T1 mapping images, a higher SNR (2.00 ±0.27 vs. 1.93±0.29) and CNR (-1.00 [-1.12 to -0.87] vs. -0.96 [-1.09 to -0.81]) were shown in the MOCO images than in the non-MOCO images (all P<0.01) in the preserved left ventricular function group. In the left ventricular dysfunction group, there were no significant differences in the SNR and CNR between the MOCO and non-MOCO images. For the post-contrast T1 maps, MOCO images showed a higher CNR than non-MOCO images both in subjects with (0.28 [0.20 to 0.52] vs. 0.26 [0.19 to 0.36]) and without left ventricular dysfunction (0.31 [0.26 to 0.40] vs. 0.30 [0.26 to 0.38]) (all P<0.05) (Figure 3).Discussion
Dyspnea and impaired tolerance to physical activity or exercise are the primary features of heart failure which may lead to difficulty in correcting motion artifacts. In total, image quality was improved by the MOCO technique, especially in those patients who showed low cooperation during the exam. For patients with preserved left ventricular function, higher SNR and CNR were shown in the MOCO images than the non-MOCO ones, suggesting a better image quality of the MOCO technique. As T1 mapping is a quantitative method, higher SNR and CNR will make the quantitative value more stable and reliable. Therefore, it is highly recommended to use this MOCO technique in the MOLLI sequence for obtaining myocardial T1 values.Conclusions
Our study demonstrated that the T1 values derived from MOCO technique consistent well with the non-MOCO results. Besides, the MOCO technique showed a better image quality and was more reliable in patients with preserved left ventricular function.Acknowledgements
We thank Ms. Yuming Li, Mr. Kai Zhang, Mr. Lei Li and Mr. Fei Zhao for their assistance to the patient enrollment.
This work is funded by the 1.3.5 project for disciplines of excellence, West China Hospital, Sichuan University [grant number: ZYGD18019].
References
1. Messroghli DR, Moon JC, Ferreira VM, et al. Clinical recommendations for cardiovascular magnetic resonance mapping of T1, T2, T2* and extracellular volume: A consensus statement by the Society for Cardiovascular Magnetic Resonance (SCMR) endorsed by the European Association for Cardiovascular Imaging (EACVI). Journal of cardiovascular magnetic resonance 2017; 19(1):75.
2. Muscogiuri G, Suranyi P, Schoepf UJ, et al. Cardiac Magnetic Resonance T1-Mapping of the Myocardium: Technical Background and Clinical Relevance. Journal of Thoracic Imaging 2018; 33(2):71-80.
3. Xue H, Greiser A, Zuehlsdorff S, et al. Phase-sensitive inversion recovery for myocardial T1 mapping with motion correction and parametric fitting. Magn Reson Med 2013; 69(5):1408-1420.
4. Xue H, Shah S, Greiser A, et al. Motion correction for myocardial T1 mapping using image registration with synthetic image estimation. Magn Reson Med 2012; 67(6):1644-1655.
5. Menon RG, Miller GW, Jeudy J, Rajagopalan S, Shin T. Free breathing three-dimensional late gadolinium enhancement cardiovascular magnetic resonance using outer volume suppressed projection navigators. Magn Reson Med 2017; 77(4):1533-1543.
6. Cross R, Olivieri L, O'Brien K, Kellman P, Xue H, Hansen M. Improved workflow for quantification of left ventricular volumes and mass using free-breathing motion corrected cine imaging. Journal of cardiovascular magnetic resonance 2016; 18:10.
7. Roujol S, Basha TA, Weingartner S, et al. Impact of motion correction on reproducibility and spatial variability of quantitative myocardial T2 mapping. Journal of cardiovascular magnetic resonance 2015; 17:46.
8. Kellman P, Xue H, Spottiswoode BS, et al. Free-breathing T2* mapping using respiratory motion corrected averaging. Journal of cardiovascular magnetic resonance 2015; 17(1):3.
9. Jin N, da Silveira JS, Jolly MP, et al. Free-breathing myocardial T2* mapping using GRE-EPI and automatic non-rigid motion correction. Journal of cardiovascular magnetic resonance 2015; 17:113.
10. Piehler KM, Wong TC, Puntil KS, et al. Free-breathing, motion-corrected late gadolinium enhancement is robust and extends risk stratification to vulnerable patients. Circulation: Cardiovascular Imaging 2013; 6(3):423-432.
11. Zhu Y, Kang J, Duan C, et al. Integrated motion correction and dictionary learning for free-breathing myocardial T1 mapping. Magn Reson Med 2018.
12. Kellman P, Arai AE, McVeigh ER, Aletras AH. Phase-sensitive inversion recovery for detecting myocardial infarction using gadolinium-delayed hyperenhancement. Magn Reson Med 2002; 47(2):372-383.
Figures


