3334
Validation of the Accuracy of Magnetic Resonance Elastography of the Liver via 3D Finite Element Modelling Simulation1NIHR Nottingham Biomedical Research Centre, Radiological Sciences, Division of Clinical Neuroscience, Queens Medical Centre, Nottingham, United Kingdom, 2Sir Peter Mansfield Imaging Centre, University of Nottingham, Nottingham, United Kingdom
Synopsis
In this novel study, magnetic resonance elastography (MRE) of the liver is simulated in a detailed 3D anthropomorphic finite element model of the human torso, to explore the influence of imaging spatial resolution and motion-based signal to noise ratio (SNR) on the accuracy of elastograms calculated by direct inversion. It was found that MRE accuracy was highly dependent on imaging voxel dimensions, motion-SNR and the ground truth material properties. These findings will guide the optimisation and development of future liver MRE methodology.
INTRODUCTION
Magnetic Resonance Elastography (MRE)1 has been widely adopted as a biomarker of liver fibrosis and cirrhosis2. However, the accuracy of clinical in vivo MRE is difficult to assess, as comparison with ex vivo measurements is usually not feasible. In this study, finite element model (FEM) based simulation was employed to validate liver MRE, using a detailed anthropomorphic FEM of the human torso. The accuracy of MRE direct inversion was evaluated at different imaging spatial resolutions, and different levels of simulated imaging noise.METHODS
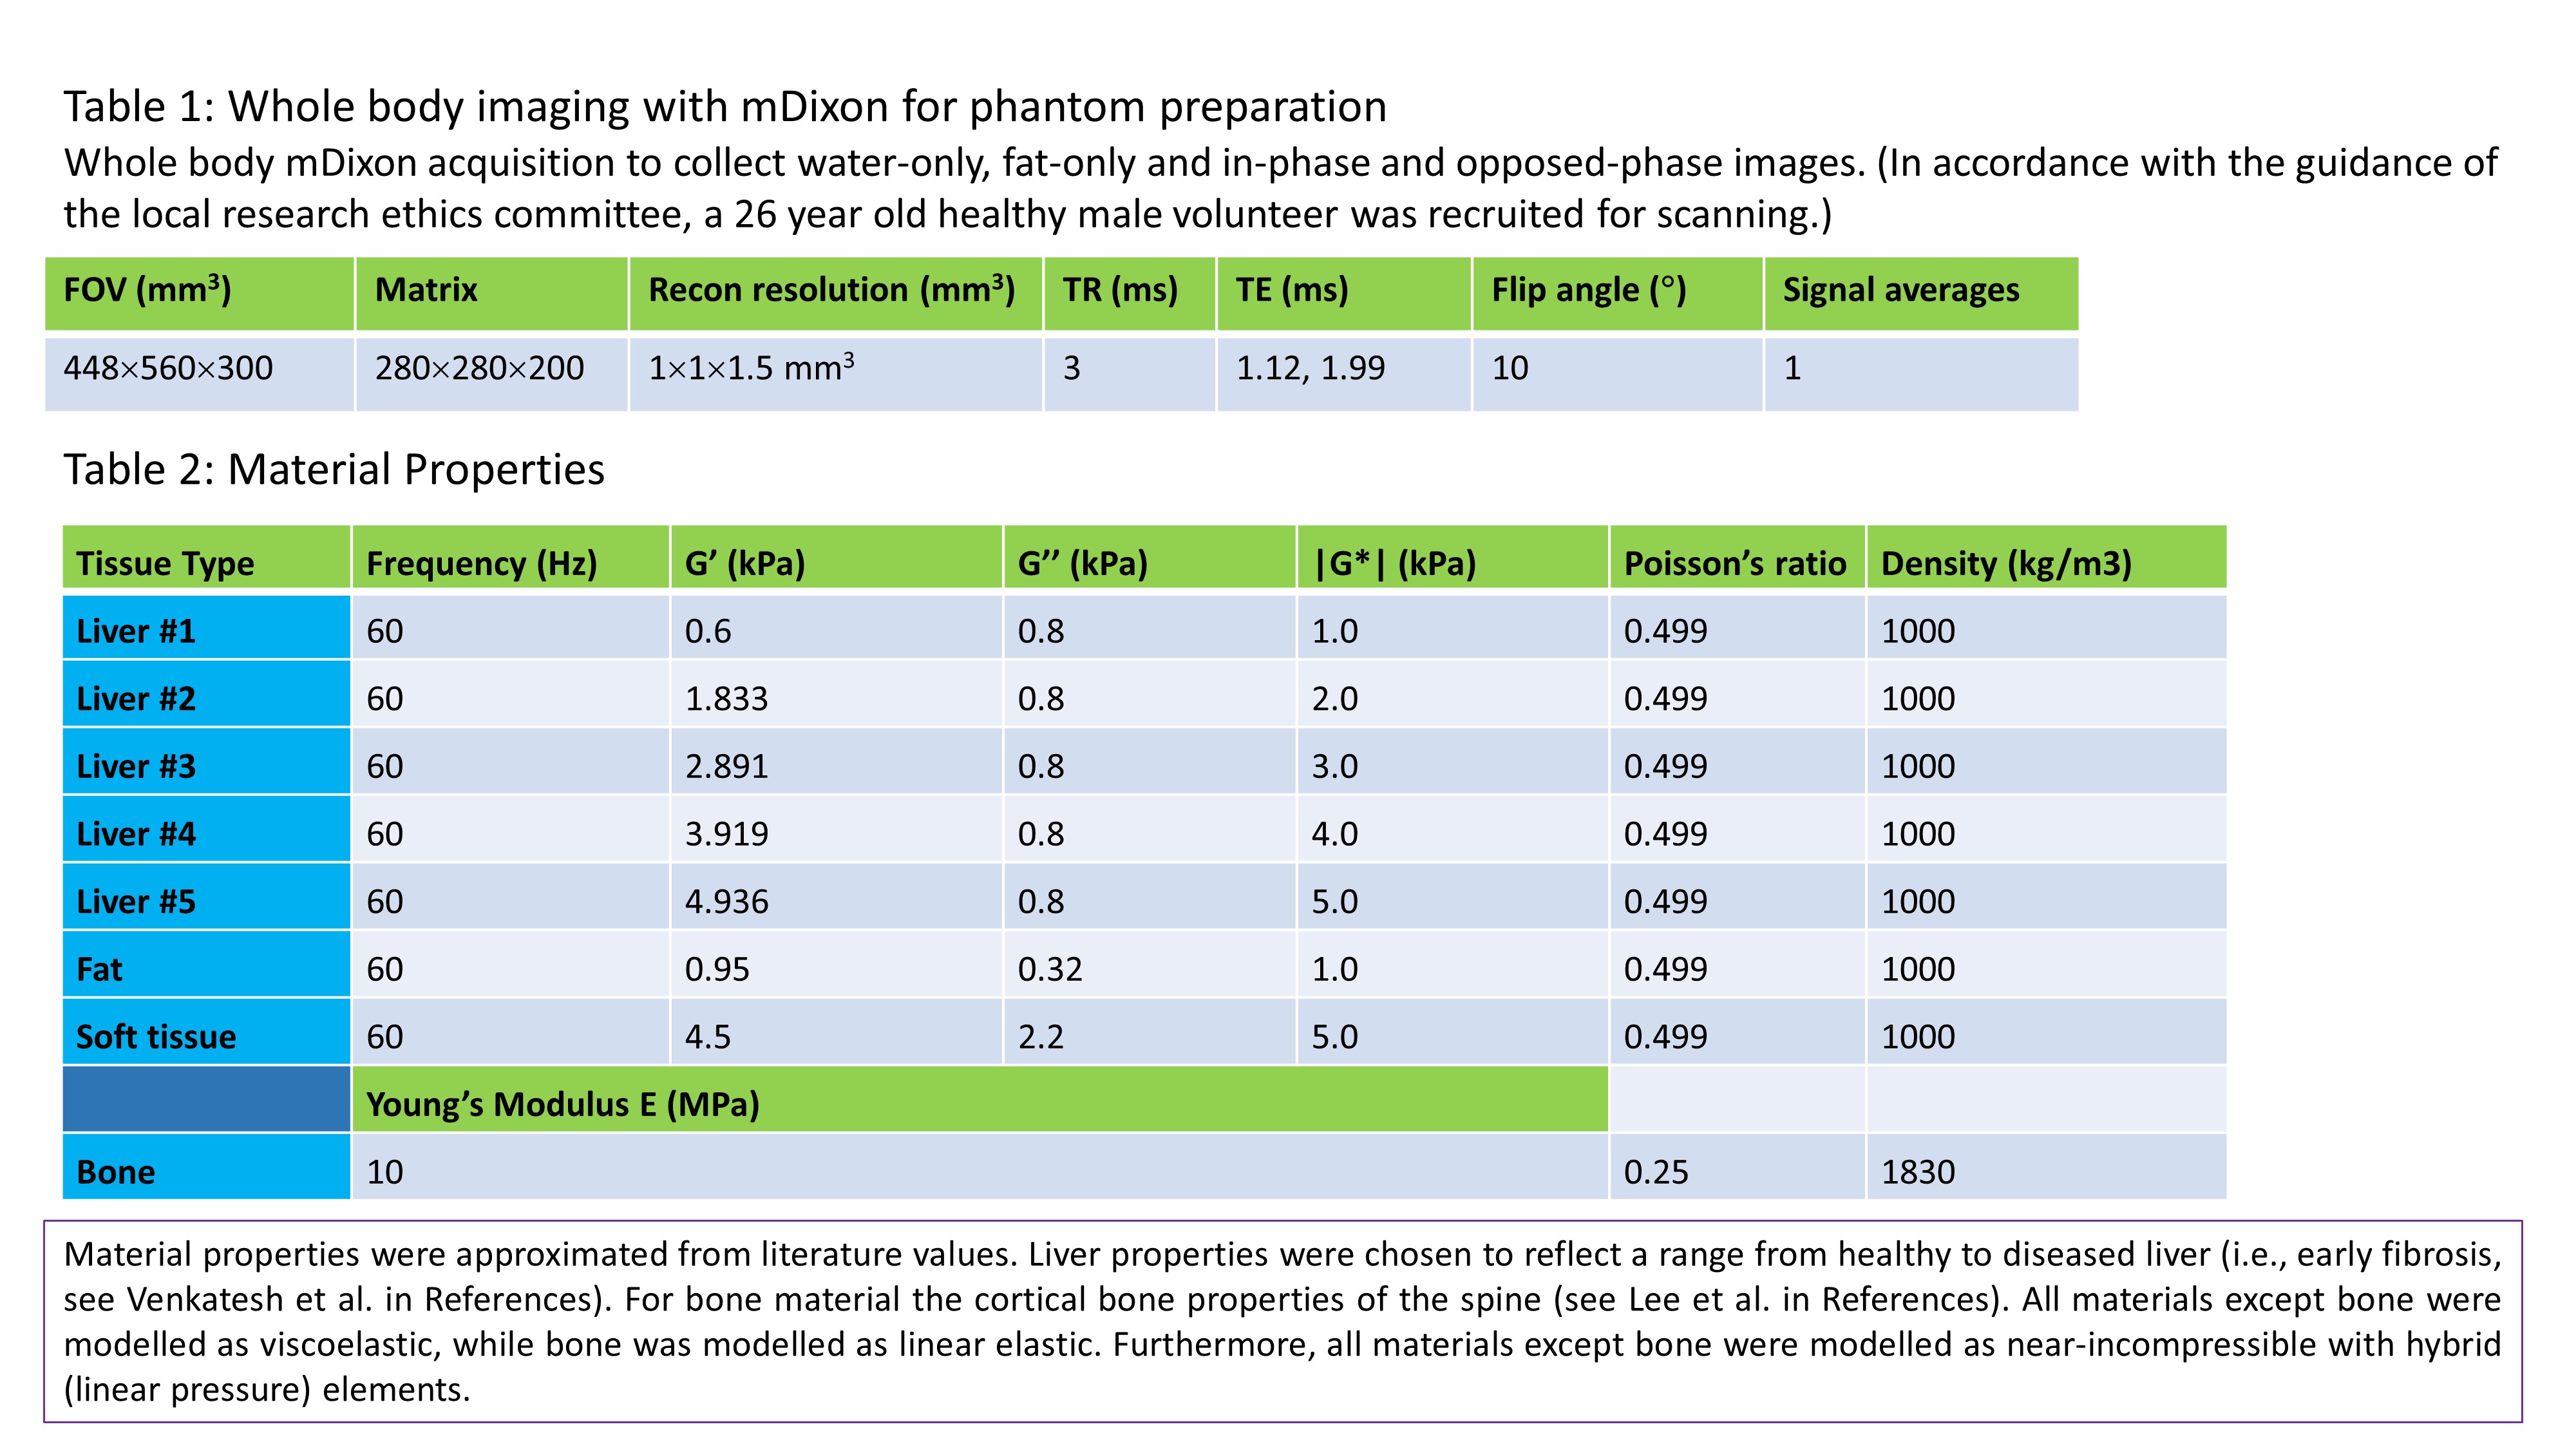
MRI: Whole-body mDixon3 data was acquired on a 3-Tesla Philips Ingenia MRI scanner (see table 1 in Fig. 1). Simulation: An anthropomorphic FEM of the torso was generated from this data, consisting of sub-regions: liver, bone (ribs, sternum and spine), fat and generalised soft tissue (Fig. 2, and table 2 in Fig 1.). The liver was simulated as a homogeneous material (e.g., Liver #1). MRE was simulated by delivering a 30 μm amplitude harmonic displacement at 60 Hz frequency in the anterior-posterior direction at the recommended position for clinical liver MRE (Fig. 2f). The simulated nodal displacements were interpolated onto an isotropic “virtual voxel” grid with a step-size of 1 mm, using the MATLAB implementation of the “Natural Neighbour” interpolation algorithm, and later resampled to create a varying isotropic voxel size (2-5 mm). Phase-offset images were simulated for 8 phase offsets (α) by multiplying the resampled complex steady-state u(x) values (Eq. 1 in Fig. 2) by exp(iα), and taking the real component. Gaussian random noise was added to the displacements at 31 levels of motion-based signal to noise (SNR) in the range 1-1000. Inversion: Direct inversion4 was used to calculate the magnitude of the complex shear modulus |G*|. To compensate for noise amplification from derivative calculation, the curl of u was smoothed with a (3×3×3) average filter.RESULTS
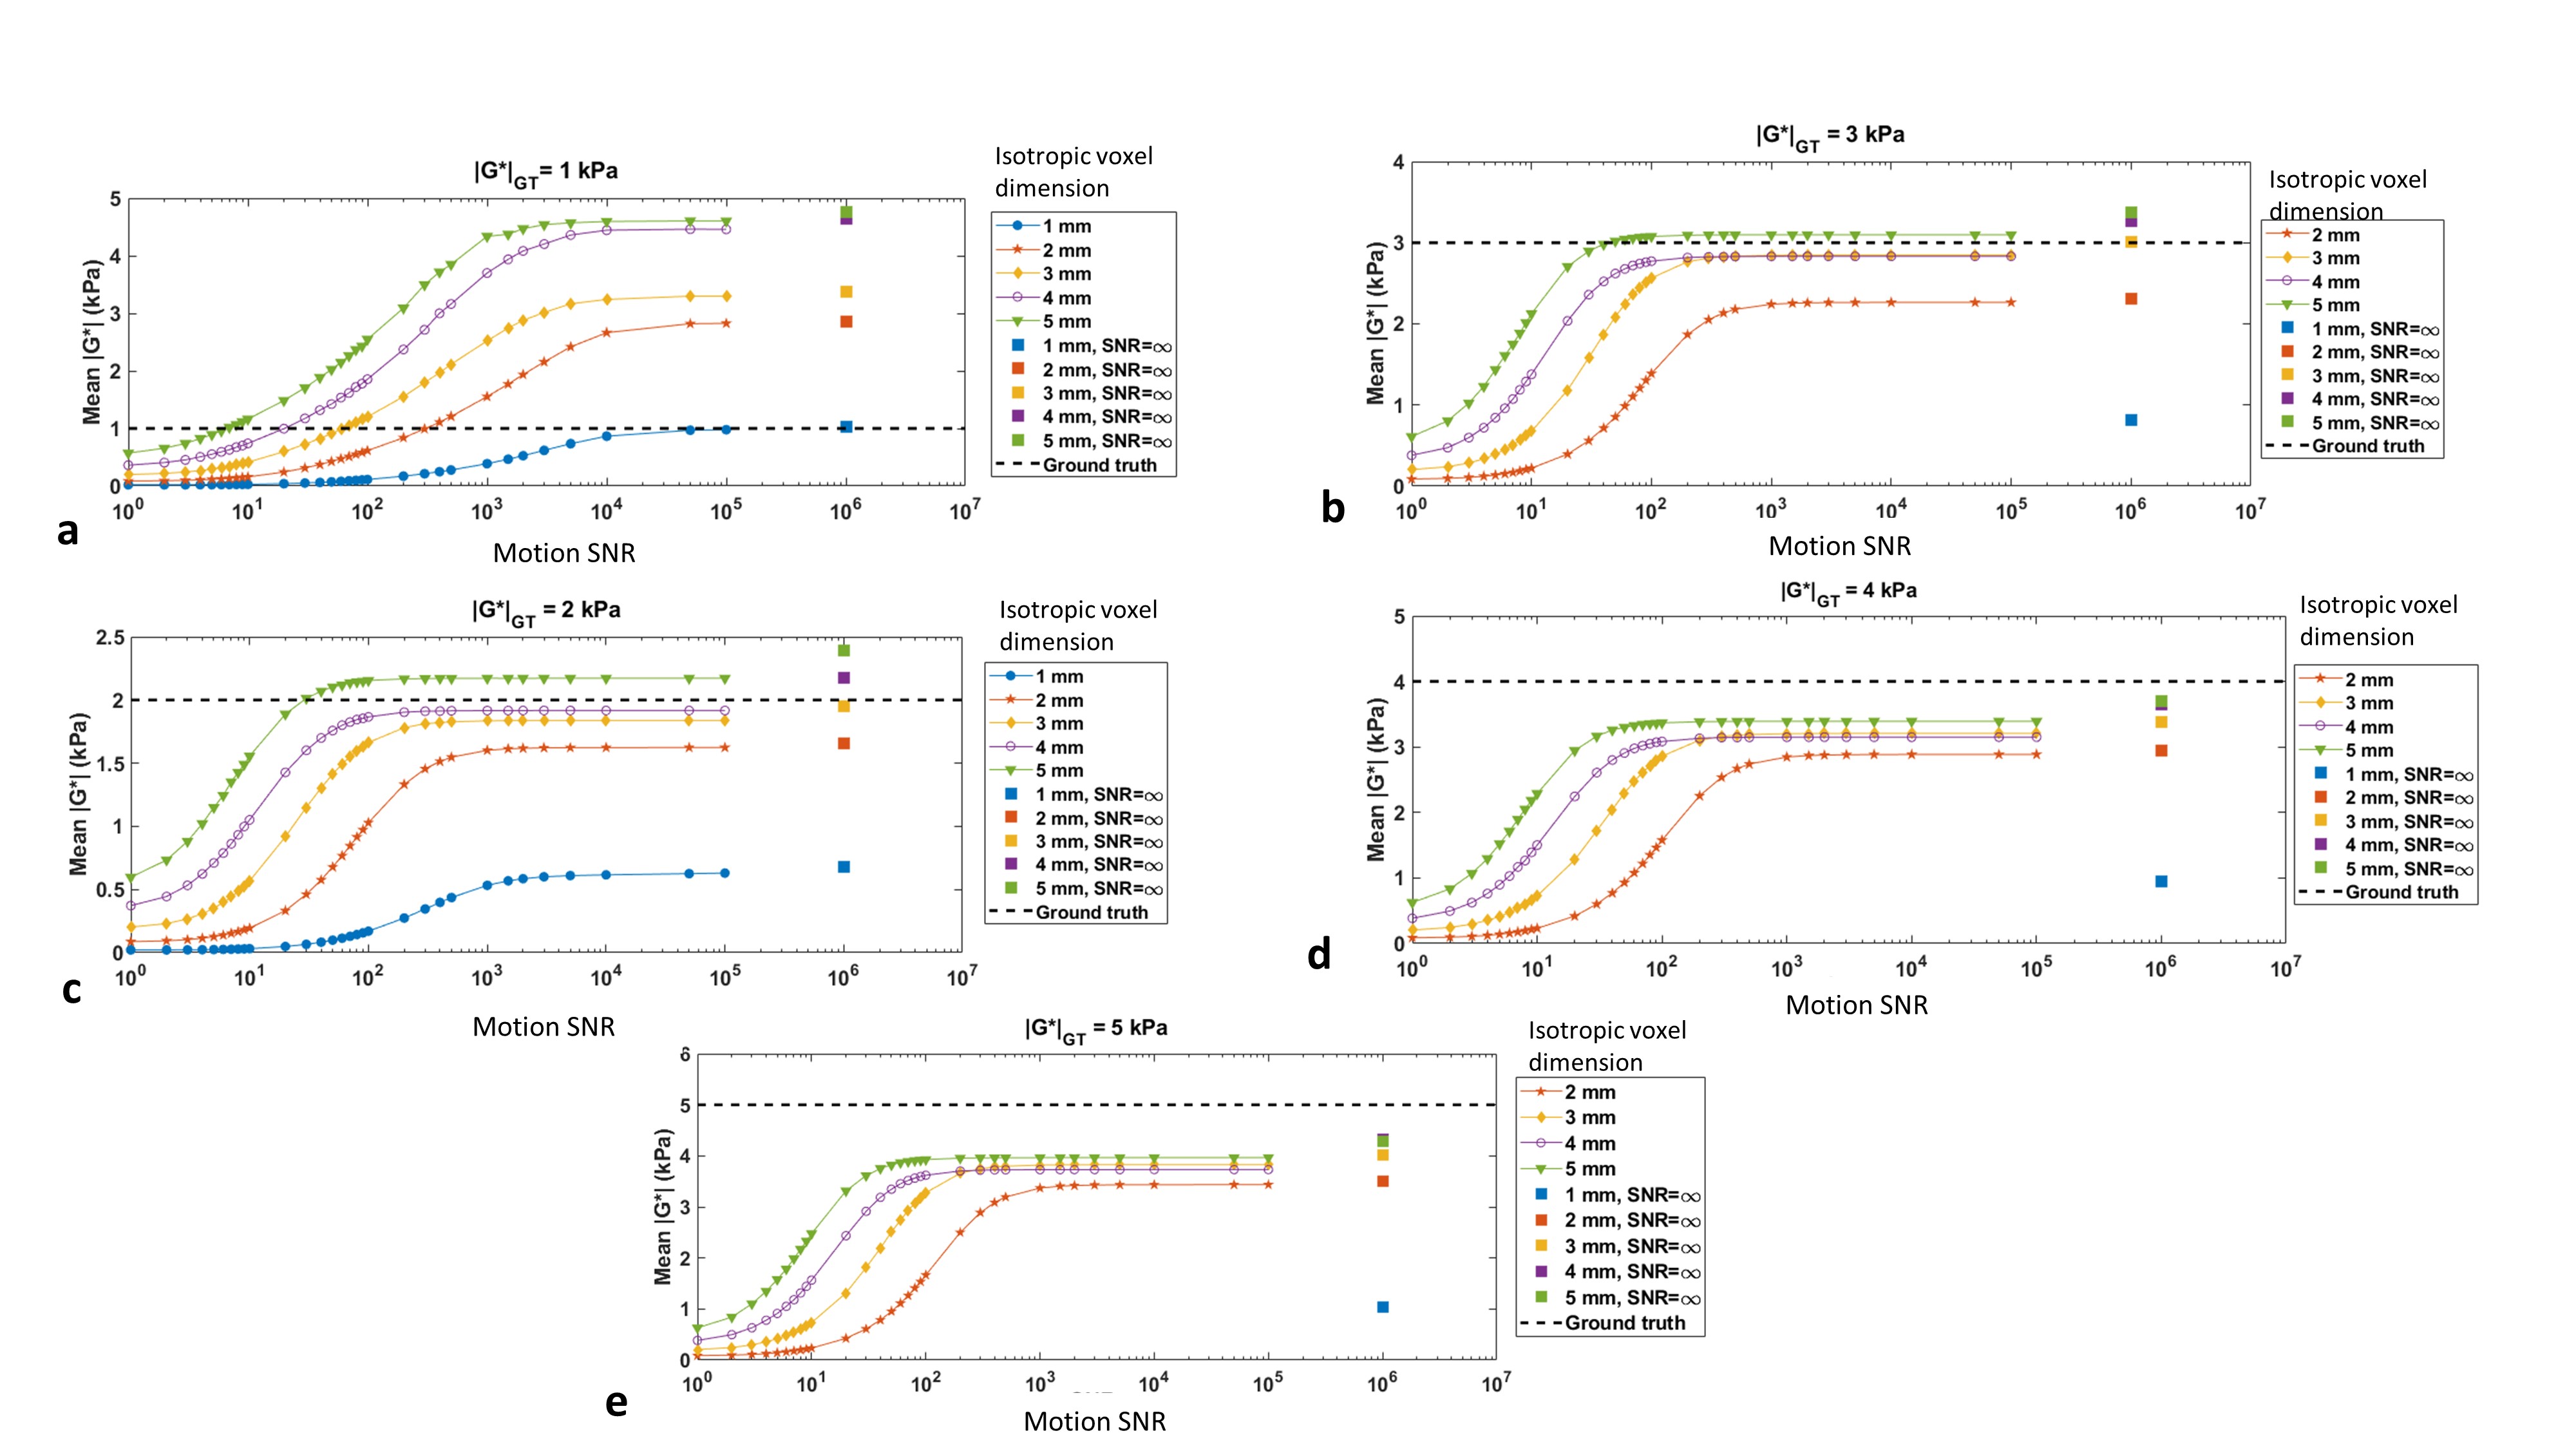
Displacements: The simulated displacement fields resembled acquired MRE data (Fig. 4a). For 1 kPa (i.e., healthy liver) at 60 Hz the waves were attenuated before reaching the centre of the liver. At higher stiffness values different wave patterns emerged, including wave interference. Calculated stiffness vs. motion SNR: Figure 3 presents the mean inversion calculated |G*| over the liver volume versus motion SNR for different resolutions, and Fig. 4b and Fig. 5 show example elastograms of a central liver slice. In general, increased motion SNR led to more accurate estimates of |G*|, except for |G*|GT= 1kPa (GT=ground truth), where |G*| is over estimated in the centre of the liver due to low wave amplitudes. For softer tissue, e.g., 2 kPa, larger voxel sizes (5 mm) led to an overestimate of |G*| at higher motion SNRs. For stiffer tissue (e.g., 5 kPa) |G*| was more underestimated with smaller voxel sizes. Figure 4b illustrates how undersampling of the wave field with larger voxels can cause a spurious structure in the elastograms, e.g. |G*|GT=3 kPa with 5-mm-voxels. However Fig. 5 demonstrates how these undersampling effects can be offset by added noise. For example at 2 kPa the error on mean |G*| is lowest at motion SNR=10, i.e., 2% error, compared with 16 % error in the case of no added noise.DISCUSSION
In agreement with previous work with 2D MRE simulation7, this study demonstrates that the accuracy of liver MRE with direct inversion is heavily dependent on the imaging resolution (wave discretization), the motion SNR, and the underlying material properties (which vary with frequency in viscoelastic tissue). The effect of varying spatial resolution on direct inversion accuracy is associated with undersampling of complex 3D wave patterns, which are rendered more complicated through wave interference, as the waves propagated through the rib-cage combine in the liver with waves reflected back off the spine and other abdominal anatomy. The addition of noise introduces further inaccuracies, but noise can sometimes offset the effects of undersampling. As imaging SNR is also a function of imaging resolution, voxel dimensions should be chosen with care. While 60 Hz was employed in this study, as it is a typical frequency employed in liver MRE, this work demonstrates that for healthy liver (1 kPa) large overestimates in |G*| can occur due to wave attenuation in the liver centre. In clinical liver MRE, lowering the frequency to 50 Hz is likely to offset this effect, and some liver MRE methods incorporate multiple frequencies8. Another approach is to incorporate a metric to eliminate data with low wave amplitudes and/or high noise fluctuations from analysis, such as the error on polynomial fits to the wave data9. While previous MRE simulation work has been carried out in simplified geometry7, or in liver FEMs without surrounding tissue10, to the best of the authors' knowledge this is the first study to simulate MRE wave propagation through a full anthropomorphic torso model, including a detailed rib cage and other anatomy.CONCLUSION
This novel study has demonstrated important considerations for the development and optimization of liver MRE. It was found that the accuracy of elastograms was heavily dependent on the imaging spatial resolution, the motion-based SNR and on the ground truth material properties. The findings will guide the selection of parameters and optimisation of future liver MRE acquisitions.Acknowledgements
This work was supported by a Medical Research Council Grant. Financial support was also received from the NIHR Biomedical Research Centre (NIHR BRC); Gastrointestinal and Liver Disorder theme and Cross-Cutting Imaging theme, Nottingham University Hospitals NHS Trust and University of Nottingham.References
1. McGrath DM. Magnetic resonace elastography. In: Al Mayah A, editor. Biomechanics of Soft Tissues: Principles and Applications. 1 ed. Boca Raton: CRC Press; 2018. p 55-94.
2. Singh S, Venkatesh SK, Wang Z, Miller FH, Motosugi U, Low RN, Hassanein T, Asbach P, Godfrey EM, Yin M, Chen J, Keaveny AP, Bridges M, Bohte A, Murad MH, Lomas DJ, Talwalkar JA, Ehman RL. Diagnostic performance of magnetic resonance elastography in staging liver fibrosis: a systematic review and meta-analysis of individual participant data. Clin Gastroenterol Hepatol 2015;13(3):440-451.e446.
3. Xiang QS. Two-point water-fat imaging with partially-opposed-phase (POP) acquisition: an asymmetric Dixon method. Magn Reson Med 2006;56(3):572-584.
4. McGrath DM, Ravikumar N, Wilkinson ID, Frangi AF, Taylor ZA. Magnetic resonance elastography of the brain: An in silico study to determine the influence of cranial anatomy. Magn Reson Med 2016;76(2):645-662
5. Venkatesh SK, Yin M, Ehman RL. Magnetic resonance elastography of liver: technique, analysis, and clinical applications. J Magn Reson Imaging 2013;37(3):544-555.
6. Lee CK, Kim YE, Lee CS, Hong YM, Jung JM, Goel VK. Impact response of the intervertebral disc in a finite-element model. Spine (Phila Pa 1976) 2000;25(19):2431-2439.
7. Papazoglou S, Hamhaber U, Braun J, Sack I. Algebraic Helmholtz inversion in planar magnetic resonance elastography. Phys Med Biol. 2008 Jun 21;53(12):3147-58.
8. Dittmann F, Hirsch S, Tzschatzsch H, Guo J, Braun J, Sack I. In vivo wideband multifrequency MR elastography of the human brain and liver. Magn Reson Med 2016;76(4):1116-1126.
9. Silva AM, Grimm RC, Glaser KJ, Fu Y, Wu T, Ehman RL, Silva AC. Magnetic resonance elastography: evaluation of new inversion algorithm and quantitative analysis method. Abdominal Imaging.2015 Apr;40(4):810-7.
10. Tomita S, Suzuki H, Kajiwara I, Nakamura G, Jiang Y, Suga M, Obata T, Tadano S. Numerical simulations of magnetic resonance elastography using finite element analysis with a linear heterogeneous viscoelastic model. J Vis (Tokyo) 2018;21(1):133-145.
12. Fang Q, Boas D. Tetrahedral mesh generation from volumetric binaryand gray-scale images. Proc IEEE Int Symp Biomed Imaging 2009:1142–1145.
Figures