3330
Magnetic Resonance Elastography and Computational Modeling of Indeterminate Pulmonary Nodules Mechanical Properties.1Department of Biomedical Engineering, The Ohio State University, Columbus, OH, United States, 2Department of Radiology, The Ohio State University Wexner Medical Center, Columbus, OH, United States, 3College of Medicine, The Ohio State University, Columbus, OH, United States, 4Division of Pulmonary, Critical Care, and Sleep Medicine, The Ohio State University Wexner Medical Center, Columbus, OH, United States
Synopsis
Many pulmonary diseases alter lung mechanical properties making lung stiffness an important biomarker. By using a Spin-Echo Echo Planar Imaging (SE-EPI) MRE sequence, a feasibility study was performed on 6 indeterminate pulmonary nodules (IPN) patients to determine the shear stiffness within the nodule and compare it with stiffness in the contralateral lung. It was found that in all the patients the median shear stiffness within the IPN was significantly higher than in the contralateral lung (1.77kPa vs 0.86kPa, p=0.008) Computational models based on MRE stiffness measurements also indicate decreased strain and increased strain gradients within the IPN.
Introduction
Lung diseases alter mechanical properties of the lung parenchyma1. One of those diseases are indeterminate pulmonary nodules (IPN). IPN is a tumor like cluster of tissue that varies in size and shape. IPNs are mostly benign but if the IPN size increase and/or has irregular shapes, there is an increased chance of the IPN being malignant. If malignant, it is crucial to initiate treatment at an early stage. However, IPNs are mostly asymptomatic and diagnosed by using chest x-ray or CT, which are used to track the progress of IPN’s size and shape2,3. Yet, with repetitive scans of x-ray and CT, the radiation exposure can lead to other complications in patients. Several studies have shown the feasibility of MRE to quantify the shear stiffness of the lungs1,4,5, which we hypothesize will enable early diagnose of malignant IPNs. The aim of this study was to investigate the shear stiffness of IPN by using MRE and compare it to contralateral healthy lung parenchyma within the same patient. Additionally, to further characterize IPN, computational finite element modeling (FEM) techniques were used to determine deformation patterns within the IPN that have been associated with increased metastatic capacity (i.e. strain and strain gradients).Methods
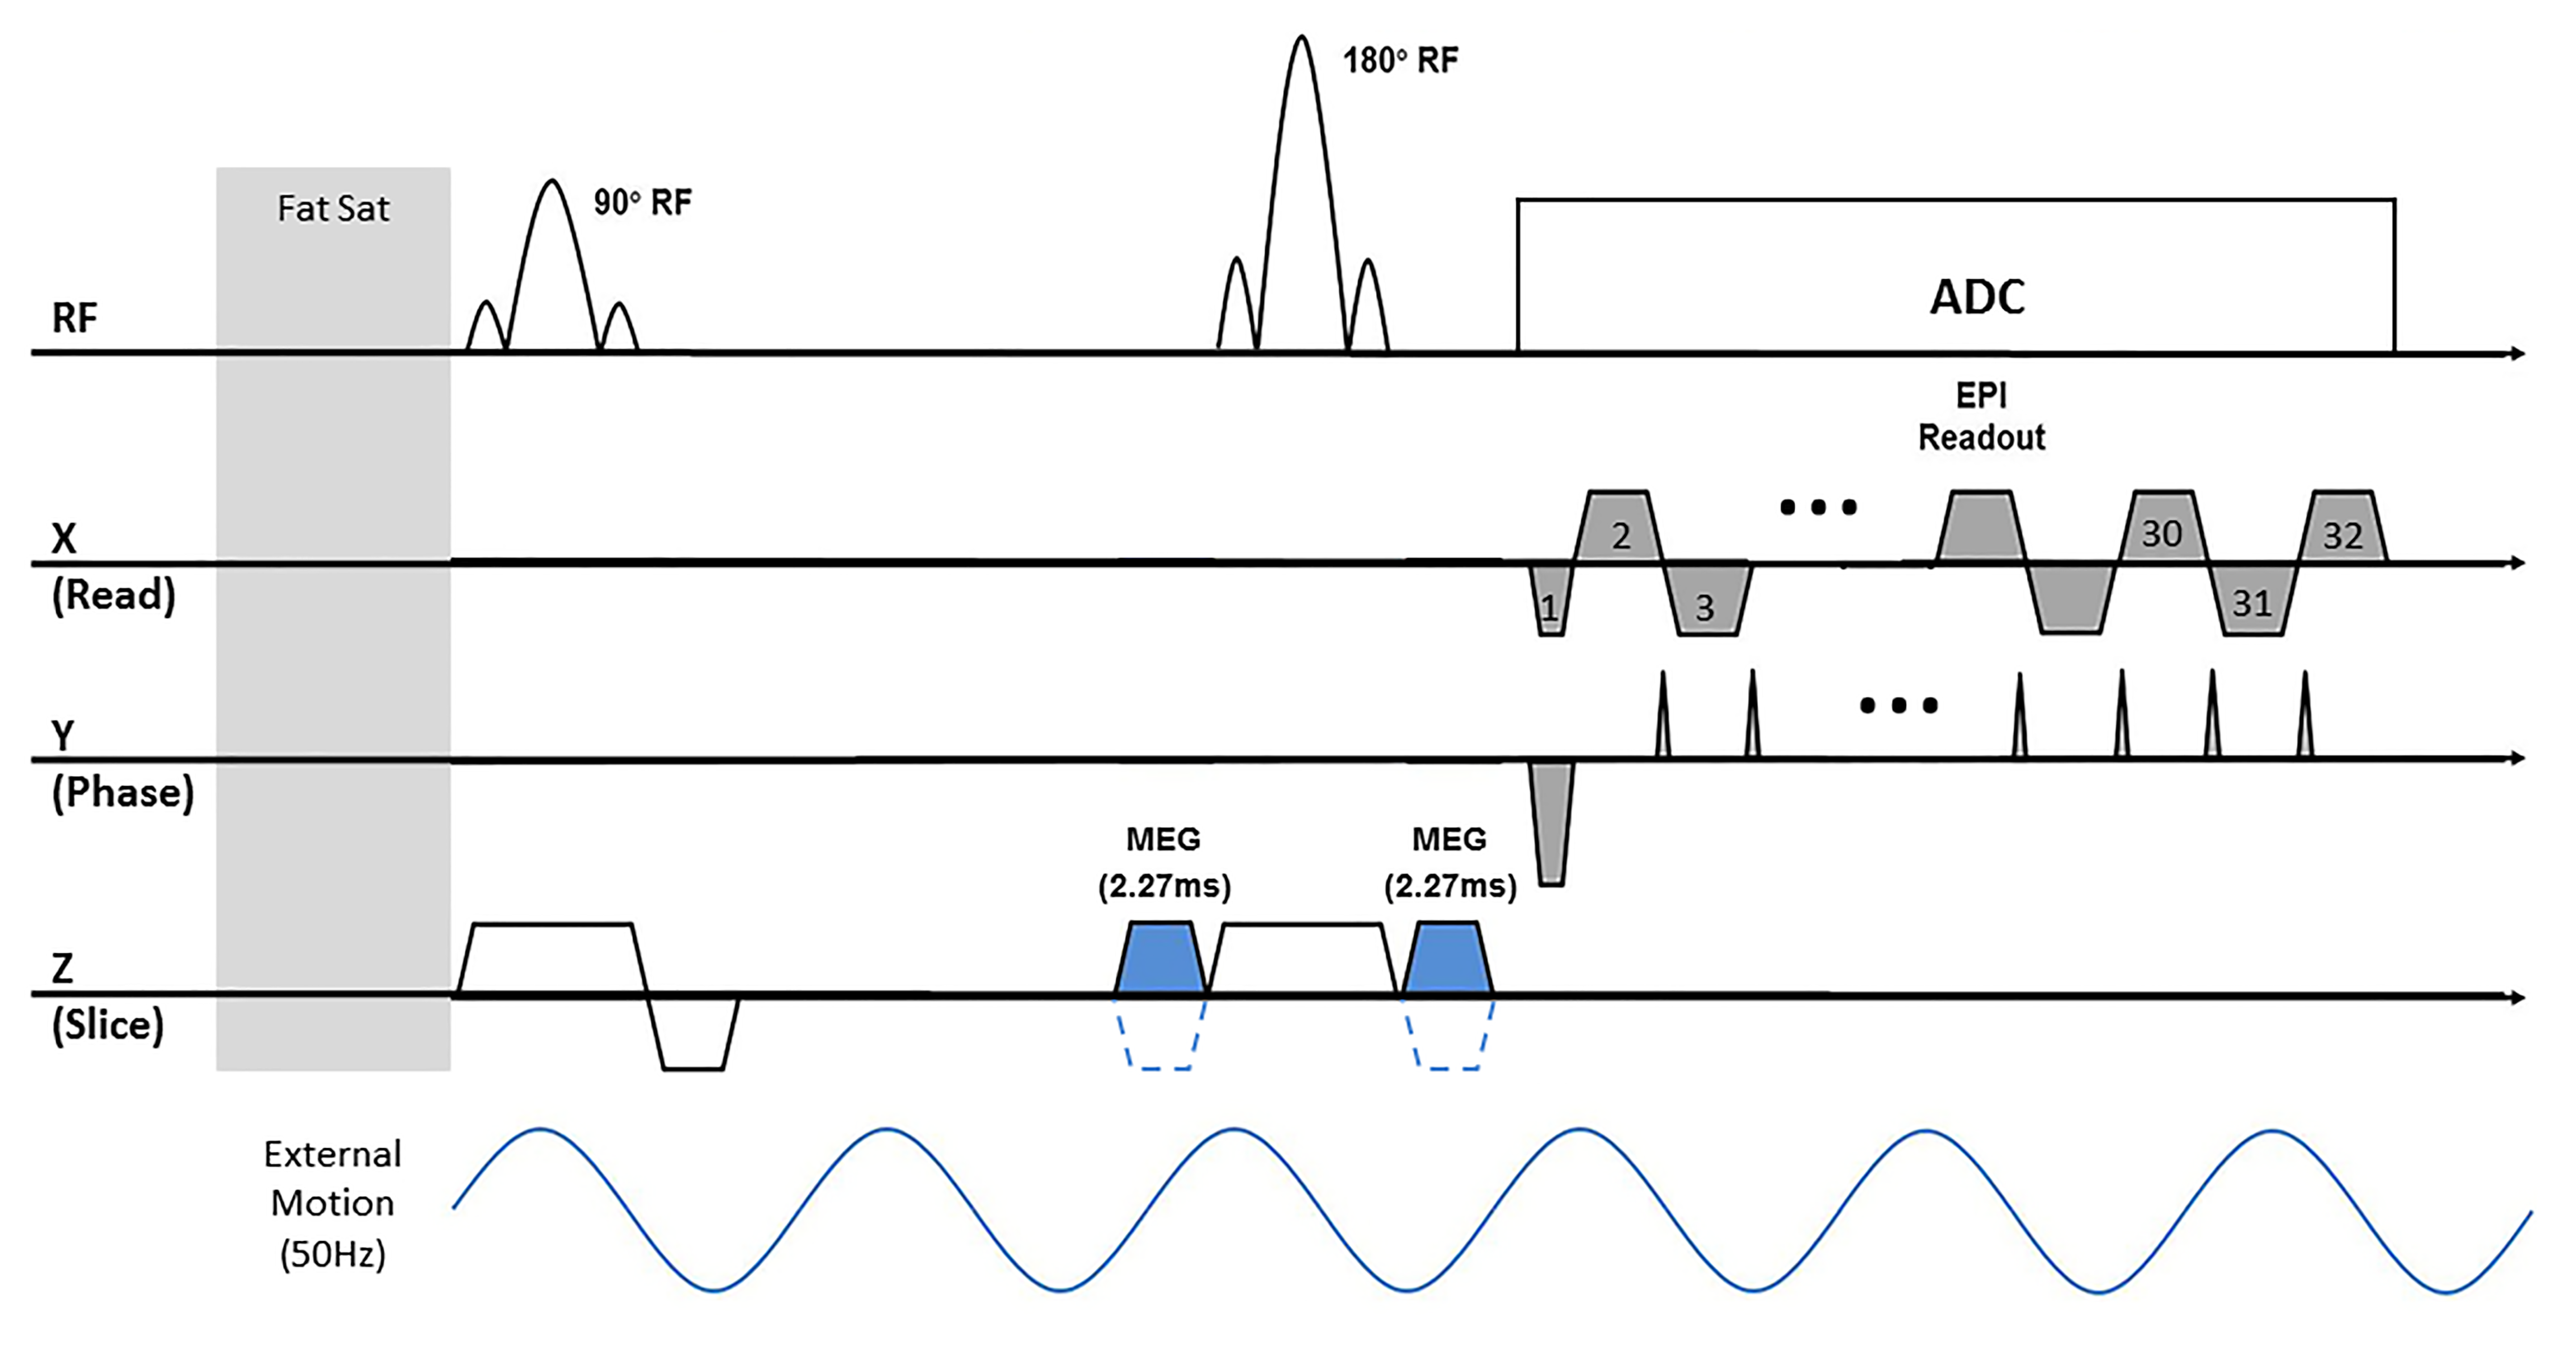
MRE Scans:Six IPN patients (5 males and a female, 59.6±10.9 years old) were scanned after using an approved IRB. Lung MRE scans covering both lungs was performed using a single shot SE-EPI sequence (Figure 1) in a 1.5T MR scanner (MAGNETOM Aera, Siemens Healthcare, Erlangen, Germany). Mechanical vibration (Resoundant, Rochester, MN, USA) of 50Hz was introduced into the lungs. The single shot SE-EPI sequence was used due to its speed of acquisition in which both right and left lungs were acquired in a breathhold of 17 seconds for each motion-encoding direction (i.e. X, Y, Z). Depending on the size of the lung, 11 to 17 transverse slices were acquired with a slice thickness of 10mm. All scans were acquired during a breathhold at residual volume (RV) without the use of respiratory navigators and without the need of noble gas. The scan parameters included FOV of 45x45cm2, acquisition matrix of 64x64, TR of 1020ms, and TE of 15ms. As shown in figure 1, two unipolar MEGs were placed around the 180° refocusing pulse with a period of 2.275ms (i.e. fractional encoding with a frequency of 220Hz combined) to achieve minimum possible TE. In addition, the MEGs were used as crushers for the 180° refocusing. To avoid motion and N/2 ghosting artifacts, a single shot acquisition was used with GRAPPA acceleration rate factor of 2.
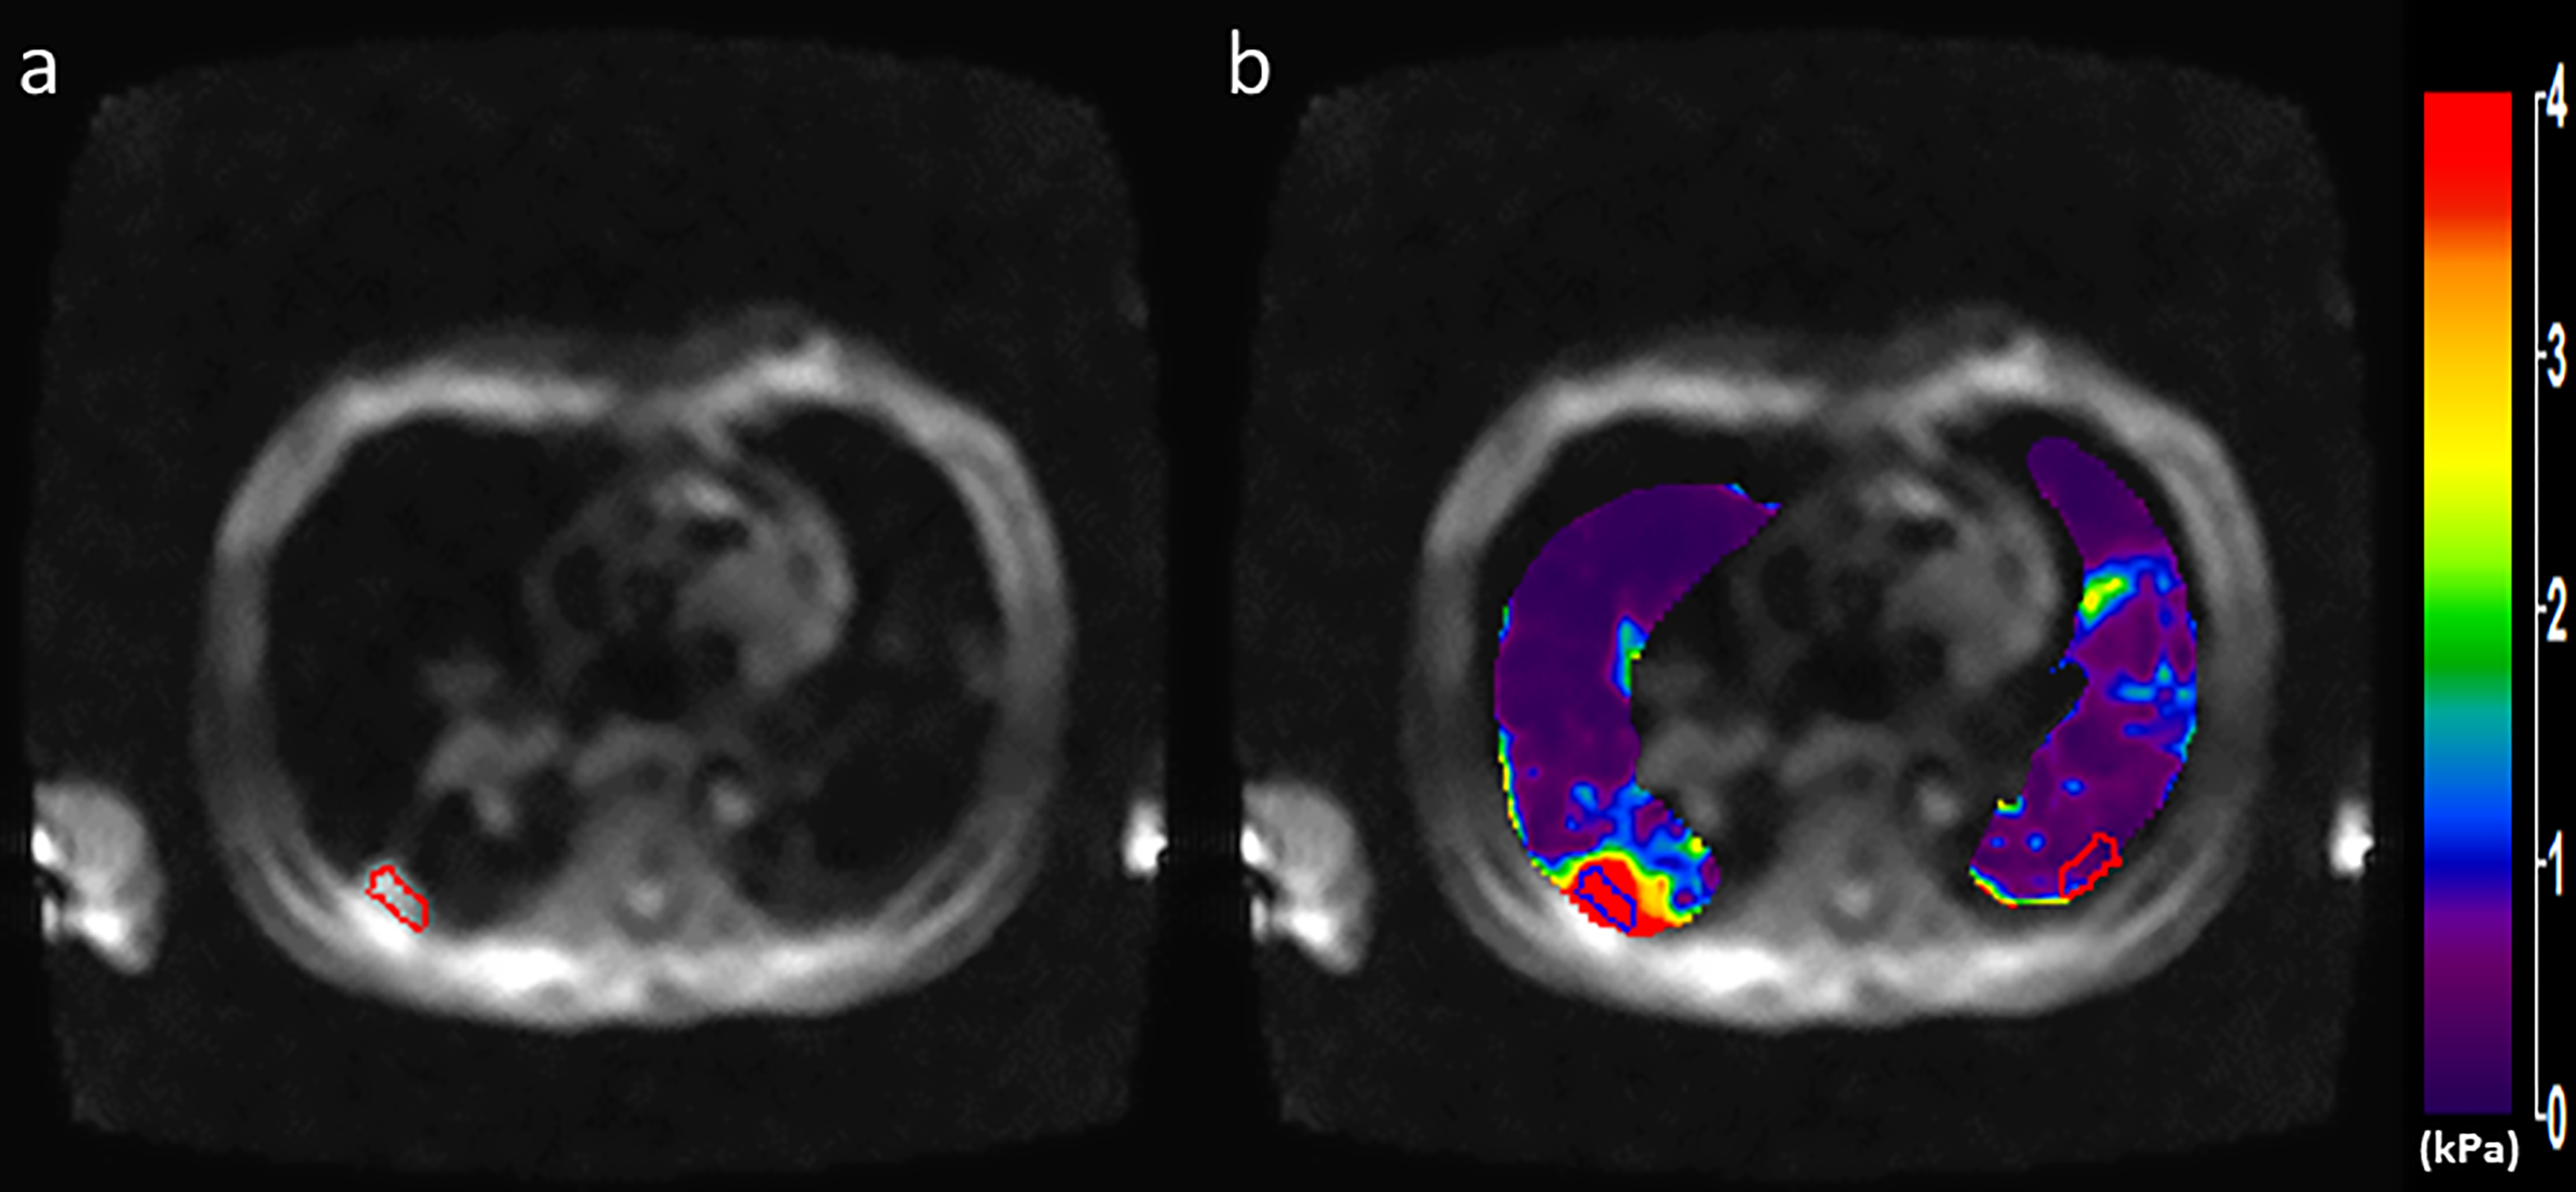
Lung density (LD) estimation scans were performed by using a GRE sequence involving four acquisitions with different TEs of 0.98, 1.62, 2.26, and 2.90ms to calculate T2* decay from which LD was estimated as described elsewhere5–7. LD measurement was used in the calculation of stiffness values. Since LD changes during the respiratory cycle, and to match the MRE measurements at RV, LD scans were performed with a 16-seconds breathhold at RV. Lung shear stiffness was calculated by using the 2D direct inversion algorithm (MRElab software, Mayo Clinic, Rochester, Minnesota, USA)8. To compare the shear stiffness between IPN and healthy lung tissue within a patient, an ROI was drawn on the IPN (blue ROI - figure 2b) and another ROI with the same dimensions was drawn on the healthy contralateral lung parenchyma (red ROI - figure 2b).
Computational Modeling:
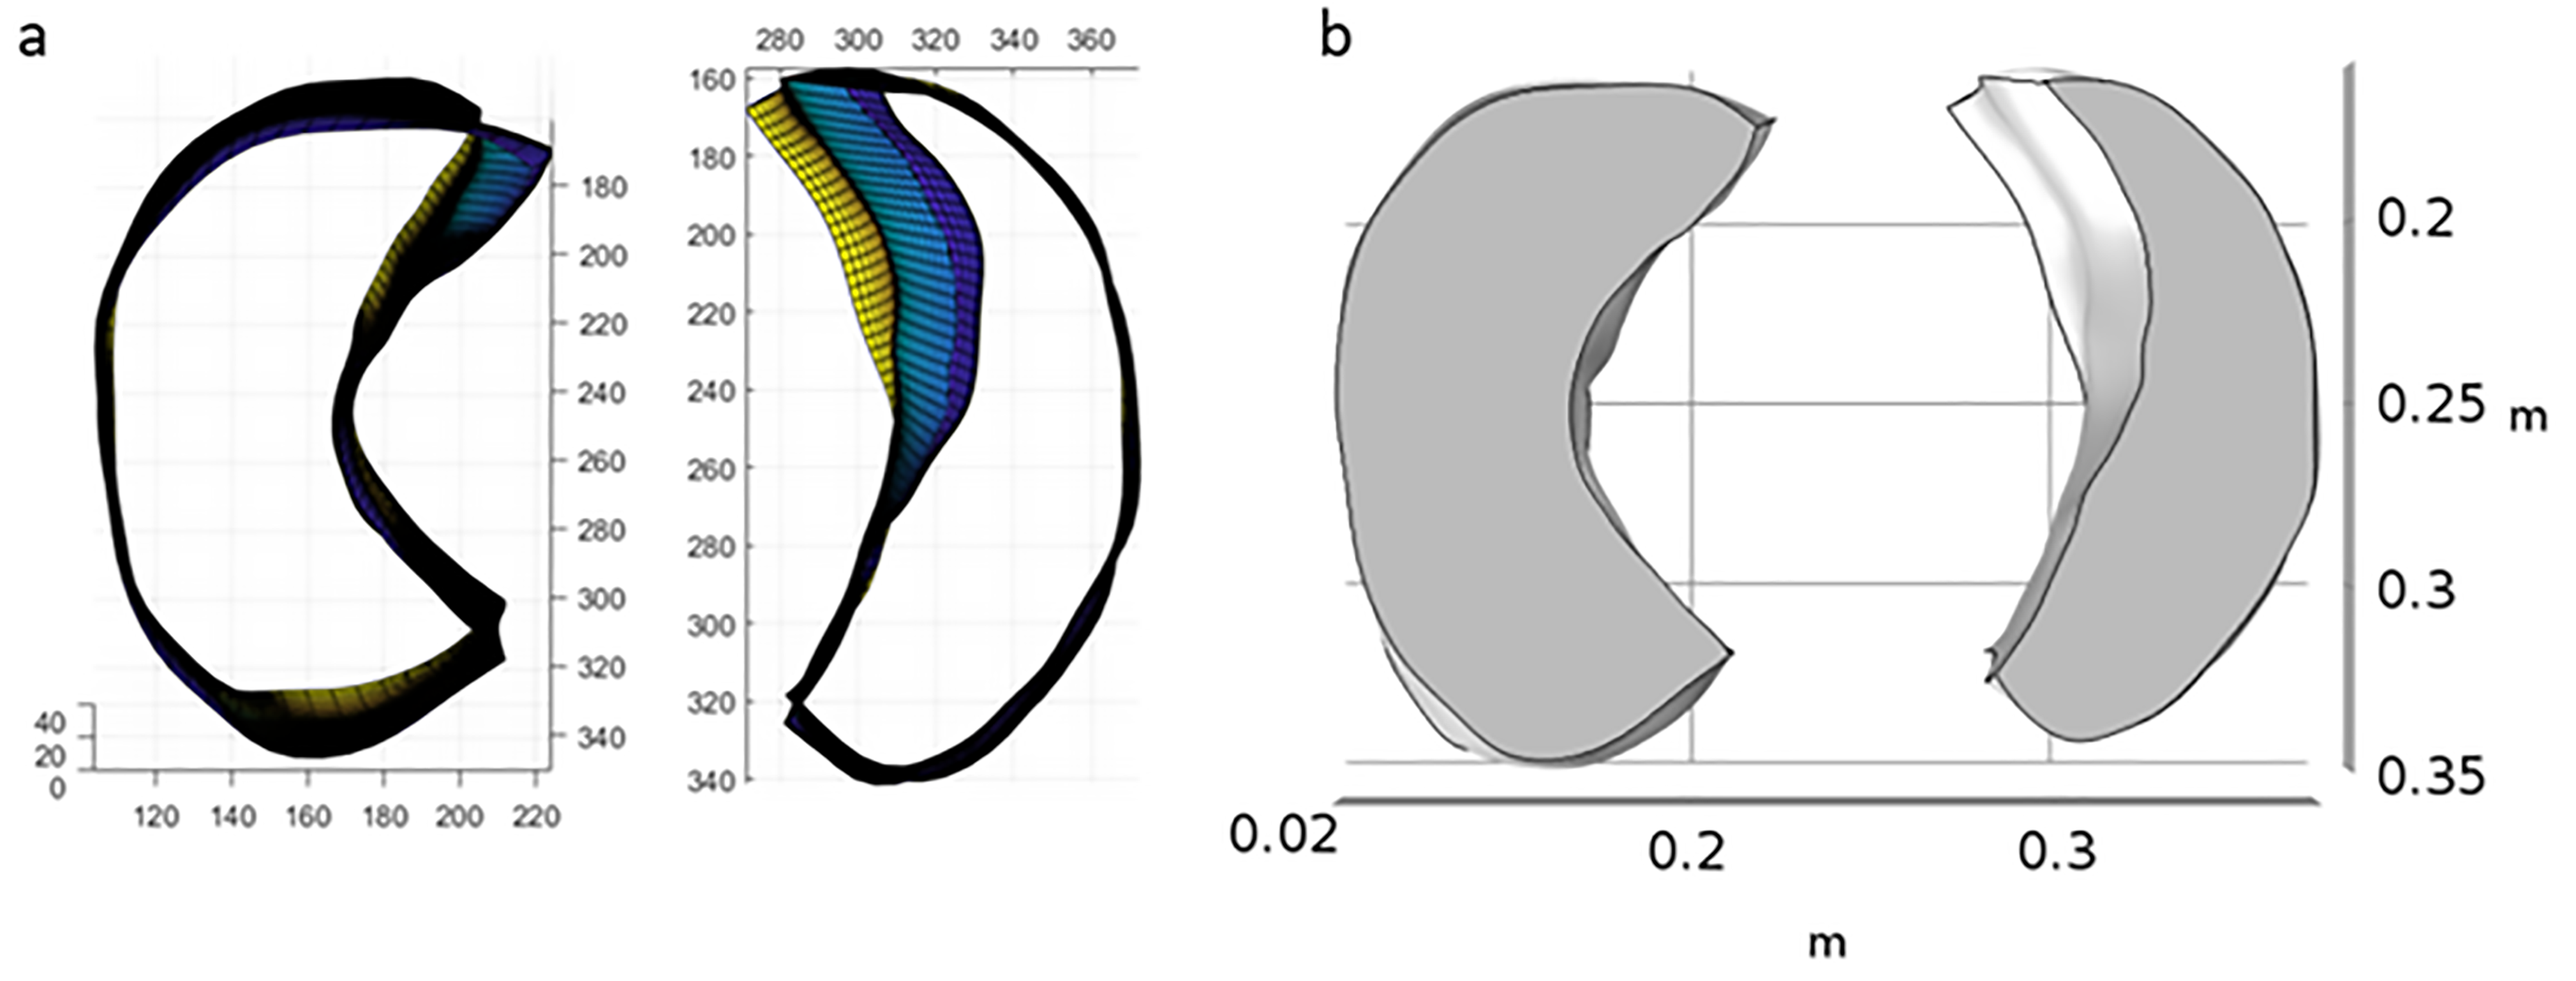
FEM was performed to determine the strain and strain gradients in lung parenchyma in IPN patients. Patient specific lung geometry were generated by using ImageJ and MATLAB Simulink (figure 3a). The geometry outlines, MRE shear stiffness and lung density maps were imported into COMSOL Multiphysics (figure 3b). The imported lung was modeled as a compressible Mooney Rivalin hyperelastic material and negative breathing pressure was simulated.
Results
MRE:Figure 2 shows example of magnitude image and stiffness maps of the right and left lungs in a patient diagnosed with IPN. The mean shear stiffness of the IPN (figure 2b - right lung - blue ROI) is 7.52±2.24kPa. The mean shear stiffness of the healthy lung parenchyma ROI (figure 2b - left lung - red ROI) is 0.41±0.19kPa. The median shear stiffness of IPN in all the patients is 1.77kPa which is significantly higher (p=0.008) than the healthy contralateral lung parenchyma, which has a median shear stiffness of 0.86kPa.
Computational Modeling:
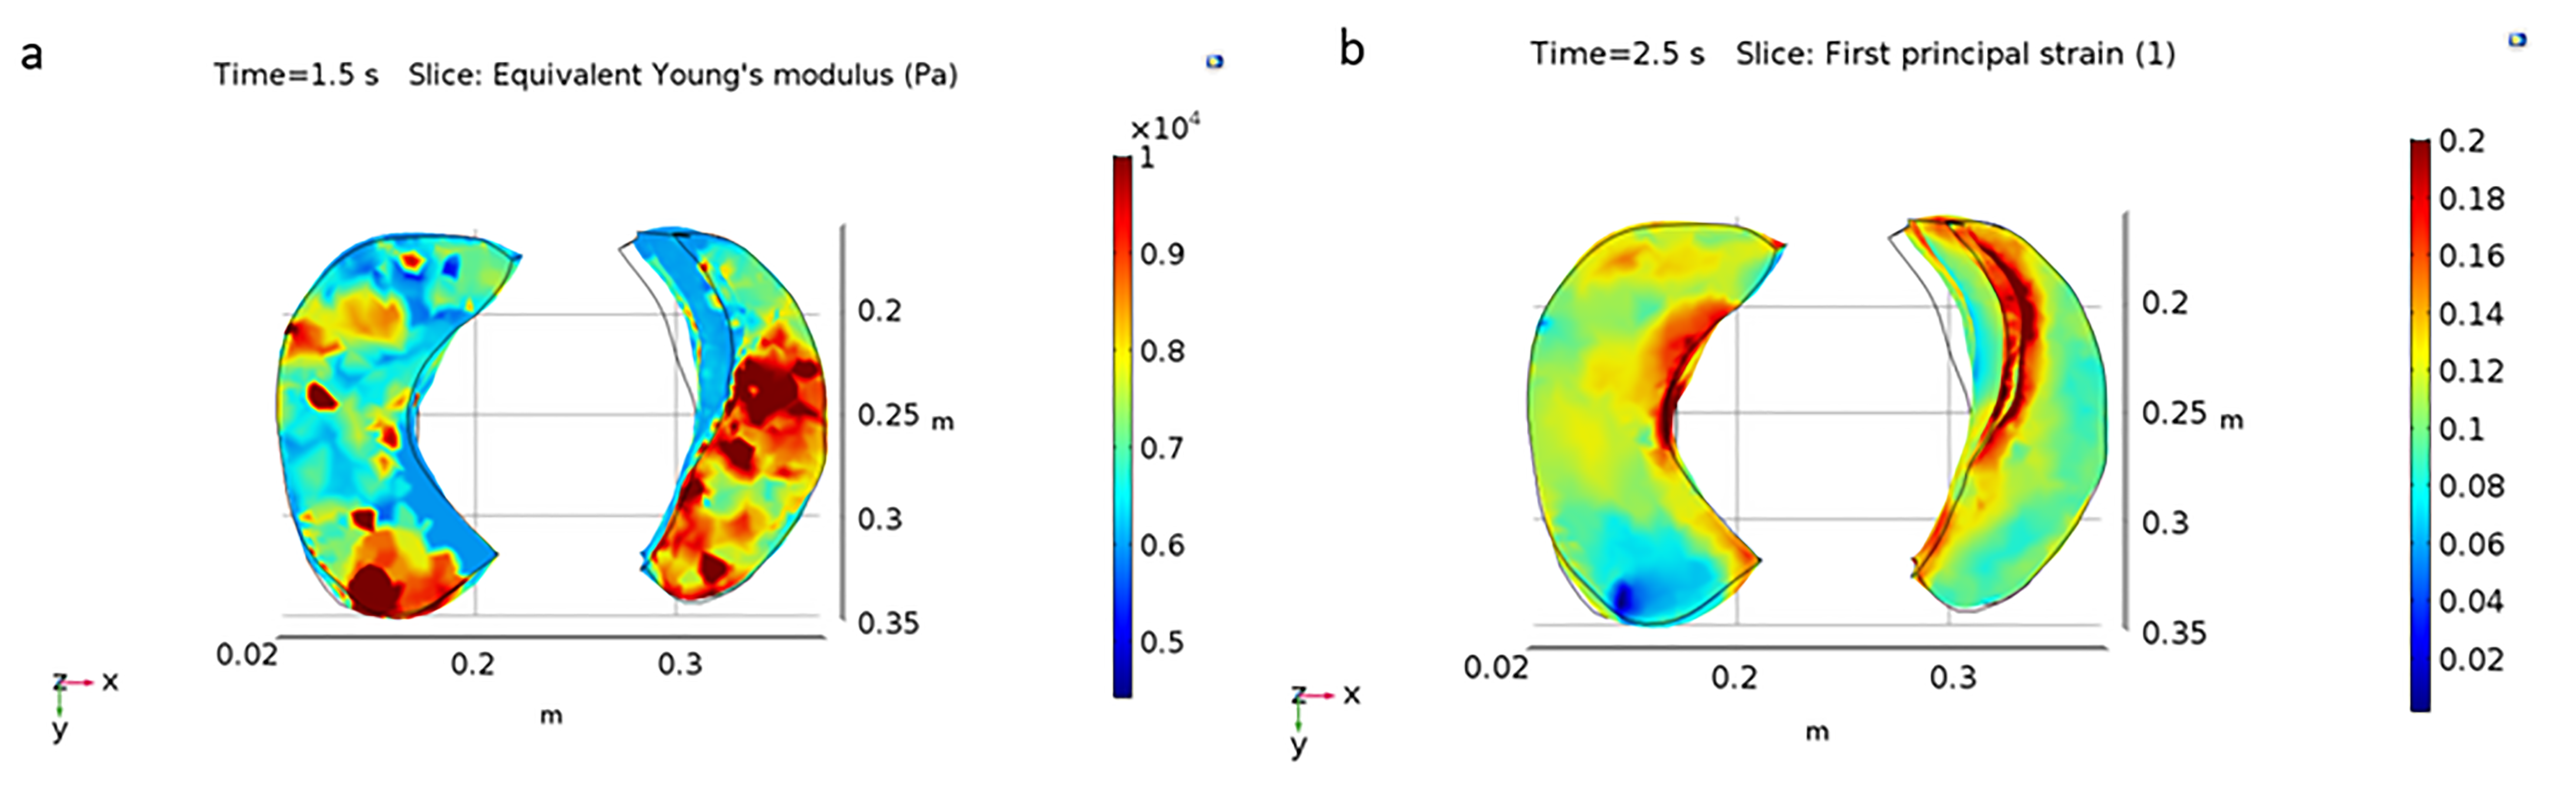
Figure 4 demonstrates sample young’s modulus and first principal strain obtained from FEM of one IPN patient. The area with the nodules have lower strain 4.77% compared to normal lung area with normal strain value 9.98% (figure 4b). Preliminary evaluation of strain gradient further showed that within the lung nodule strain gradient value was higher with a strain gradient of 29.704m-1 compared to the normal lung strain gradient value of 21.968m-1.
Discussion and Conclusion
This study has shown that IPNs have different mechanical properties compared to healthy lung tissue. The mean shear stiffness of IPNs is significantly higher than the normal lung parenchyma. Our preliminary finite element analysis further showed that strain and strain gradient can further characterize the IPN. Future work involves understanding the growth of IPN based on stiffness as well as strain gradients.Acknowledgements
We thank the Department of Biomedical Technology, King Saud University, Riyadh, Kingdom of Saudi Arabia, for providing scholarship to Faisal Fakhouri. Also, we thank NIH-R01HL124096 and NCAI-18-11 for funding.References
1. Mariappan YK, Glaser KJ, Hubmayr RD, Manduca A, Ehman RL, McGee KP. MR elastography of human lung parenchyma: technical development, theoretical modeling and in vivo validation. J Magn Reson Imaging. 2011;33(6):1351-1361.
2. Ost D, Fein AM, Feinsilver SH. The Solitary Pulmonary Nodule. Vol 348.; 2003. www.nejm.org. Accessed October 29, 2019.
3. Cleveland Clinic. Pulmonary Nodules. https://my.clevelandclinic.org/health/diseases/14799-pulmonary-nodules. Published 2016. Accessed October 31, 2019.
4. Fakhouri F, Kolipaka A, … HD-P, 2018 U. Magnetic Resonance Elastography Derived Stiffness As a Novel Biomarker in the Cystic Fibrosis Lung. St, Hoboken 07030-5774, Nj Usa.
5. Mariappan YK, Glaser KJ, Levin DL, et al. Estimation of the absolute shear stiffness of human lung parenchyma using 1H spin echo, echo planar MR elastography. J Magn Reson Imaging. 2014;40(5):1230-1237.
6. Holverda S, Theilmann RJ, Sá RC, et al. Measuring lung water: Ex vivo validation of multi‐image gradient echo MRI. J Magn Reson Imaging. 2011;34(1):220-224.
7. Theilmann RJ, Arai TJ, Samiee A, et al. Quantitative MRI measurement of lung density must account for the change in T 2* with lung inflation. J Magn Reson Imaging. 2009;30(3):527-534.
8. Manduca A, Oliphant TE, Dresner MA, et al. Magnetic resonance elastography: Non-invasive mapping of tissue elasticity. Med Image Anal. 2001;5(4):237-254. doi:10.1016/S1361-8415(00)00039-6
Figures