3323
Robustness of MR Elastography in the brain – Test-retest reliability and effect of different reconstruction methods1Department for Diagnostic Physics, Oslo University hospital, Oslo, Norway, 2The Intervention Center, Oslo University hospital, Oslo, Norway, 3Division of Imaging Sciences & Biomedical Engineering, King's College, London, United Kingdom, 4Department of Informatics, University of Oslo, Oslo, Norway, 5INSERM U1148, LVTS, University Paris Diderot, Paris, France
Synopsis
We assessed the test-retest reliability of MR Elastography, and compared the estimates of the shear storage modulus G’ (tissue elasticity) from two different reconstruction methods; a localized divergence-free finite-element approach and a local curl approach. The median coefficient of variation for two scans of the brain was 2.8 %, whereas the intraclass correlation coefficient between scan 1 and scan 2 was 0.80. G’ values estimated using the local curl method were 19% lower than with the divergence-free method. MRE of the human brain appears robust, while absolute values are dependent on the reconstruction method and should be used with care.
Introduction
Many diseases are known to alter the biomechanical properties in tissue. Magnetic resonance elastography (MRE) may be used to quantify these properties noninvasively by its shear module. However, for one to rely on potential biomarkers from MR elastography, the technique needs to be robust. That is, its test-retest reliability should be high. Moreover, the output from MR elastography is determined by the reconstruction method applied. In our study, we compare the estimates from two reconstruction methods; (I) a localized divergence free finite element reconstruction approach1 and (II) a local curl reconstruction approach2.Methods
The study was performed in 15 healthy volunteers, and approved by the Regional Ethics Committee. The exams were performed on a 3T Philips Ingenia MRI scanner. A T1-weighted series acquisition was used as an anatomical reference scan, and diffusion tensor imaging was also performed. Two MRE scans were acquired using the Gravitational Transducer3, at 50 Hz. Image acquisition was performed using a multi-slice gradient-echo acquisition4, with a Hadamard encoding scheme5. Other scan parameters were: 15 slices, 3.1 mm isotropic resolution, TE=12 ms, TR =384 ms, and a 72 × 70 matrix size. Seven acquisitions over the wave cycle were performed, and each MRE acquisition lasted 5.5 minutes.The two MRE acquisitions were performed during the same scanning session, with approximately 15 minutes of other MR sequences between the two MRE scans. Two reconstruction methods were used: A localized divergence free finite element reconstruction1 and a local curl reconstruction2. Further image analysis was done in Matlab (version R2018a, MathWorks, Natick, MA, USA). Regions-of-interest in the volunteers were defined from an atlas of brain regions6 and SPM12 (version 7487, Wellcome Trust Centre for Neuroimaging, London) was used to warp these ROIs to the native space of the MRE images.
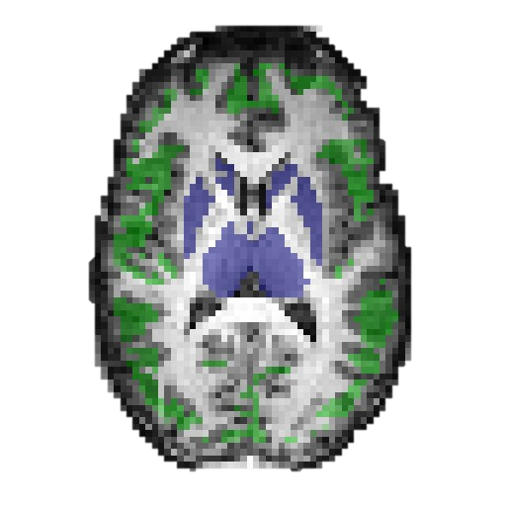
To avoid artefacts from MRE reconstruction at the edge of the brain, the outermost voxels were removed from the cortical gray matter regions. This was done using an eroded mask from each MRE magnitude image. Apparent diffusion coefficient (ADC) maps from the diffusion acquisition was used to reduce partial volume effects. ADC maps were coregistered and resliced to MRE space, and a mask with a cutoff of ADC< 1.2 ×10⁻³ mm2/s, was used to exclude voxels with a high content of cerebrospinal fluid7. The analysis was performed in the full brain, as well as in white and gray matter ROIs. The ROIs are illustrated in figure 1.
Intraclass Correlation Coefficients (ICC) with 95% confidence intervals were calculated using SPSS 23 (SPSS Inc, Chicago, IL) based on an absolute-agreement, 2-way mixed-effects model. Moreover, coefficient of variations (CoV) were calculated in Matlab by acquiring the ratio between the standard deviation and the mean of the two measurements.
Results
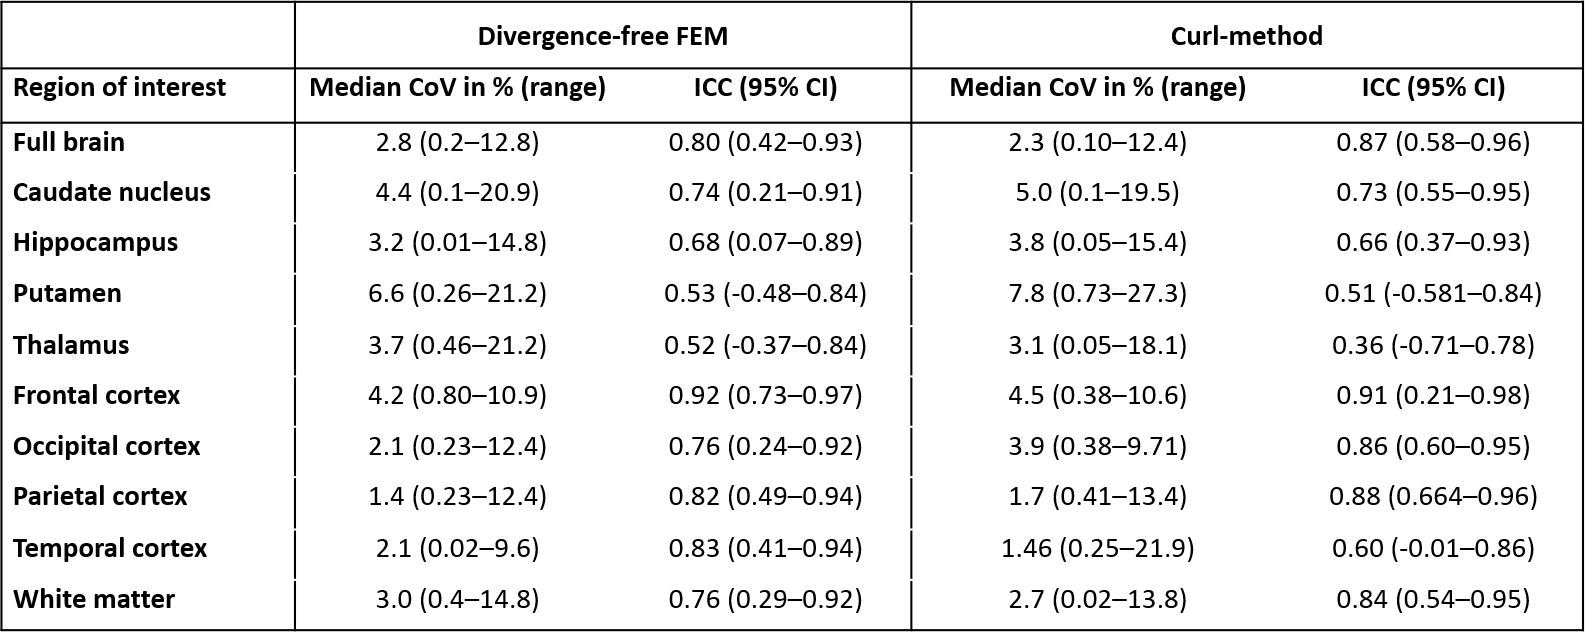
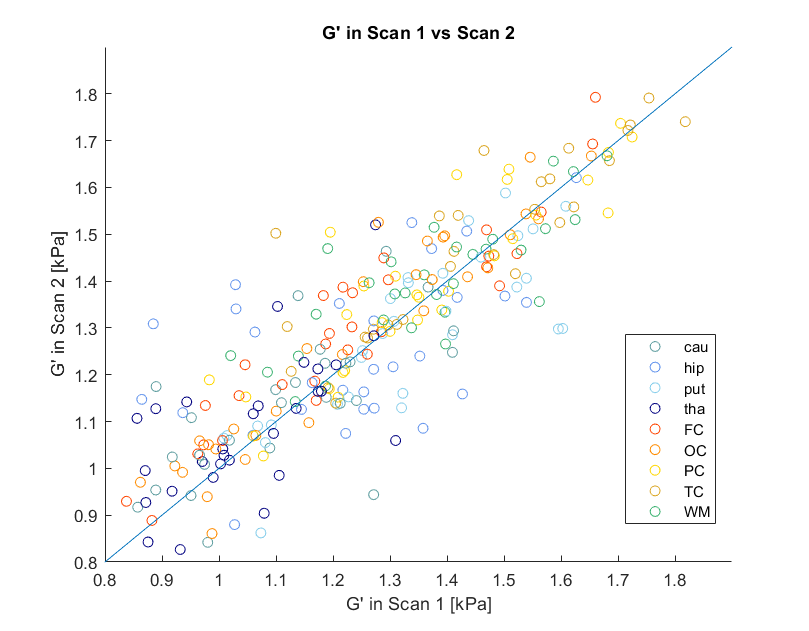
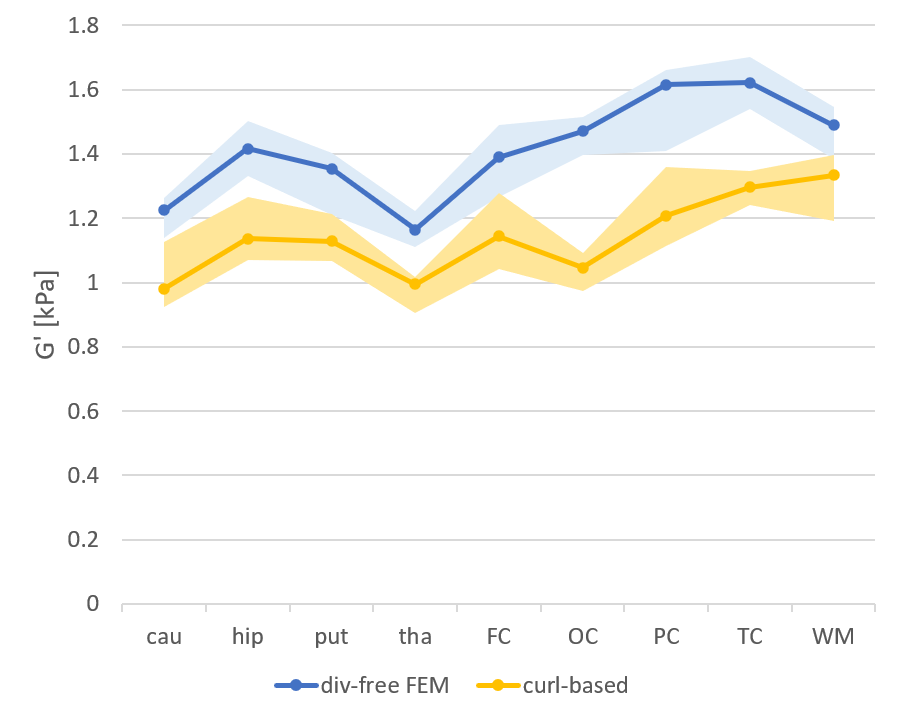
The median CoV for the measured shear storage modulus G’ (tissue elasticity) for the entire brain, using the divergence-free reconstruction method, was 2.8 % (range 0.2-13 %). For the white- and gray-matter ROIs, the median CoV was 3.1 % (range 0.0-21.2 %). The ICC between scan one and two for G’ in the entire brain was 0.80, with an ICC median of 0.77 for the ROIs. Table 1 shows the CoV and the ICC for all ROIs, and for both reconstruction methods, which showed similar test-retest reliability. Figure 2 shows the G’ from the two scans.Figure 3 shows the average G’ values for each ROI, and using both reconstruction methods. The local curl reconstruction showed on average 19% lower (p=0.0008, Wilcoxon signed-rank test) G’ values compared to that of the finite element reconstruction.
Discussion
An earlier study8 using a different MR elastography hardware and reconstruction method studied the reliability of their technique in three scans of brains of ten healthy volunteers. They report a median CoV for global brain stiffness of 0.67% (maximum 1.11%), and of 1.98% (max 4.47%) in the lobes of the brain, deep GM/WM and cerebellum regions.Murphy et al8 evaluated the test-retest reliability values for the shear stiffness instead of the shear storage modulus, as in our study, due to the shear stiffness being more resistant to noise. Because the shear modulus offers information of both elasticity (G’) and viscosity (G’’), which are clinically relevant for several pathologies, assessing the test-retest reliability of this variable is important.
The ICC values are higher for the cortical gray matter regions than for the deep gray and white matter regions. The ROIs analysed here differ in size, with the cortical gray matter ROIs containing more voxels than the deep gray matter ROIs. The smaller ROIs will be more sensitive to a correct warping of the brain atlas regions to each subject’s image space, which could help explain the differences between regions. Putamen and thalamus are two regions with lower ICC than the rest of the brain, suggesting the measurements in these regions may be less robust.
We observed lower G’ values using the local curl method, compared to the divergence-free FEM method, as reported before1. This warrants caution when using absolute values from MRE data.
Conclusion
MRE of the human brain appears robust, while absolute values are dependent on the reconstruction method and should still be used with care.Acknowledgements
No acknowledgement found.References
1) Fovargue D, Kozerke S, Sinkus R, et al. Robust MR elastography stiffness quantification using a localized divergence free finite element reconstruction. Medical Image Analysis. 2018;44:126–14
2) Sinkus R, Tanter M, Xydeas T, et al. Viscoelastic shear properties of in vivo breast lesions measured by MR elastography. Magnetic Resonance Imaging. 2005;23: 159–165 2) Runge J, Hoelzl SH, Sudakova J, et al. A novel magnetic resonance elastography transducer concept based on a rotational eccentric mass: preliminary experiences with the gravitational transducer. Phys. Med. Biol. 2019; 64(4)
3) Guenthner C, Sethi S, Troelstra M, et al. Ristretto MRE: A generalized multi-shot GRE-MRE sequence. NMR in Biomedicine. 2019; e4049.
4) Guenthner C, Runge J, Sinkus R et al. Analysis and improvement of motion encoding in magnetic resonance elastography. NMR in Biomedicine. 2018;31(5):e3908
5) Tzourio-Mayer N, Landeau B, Papathanassiou, et al. Automated anatomical labeling of activations in SPM using a macroscopic anatomical parcellation of the MNI MRI single-subject brain. Neuroimage. 2002;15(1):273-89.
6) Bykowski JL, Latoru LL, Warach S. More Accurate Identification of Reversible Ischemic Injury in Human Stroke by Cerebrospinal Fluid Suppressed Diffusion-Weighted Imaging. Stroke. 2004;35:1100-1106.
7) Murphy MC, Huston J, Jack Jr C, et al. Measuring the Characteristic Topography of Brain Stiffness with Magnetic Resonance Elastography. PLoS One. 2013; 8(12): e81668.
Figures