3322
Mechanical Property Recovery in the Cerebral Cortex using Magnetic Resonance Elastography1University of Delaware, Newark, DE, United States, 2Dartmouth College, Hanover, NH, United States
Synopsis
Magnetic resonance elastography of the brain has shown promise as a sensitive neuroimaging biomarker for neurodegenerative disorders; however, the feasibility and reliability of performing MRE of the cerebral cortex warrants investigation due to the unique challenges of studying thinner and more complex geometries. In this work, we found good agreement between realistic simulated MRE data versus recovered displacement data of an older adult participant at various levels of applied Gaussian noise. Future work should consider additional and more advanced imaging and inversion approaches to improve the reliability and sensitivity of cortical MRE measures.
Introduction
Recent efforts in neuroimaging have focused on the development of new contrast mechanisms for visualizing the brain to reveal subtle pathologies. Magnetic resonance elastography (MRE)1 is an emerging phase-contrast MRI-based technique that can quantify brain tissue viscoelasticity, which is expected to relate to the underlying complexity and organization of the neural tissue microstructure2. While the reliability of lobar regions3 and subcortical grey matter structures4 have been studied, there remains a need to assess the feasibility for MRE to study the cerebral cortex and its thin, complex geometries. Even more challenging, perhaps, is the ability to recover MRE property measurements in older adults who are expected to undergo cortical atrophy and cortical thinning in vulnerable regions5,6. The aim of this study is to therefore assess the feasibility of performing MRE of the cerebral cortex using realistic simulations with prescribed cortical properties; we will then calculate whether the properties recovered from inversion match the true measurements.Methods
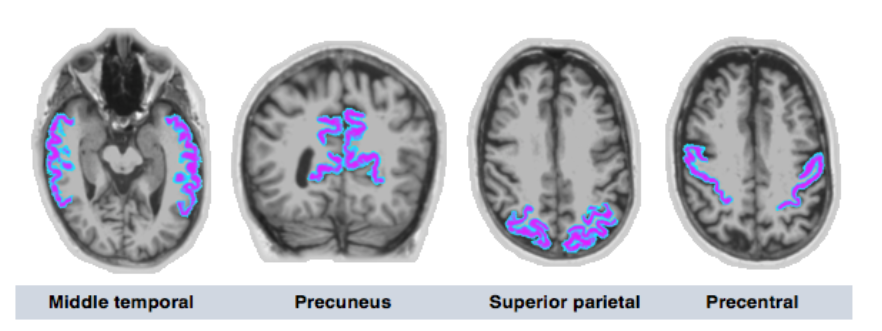
Imaging data for simulationsTo obtain realistic wavefields and mechanical properties of the cortex, the simulation was generated from MRE data from one older adult (75 years/male) which was collected on a Siemens 3T MRI scanner. MRE data were acquired at 50 Hz using a multislab, multishot spiral imaging sequence7 at 1.6 mm isotropic resolution, and inverted with the nonlinear inversion (NLI) algorithm8 to produce maps of shear stiffness, μ, and damping ratio ξ. Masks of four regions of interest (ROIs) including the middle temporal gyrus (MTG), precuneus (PRE), superior parietal cortex (SPC), and precentral gyrus (PCG) were obtained via automatic segmentation of a T1-weighted image using Freesurfer v6 using the Desikan-Killiany cortical atlas9, as shown in Figure 1. FLIRT in FSL was used to coregister the cortical masks to MRE native space and were thresholded at 50% to create binary masks.
Simulations
An incompressible viscoelastic finite-element model was built from the brain mask, with μ and ξ values assigned in each of the four segmented regions. Properties were randomly chosen from a uniform distribution within a range of mean ± two standard deviations from MRE examinations of 23 older adults10. Ten simulations were generated in total using MRE measured displacements applied as boundary conditions to produce realistic wavefields. Simulated data was then inverted using NLI with soft prior regularization (SPR)11 using the same inversion parameters applied to in vivo studies. Gaussian zero mean noise was added to the displacement data at either 0%, 3%, or 5% of the mean displacement amplitude.
Statistical analyses
Pearson correlations were used to test the relationship between the true simulated vs recovered data at various noise levels. Intraclass correlation coefficient (ICC) was also used to assess measurement reliability. We did not predict that we would obtain complete contrast recovery because of moderate inter-region smoothing necessary for inversion stability; therefore, we used an ICC two-way mixed model (single measures) of type consistency. Here, we were only interested in the relative ranking of values rather than their exact value. ICC values <0.5=poor, 0.5-0.75=moderate, 0.75-0.90=good, >0.90=excellent reliability12.
Results
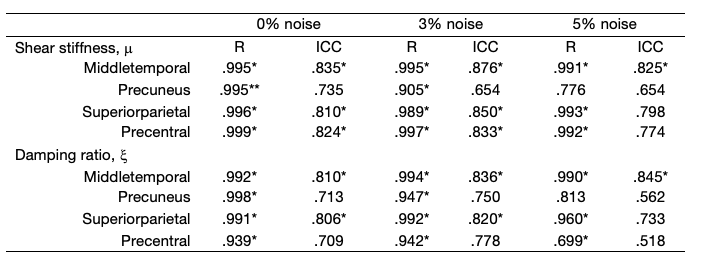
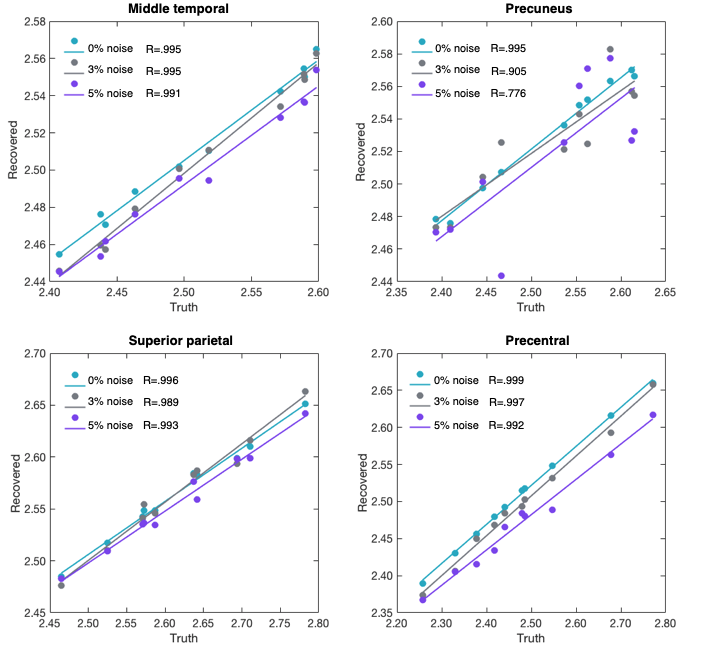
Table 1 presents the results from the Pearson correlations and ICC analyses.For μ, all Pearson correlations were significant ranging from R=0.999 (PCG; 0% noise) to R=0.776 (PRE; 5% noise). Figure 2 illustrates the correlation between the simulated and recovered values according to each cortical ROI. ICC found good agreement at 0% noise for the MTG, SPC, and PCG, whereas moderate reliability was observed for PRE. At 5% noise, MTG retained good reliability; PRE, SPC, and PCG all possessed a moderate relationship to the ground truth although these were not significantly related.
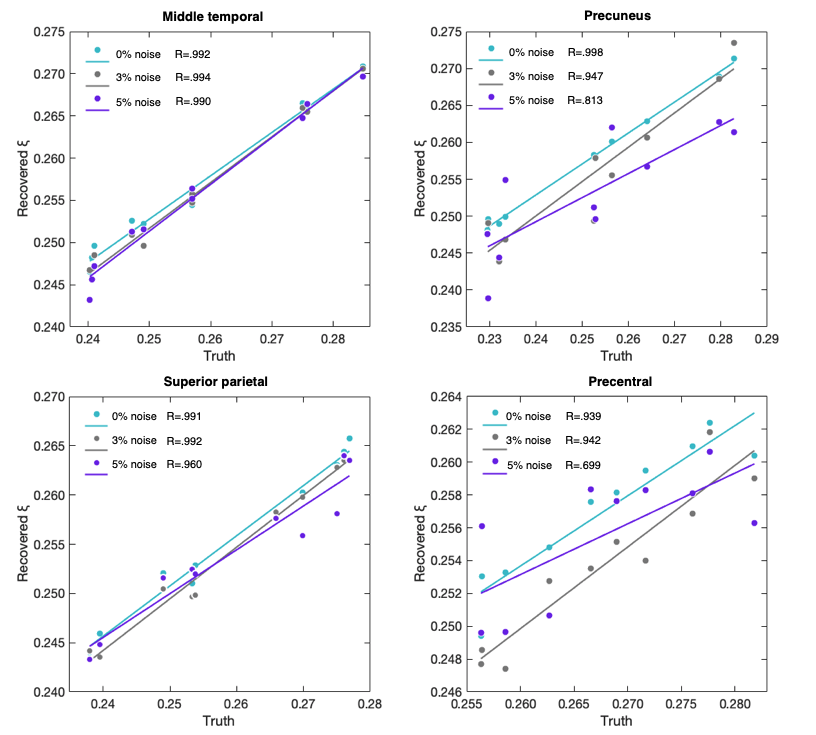
For ξ, all Pearson correlations were significant ranging from R=0.998 (PRE; 0% noise) to R=0.699 (PCG; 5% noise). Figure 3 shows the correlation between the simulated and recovered values according to each cortical ROI. ICC analyses found MTG to possess good agreement to the ground truth at all levels of applied noise. SPC appears to be more sensitive to higher noise levels where a significant relationship to the ground truth was no longer observed. Good levels of agreement for PRE and PCG were found at both 0% and 3% noise.
Discussion and conclusions
These results confirm the feasibility for performing MRE of thin and irregular structures such as those observed across the cerebral cortex. As expected, we did not achieve complete contrast recovery in the cortical regions due to inter-region smoothing – regions simulated as softer than the cerebrum were overestimated, while those simulated as stiffer were underestimated. This may manifest as a reduction in sensitivity of the cortical MRE measures to true effects, such as group differences or age relationships. However, the high ICC and general robustness to noise for both MRE measures suggest measurement reliability and support that MRE of the finely detailed cerebral cortex is feasible. In particular, these results suggest that the cortical regions reported to be softer in Alzheimer’s disease, which included the MTG, PRE and PCG, are able to be calculated using MRE9. Future work will involve analyzing the benefits of acquiring higher-resolution MRE displacement data13 and the optimization of NLI parameters14 for accurately resolving the mechanical properties of the cortex known to be vulnerable to aging and neurodegeneration.Acknowledgements
This work was supported in part by grants NIH/NIA R01-AG058853 and NIH/NIBIB R01-EB027577.References
1Muthupillai R, Lomas D J, Rossman P J, Greenleaf J F, Manduca A and Ehman R L 1995. Magnetic resonance elastography by direct visualization of propagating acoustic strain waves. Science, 269 1854–7.
2Sack I, Johrens K, Wuerfel J and Braun, J 2013. Structure-sensitive elastography: On the viscoelastic power law behavior of in vivo human tissue in health and disease. Soft Matter. 9, 5672–5680.
3Murphy MC, Huston III J, Jack Jr CR, Glaser KJ, Senjem ML, Chen J, Manduca A, Felmlee JP, Ehman RL 2013. Measuring the Characteristic Topography of Brain Stiffness with Magnetic Resonance Elasography. PLOS One. 8 (12): e81668.
4Johnson CL, Schwarb H, McGarry MDJ, Anderson AT, Huesmann GR, Sutton BP, Cohen NJ 2016. Viscoelasticity of subcortical gray matter structures. Hum Brain Mapp, 37:4221-4233.
5Salat DH, Buckner RL, Snyder AZ, Greve DN, Desikan RSR, Busa E, Morris JC, Dale AM, Fischl B, 2004. Thinning of the Cerebral Cortex in Aging. Cerebral Cortex, 14 (7): 721–730.
6McGinnis SM, Brickhouse M, Pascual B, Dickerson BC 2013. Age-Related Changes in the Thickness of Cortical Zones in Humans. Brain Topog. 24 (3-4): 279-291.
7Johnson CL, Holtrop JL, McGarry MDJ, et al. 2014. 3D multislab, multishot acquisition for fast, whole-brain MR elastography with high signal-to-noise efficiency. Magn Reson Med. 71: 477–485.
8McGarry MDJ, Van Houten EEW, Johnson CL, Georgiadis JG., Sutton BP, Weaver JB & Paulsen KD 2012. Multiresolution MR elastography using nonlinear inversion. Medical physics. 39 (10): 6388-6396.
9Desikan RS, Ségonne F, Fischl B, Quinn BT, Dickerson BC, Blacker D, Buckner RL, Dale AM, Maguire RP, Hyman BT, Albert M & Killiany RJ. 2006. An automated labeling system for subdividing the human cerebral cortex on MRI scans into gyral based regions of interest. NeuroImage. 31 (3):968-980.
10Hiscox LV, Johnson CL, McGarry MDJ, Marshall H, van Beek EJR, Roberts N, Starr JM. “Mechanical property alterations across the cerebral cortex due to Alzheimer's disease”. Society for Neuroscience, Chicago IL, Oct 2019.
11McGarry MDJ, Johnson CL, Sutton BP 2013. Including spatial information in nonlinear inversion MR elastography using soft prior regularization. IEEE Trans Med Imaging. 32: 1901–1909.
12Koo TK, Li MY 2016. A guideline of selecting and reporting intraclass correlation coefficients for reliability research. J Chiropr Med. 15:155–163.
13Johnson CL, Holtrop JL, Anderson AT, Sutton BP. “Brain MR Elastography with Multiband Excitation and Nonlinear Motion-Induced Phase Error Correction,” 24th Annual Meeting of the International Society for Magnetic Resonance in Medicine, Singapore, May 2016.
14McGarry MDJ, Weaver JB, Paulsen KD, and Johnson CL. “Reconstruction of high-resolution MR elastography motion data using nonlinear inversion”. 1st International MRE workshop, Berlin, Sept 2017.
Figures