3318
Parametric maps of murine cancers from dynamic contrast enhanced MRI: low versus high doses of contrast agent1Radiology, The University of Chicago, Chicago, IL, United States, 2School of Technology, Harbin University, Harbin, China, 3Medicine, The University of Chicago, Chicago, IL, United States
Synopsis
We compared dynamic contrast enhanced (DCE) MRI with low (0.04mmol/kg) and high doses (0.2mmol/kg) of contrast agent on C3H mice at 9.4T with 1.5s temporal resolution before and after a bolus injection. The standard Tofts model was used to extract physiological parameters (Ktrans and ve) with arterial input function derived from muscle reference tissue. On average, rate constants were larger for low dose than high dose data. There were strong correlations for Ktrans and ve between low and high dose data. Therefore, low dose may be as effective as a high dose of contrast agent for cancer diagnosis.
INTRODUCTION
There are increasing concerns regarding intracellular accumulation of gadolinium (Gd) after multiple dynamic contrast enhanced (DCE) MRI [1]. Normally, a dose of 0.1mmol/kg Gd-based contrast agents (GBCAs) is given to patients, who cumulatively receive large volumes of GBCA during cancer treatment.A low dose (LD) (≤0.05mmol/kg) of GBCA would minimize toxicity. Several studies investigated the feasibility of using LD DCE-MRI in humans for cancer diagnosis [2-5]. Although reduced enhancement in LD DCE-MRI may affect radiologic assessment of images, quantitative analysis may be more effective with LD combined with ultrafast sampling.
This study investigated whether quantitative analysis of LD DCE-MRI is as effective as high dose (HD) DCE-MRI by comparing parametric maps calculated from female C3H mice (n=6) implanted with mammary tumors on the hind limb. Both the standard Tofts pharmacokinetic model and an empirical mathematical model (EMM) of DCE-MRI were used to quantitatively analyze LD and HD DCE-MRI data.
METHODS
Institutional Animal Care and Use Committee approved MRI experiments were performed on a 9.4Tesla Bruker scanner. T2-weighted images for tumor localization were acquired with a RARE pulse sequence. For three central slices, RARE-VTR images were acquired for calculation of native T1. Subsequently, 3D T1-weighted DCE-MRI data (TR/TE=4.7/1.6ms, FOV=25.6×19.2×10mm3, matrix size=128×32×10, flip angle=30°) were acquired with 1.5s temporal resolution, before, during, and after a bolus injection of LD 0.04mmol/kg of Omniscan. After 30minutes, the RARE-VTR pulse sequence was repeated before the HD. Finally, the 3D DCE-MRI was repeated with a bolus injection of HD 0.2mmol/kg of Omniscan.Tissue Gd concentration (C(t)) as a function of time (t) was calculated based on the gradient echo non-linear signal model [6]. For each mouse, the arterial input function (AIF) (Cp(t)) was derived from muscle reference tissue using the derivative form of the Tofts model. Parametric maps were generated from the standard Tofts model (Ktrans and ve) and an empirical mathematical model (EMM) as follows (A, α, β, γ):
$$$C(t)=K^{trans}\int_{0}^{t} C_p(\tau)\exp(-(t-\tau)K^{trans}/v_e)d\tau$$$ and $$$C(t)=A\frac{(\alpha t)^2}{1+(\alpha t)^2}e^{-\beta t}\frac{1+e^{-\gamma t}}{2}$$$,
where A(mM) is the upper limit of initial contrast agent uptake, α(min-1) is the rate of contrast agent uptake, β(min-1) and γ(min-1) is the overall rate and initial rate of contrast agent washout, respectively. To minimize the effects of noise, muscle C(t) was fitted with the EMM prior to derive AIF.
The Kruskal-Wallis ANOVA test was performed to determine whether there was significant difference in muscle and tumor T1 values obtained before LD and HD DCE-MRI. Pearson correlation tests were performed to examine whether there was a linear relationship between LD and HD parametric maps. A p-value <0.05 was considered significant.
RESULTS
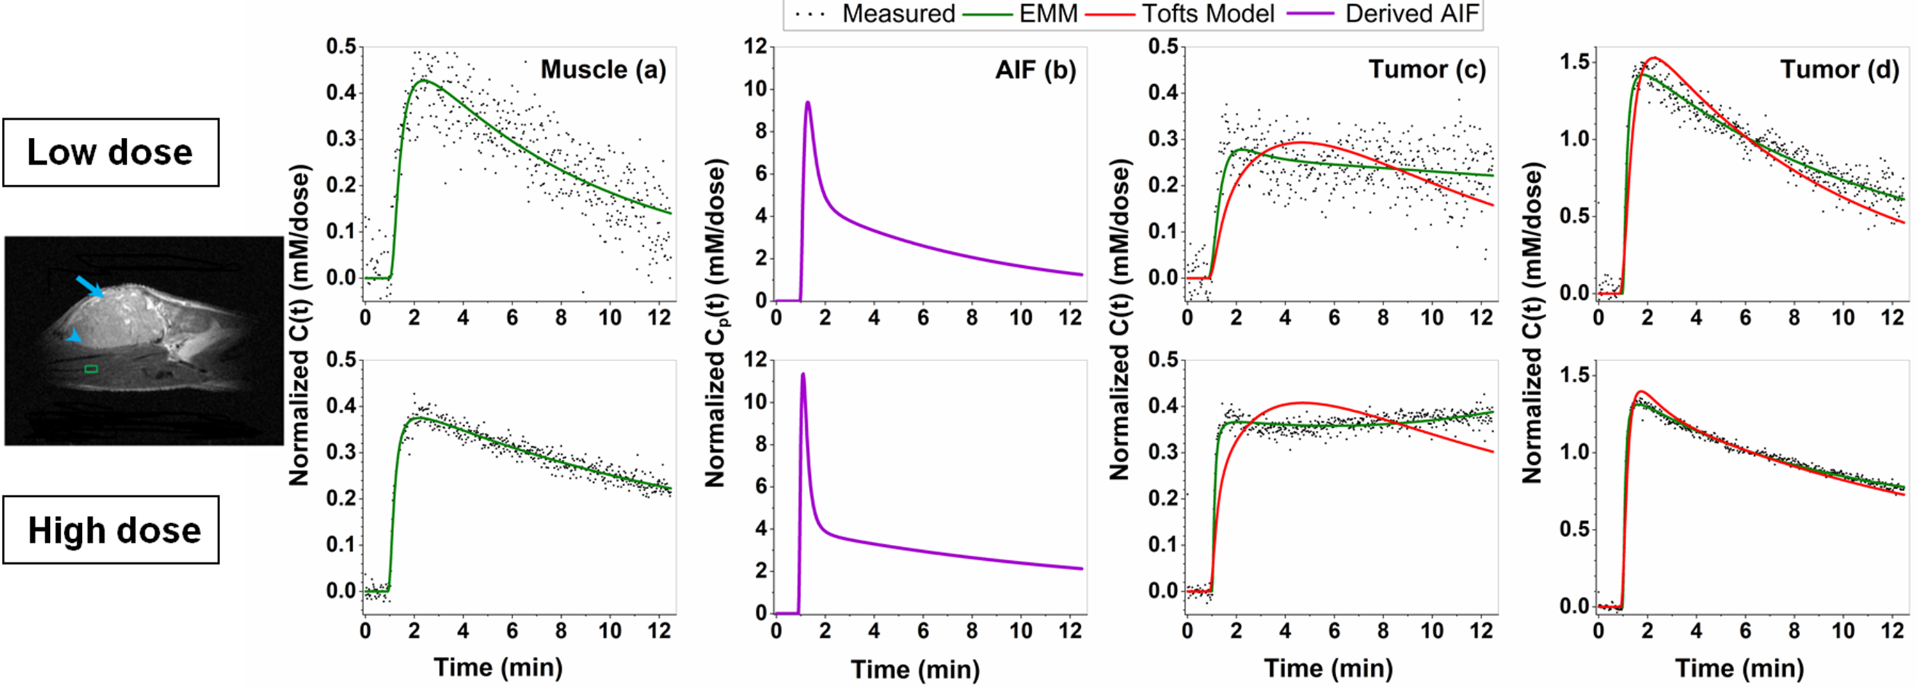
Average native T1 value for muscle and tumor was 2.23±0.22s and 2.37±0.12s before LD injection; and 2.12±0.25s and 2.18±0.16s at approximately 30minutes after LD injection, respectively. There was no significant difference (p=0.22) between these T1 values.Figure 1 shows a mouse leg T2W image and plots of C(t) normalized by contrast agent dose and corresponding fits with the standard Tofts model and EMM for LD and HD. The derived LD and HD AIF’s are similar, despite noisy LD enhancement in muscle. The accuracy of the EMM fitting tissue is much better than the Tofts model.
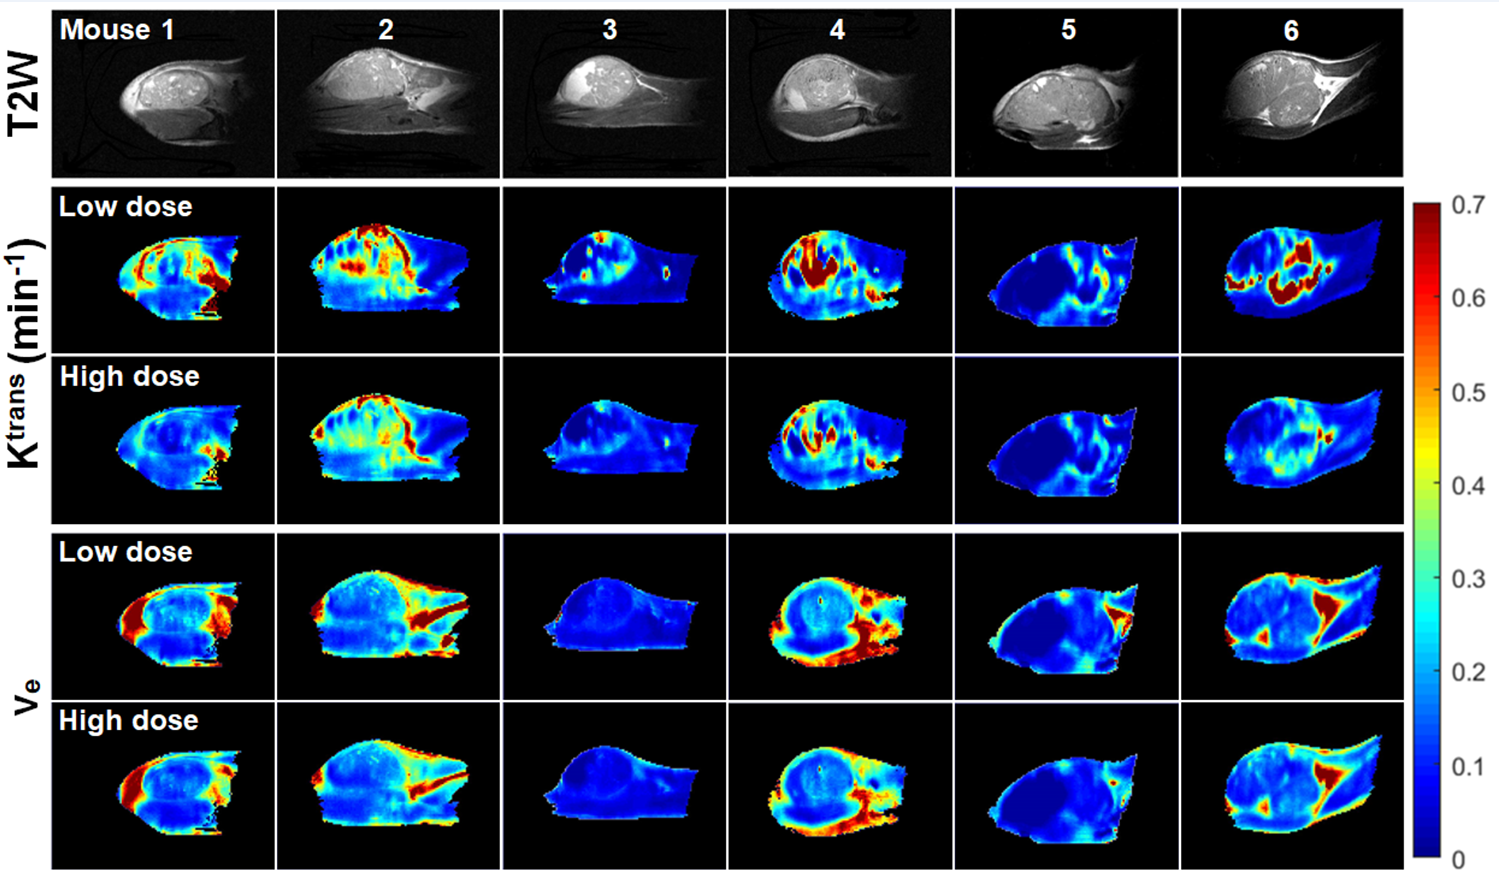
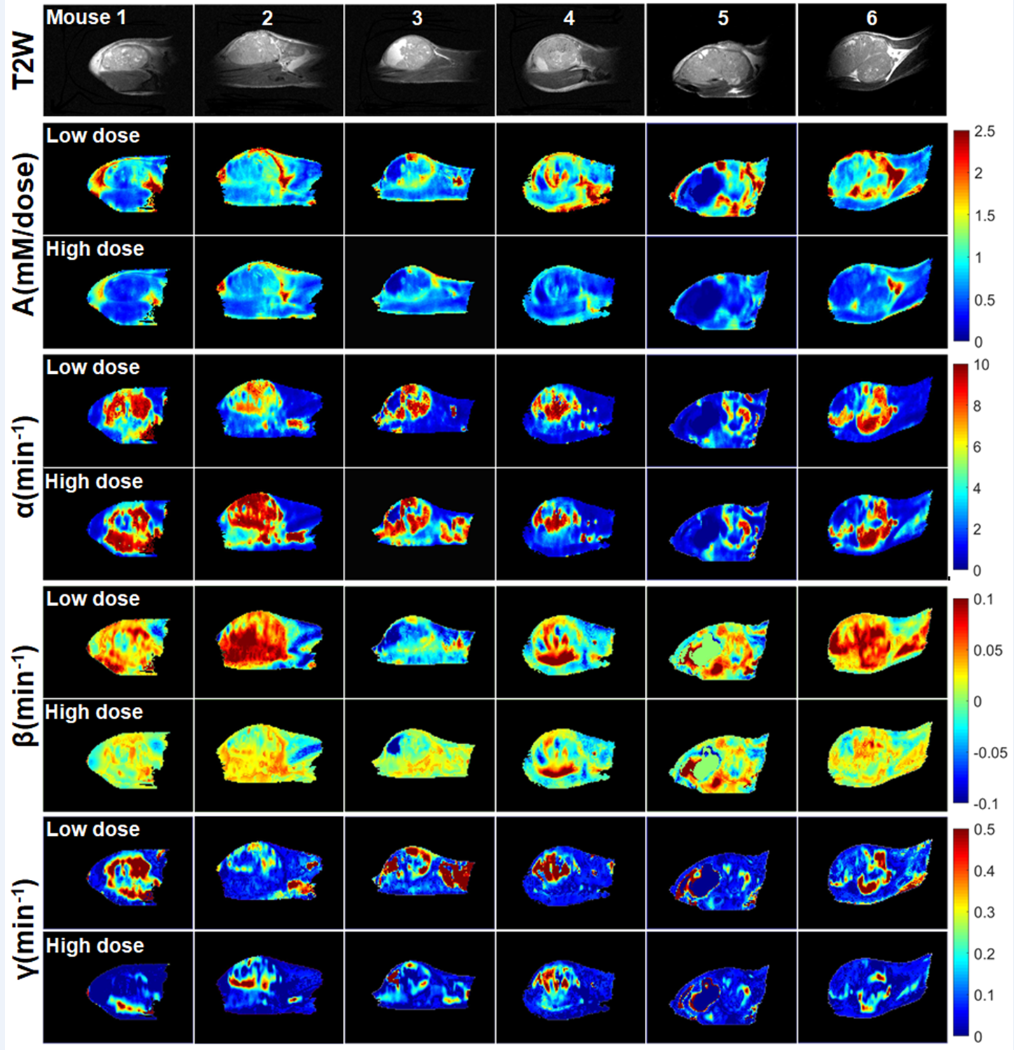
Figure 2 compares LD and HD physiological parametric maps Ktrans and ve. Ktrans(LD) maps in tumors have higher values than Ktrans(HD) maps, and ve(LD) and ve(HD) maps are very similar. The average Ktrans(min-1) was 0.23±0.11 and 0.15±0.09; and ve was 0.16±0.07 and 0.14±0.06 for LD and HD data, respectively. Figure 3 compares LD and HD parametric maps A, α, β, and γ. The A(LD) and A(HD) maps appear similar, but have higher normalized values for LD data. The LD and HD maps of α, β and γ are similar over tumor and muscle.
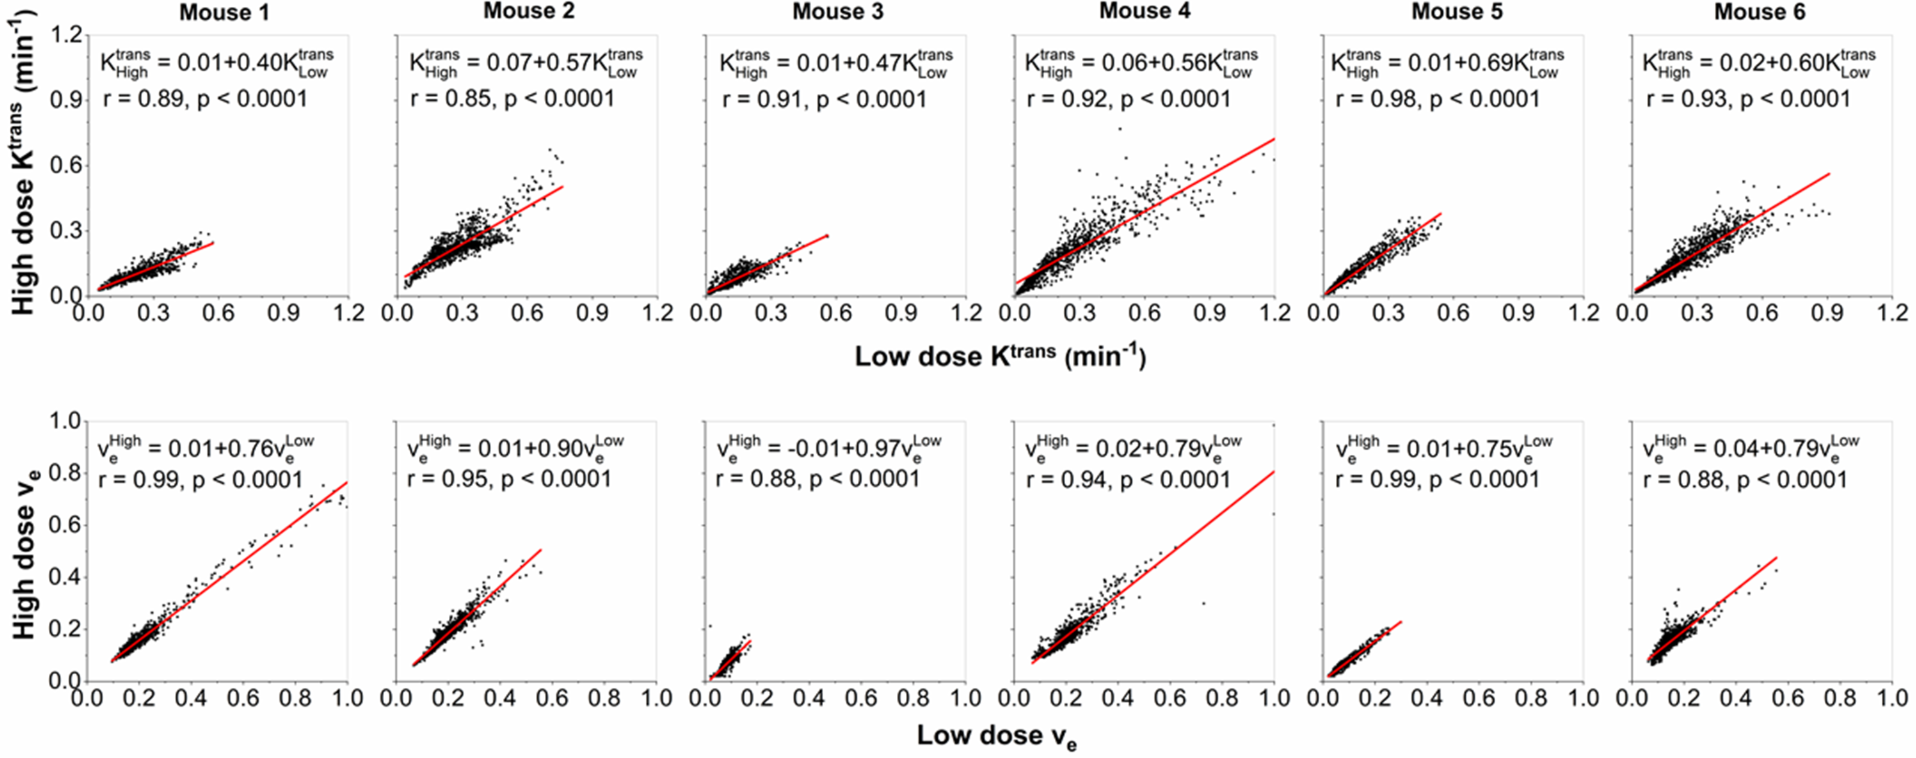
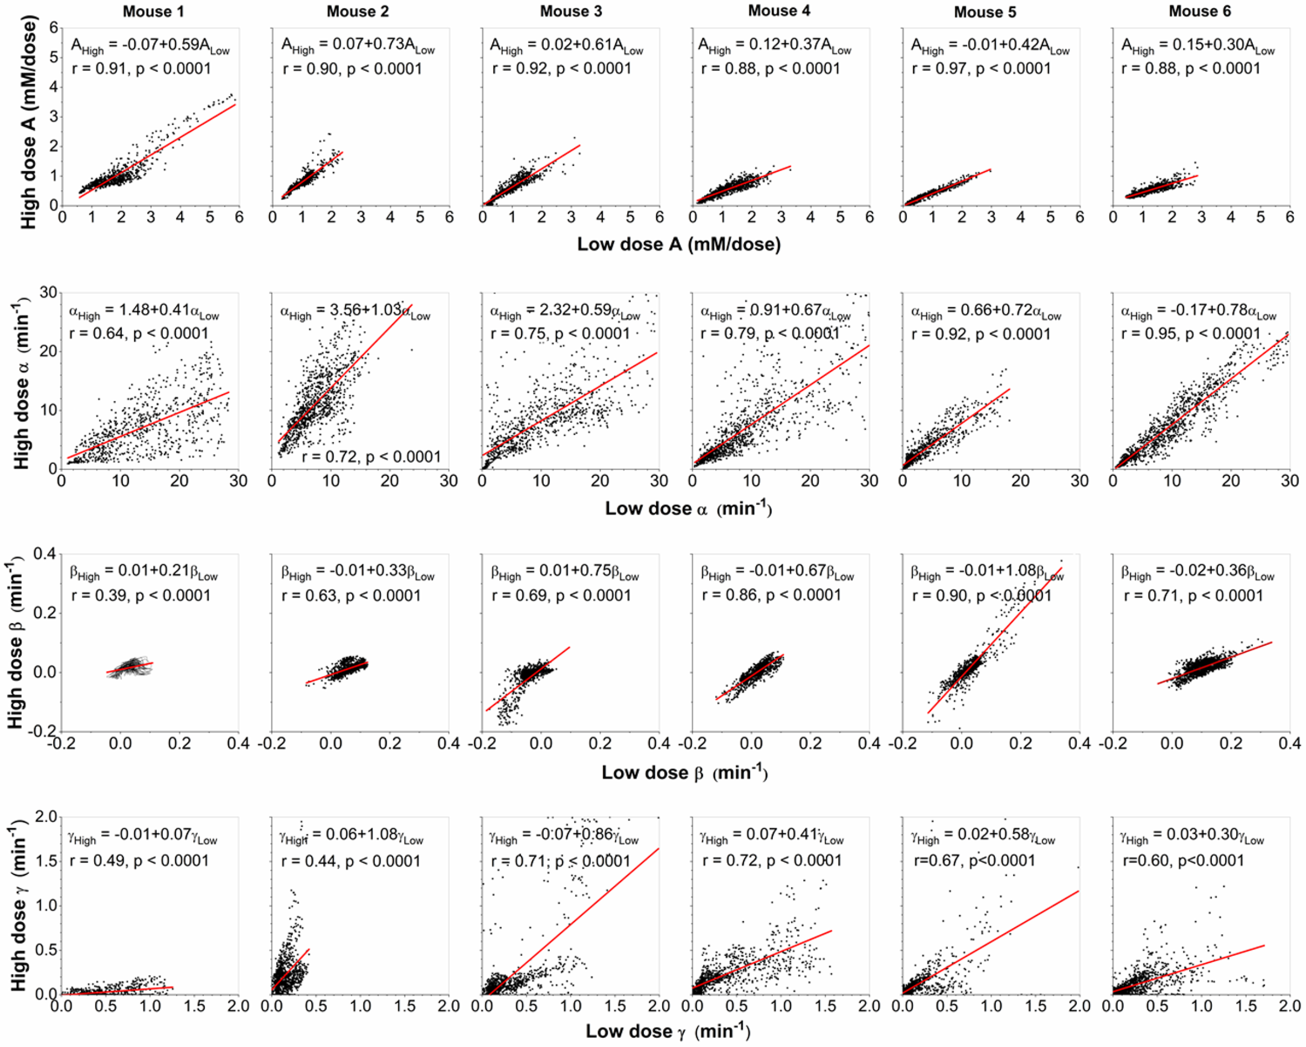
There are strong correlations (r=0.85-0.99, p<0.001) for physiological parameters Ktrans and ve obtained between LD and HD data (Fig. 4). Similarly, there are strong correlations (r=0.88-0.97, p<0.0001) for parameter A, and moderate to strong correlations (r=0.64-0.95, p<0.0001) for parameter α obtained from LD versus HD (Fig. 5). Correlations for parameters β and γ obtained from LD versus HD varied from weak to strong (r=0.39-0.90, p<0.0001), due to limited signal to noise ratio in LD DCE-MRI.
T2* measurements could not be included here to maintain high temporal resolution, therefore we performed separate T2* measurements using multi-gradient-echo sequence with both LD and HD as above. The T2* had almost no effect for LD data, but had relatively small effect for HD data and resulted in ~10-15% errors in physiological parameters.
DISCUSSION
Results demonstrate strong correlation between most LD and HD parameters suggesting that quantitative analysis of LD DCE-MRI provides approximately the same diagnostic information as HD DCE-MRI. In fact, Ktrans values were significantly higher for LD than HD, probably due to T2* and water exchange effects [7] suggesting that LD may allow more diagnostically effective measurements of pharmacodynamic parameters than HD. Comparison of LD and HD pharmacokinetic parameters may provide information regarding trans-membrane water exchange which may have diagnostic value [3].CONCLUSION
Our study demonstrates LD may be as effective as a HD of contrast agent for quantitatively cancer diagnosis. Comparison of LD and HD results may provide additional diagnostically useful information.Acknowledgements
This research is supported by National Institutes of Health (R01CA218700, U01CA142565, R01CA172801 and S10OD018448).References
[1] Choi JW, Moon WJ. Gadolinium Deposition in the Brain: Current Updates. Korean J Radiol. 2019; 20(1):134-147.
[2] Melsaether AN, Kim E, Mema E, Babb J, Kim SG. Preliminary study: Breast cancers can be well seen on 3T breast MRI with a half-dose of gadobutrol. Clin Imaging. 2019; 58:84-89.
[3] Pineda F, Sheth D, Abe H, Medved M, Karczmar GS. Low-dose imaging technique (LITE) MRI: initial experience in breast imaging. Br J Radiol. 11:20190302.
[4] He D, Chatterjee A, Fan X, Wang S, Eggener S, Yousuf A, Antic T, Oto A, Karczmar GS. Feasibility of Dynamic Contrast-Enhanced Magnetic Resonance Imaging Using Low-Dose Gadolinium: Comparative Performance With Standard Dose in Prostate Cancer Diagnosis. Invest Radiol. 2018; 53(10):609-615.
[5] Li KL, Lewis D, Jackson A, Zhao S, Zhu X. Low-dose T1W DCE-MRI for early time points perfusion measurement in patients with intracranial tumors: A pilot study applying the microsphere model to measure absolute cerebral blood flow. J Magn Reson Imaging. 2018; 48(2):543-557.
[6] Dale BM, Jesberger JA, Lewin JS, Hillenbrand CM, Duerk JL. Determining and optimizing the precision of quantitative measurements of perfusion from dynamic contrast enhanced MRI. J Magn Reson Imaging. 2003; 18(5):575-584.
[7] Kleppestø M, Larsson C, Groote I, Salo R, Vardal J, Courivaud F, Bjørnerud A. T2*-correction in dynamic contrast-enhanced MRI from double-echo acquisitions. J Magn Reson Imaging. 2014; 39(5):1314-9.
Figures