3317
Impaired blood flow and vascular reactivity in the choroid in diabetic mice1Radiology, Stony Brook University, Stony Brook, NY, United States, 2Icon Clinical Research Inc, North Wales, PA, United States, 3Ora Clinical, Andover, MA, United States, 4Ophthalmology, University of Texas Health Science Center, San Antonio, TX, United States, 5School of Osteopathic Medicine, University of the Incarnate Word, San Antonio, TX, United States
Synopsis
Diabetic retinopathy is a microvascular disease of the retina, in which basal blood flow and the vascular responses to metabolic conditions in diabetic eyes are perturbed. To determine if diabetic mice have impaired retinal/choroidal blood flow and vascular reactivity, we measured ocular blood flow using MRI during hypercapnia. In diabetic mice, basal choroidal blood flow was significantly decreased. In both control and diabetic mice, hypercapnia caused a significant increase in retinal and choroidal blood flow, but the choroidal response was significantly reduced in diabetic mice, indicating impaired vascular reactivity.
Purpose
Diabetic retinopathy is primarily considered a microvascular disease of the retina. Evidence indicates that vascular responses to demand and to metabolic conditions in diabetic eyes are perturbed. The retina is nourished by two separate vasculatures - the retinal vessels in the inner retina and the choroidal vessels outside the neural retina - which are separated by an avascular layer. MRI methods to quantify retinal blood flow (RBF) and choroidal blood flow (ChBF) in mice at 42x42x400 µm have recently been demonstrated (1). To determine if diabetic Akita mice have impaired retinal/choroidal blood flow and vascular reactivity to a metabolic challenge, we measured ocular blood flow using MRI during hypercapnia.Methods
Experiments used 8-month old male mice heterozygous for the Ins2Akita (Akita) mutation, which leads to hyperglycemia by 1 month of age (n=8). Age-matched, wild type, normoglycemic C57BL/6J mice were used for controls (n=8). Akita mice were confirmed to be hyperglycemic (non-fasting blood glucose >250 mg/dl) at 4.5 weeks of age. No control mice had glucose levels higher than 173 mg/dL. Blood flow of the retina and choroid was measured using arterial spin labeling (ASL) MRI on a 7T/30cm scanner (Bruker) with a 1500 mT/m gradient. Mice were anesthetized with 1.2-1.5% isoflurane. Temperature (37±0.5oC) and respiration rate (80-110 breaths/min) were monitored and maintained. A small surface eye coil (diameter=6 mm) was used for imaging. Continuous ASL was performed with a circular coil (diameter=8 mm) for labeling placed at the heart (1,2). Images were acquired with a single slice bisecting the eye with gradient-echo EPI with FOV=6x6 mm, matrix=144x144, 2 segments, 0.4 mm slice thickness, TR=3.0s, TE=9.8ms, labeling duration=2.6s, and post labeling delay=350ms. Blood flow MRI was performed for 5 min under air followed by 5 min under hypercapnia (5% CO2 inhalation in air), with two trials repeated. The retina was flattened for profile analysis to calculate average RBF and ChBF (1). BF under air and hypercapnia and the ratio between the two were calculated. Additionally, to determine if BF changes were associated with visual function loss, electroretinography (ERG, flash stimuli in dark-adapted animals) was also performed.Results
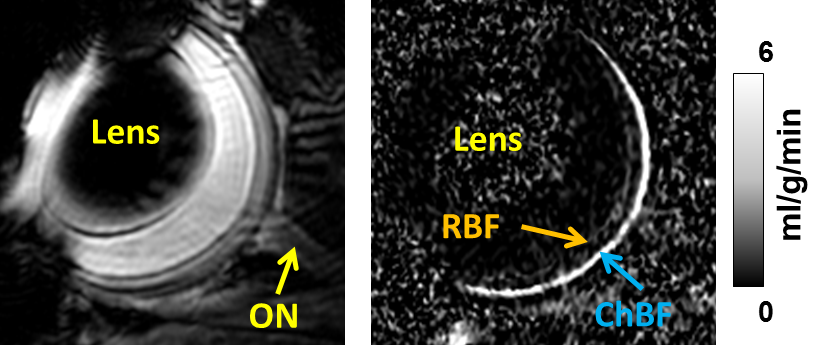
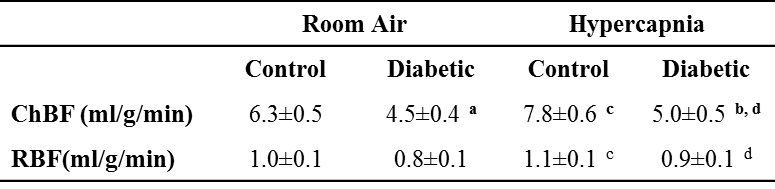
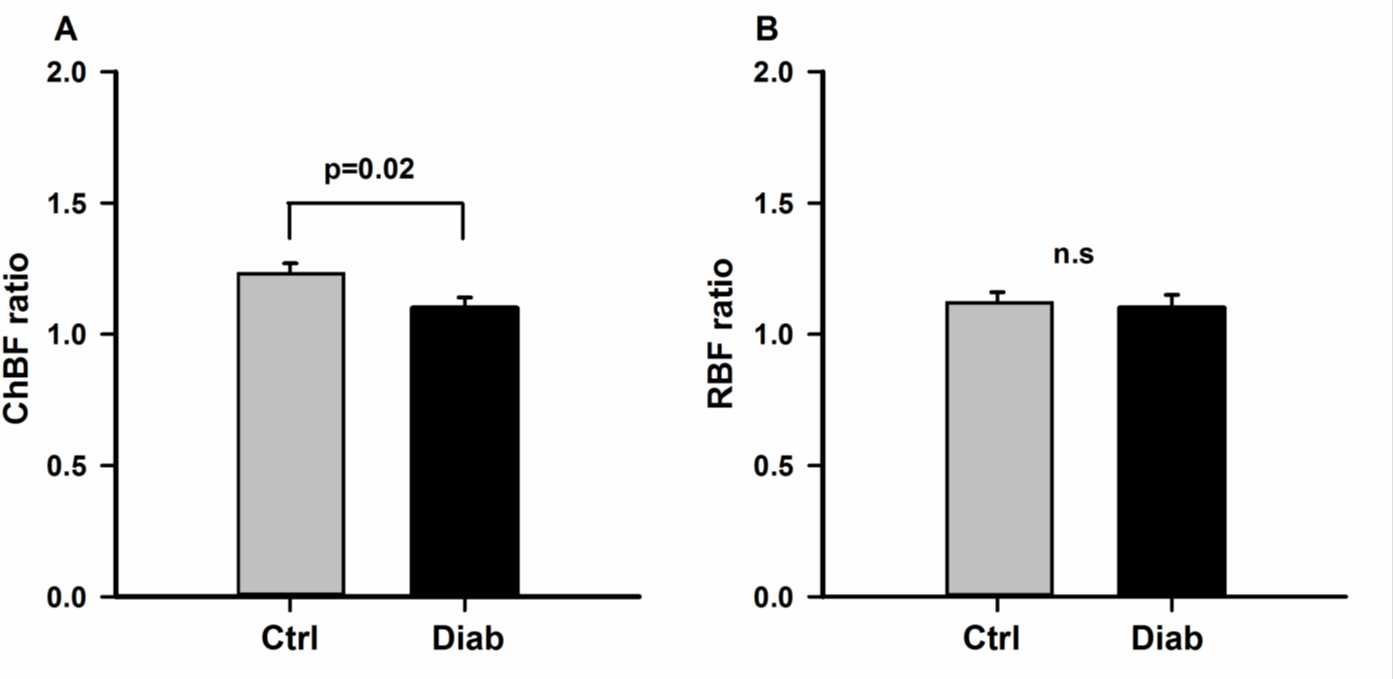
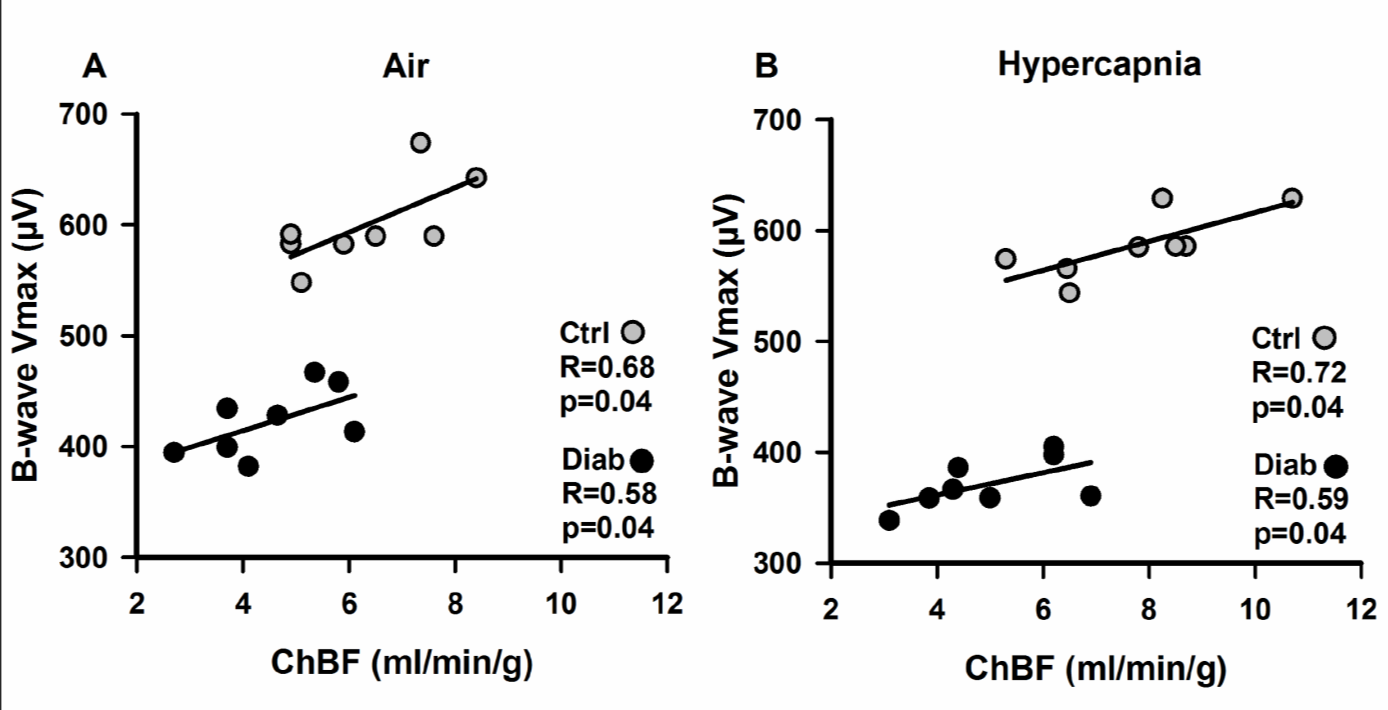
An example ocular blood flow map is shown in Figure 1. RBF and ChBF in control and diabetic mice breathing regular room air and 5% CO2 are given in Figure 2. ChBF was significantly reduced in diabetic compared to control mice (p=0.01). RBF also trended lower in diabetic mice, but the difference did not reach statistical significance. Hypercapnia significantly increased ChBF and RBF in both control and diabetic mice (p<0.05). However, the increase in ChBF due to hypercapnia was significantly lower in diabetic mice (11%) compared to controls (23%) (p=0.02, Figure 3A). The hypercapnia-induced increase in RBF was not significantly different between diabetic mice (11.7%) compared to controls (12.1%) (p=0.96, Figure 3B).To probe the relationship between blood flow and retinal neuronal performance in diabetes, we performed correlation analysis between ChBF and the amplitude of the b-wave from ERG, which both parameters were significantly reduced in diabetic mice (p<0.05). For both control and diabetic groups in both breathing conditions (air and hypercapnia), ChBF showed significant correlations with the ERG b-wave (r = 0.58 to 0.72, p<0.05 for all comparisons) (Fig. 4). In contrast, RBF was not correlated with the ERG b-wave in either breathing condition or either group (p>0.05).
Discussion
Diabetes can disrupt the response of the retina to metabolic challenges, likely due to vascular cell injury, including injury to or loss of endothelial cells and pericytes. Thus, we examined both basal ChBF and RBF and the vascular reactivity to hypercapnia. In diabetic mice, basal ChBF was significantly decreased, and RBF showed a non-significant trend to decrease. In both control and diabetic mice, hypercapnia caused a significant increase in ChBF and RBF, showing the vascular response to hypercapnia is partially maintained in diabetes. However, the choroidal vascular regulation was significantly impaired in diabetic mice.Higher ChBF correlated with better retinal function in both control and diabetic mice, suggesting retinal function in general is dependent upon the blood supply. Although changes to choroidal perfusion might be expected to affect the outer retina more so than the inner retina, we found changes in the b-wave of the ERG, which arise from the inner retina. Further work is needed to better explore the role of ChBF in visual function in diabetes. Blood flow deficits may precede clinical vascular signs of DR (4) and could thus be potential early markers of disease. This novel BF MRI approach could enable early detection, longitudinal disease staging, and monitoring of therapeutic intervention in the retina.
Acknowledgements
This work was supported by: NIH R01 EY023290, NIH R01 EY027751References
1. Muir ER, Duong TQ. MRI of retinal and choroidal blood flow with laminar resolution. NMR Biomed 2011;24:216-223.
2. Muir ER, Shen Q, Duong TQ. Cerebral blood flow MRI in mice using the cardiac spin-labeling technique. Magn Reson Med 2008;60:744-748.
3. Muir ER, De La Garza B, Duong TQ. Blood flow and anatomical MRI in a mouse model of retinitis pigmentosa. Magn Reson Med 2013;69:221-228.
4. Grunwald JE, DuPont J, Riva CE. Retinal haemodynamics in patients with early diabetes mellitus. Br J Ophthalmol 1996;80:327-331.
Figures