3315
Quantification of collateral blood flow using intravoxel incoherent motion MRI in a canine large vessel occlusion model of slow and fast evolvers1University of Massachusetts Medical School, Worcester, MA, United States, 2Worcester Polytechnic Institute, Worcester, MA, United States, 3Massachusetts General Hospital & Harvard Medical School, Boston, MA, United States, 4Omniox Inc., San Carlos, CA, United States
Synopsis
In acute ischemic stroke due to large vessel occlusion (LVO), variability of infarct evolution observed in humans is closely captured by the canine LVO model, which can predict dogs to be slow or fast evolvers. The extent of collateral blood supply has shown good correlations with infarct growth rate. This study investigated the use of intravoxel incoherent motion (IVIM) MRI to quantify microvascular perfusion. Longitudinal IVIM parameters clearly differentiated between slow and fast evolvers depicting collateral blood flow changes, which can determine the severity of ischemic injury and also track longitudinal changes in response to therapeutic treatments/interventions in preclinical studies.
Introduction
In acute ischemic stroke due to large vessel occlusion (LVO), the variability of infarct evolution observed in humans is closely captured by the canine LVO model.1 This model has recently been developed to predict, within 30 min of middle cerebral artery occlusion (MCAO), whether the infarct evolution will proceed at a slow (slow evolver) or fast (fast evolver) rate based on relative time-to-peak (rTTP) maps, a perfusion-weighted (PW) MRI parameter, derived from dynamic susceptibility contrast MRI.2 Intravoxel incoherent motion (IVIM)3 MRI is a diffusion-weighted (DW) MRI technique that can also measure microvascular perfusion but without the use of exogenous contrast agents or labeling of arterial spins as in the arterial spin labeling method. Although the conventional DW-MRI sequence based on high b-values (b = 1000 s/mm2) reflecting tissue diffusivity provides the best delineation of the infarct core region, additional information can be obtained from low b-values (b < 250 s/mm2), which reflect the microvascular perfusion. The assessment of pial collaterals has been shown to correlate with infarct growth rate in a previous canine LVO model.4 Thus, applying this assumption to our model suggests that the slow and fast evolvers could have varying collateral blood supply leading to differences in the microvascular perfusion and affecting the rate of infarct evolution. In this study, we quantified the collateral blood flow using IVIM MRI in the initial perfusion deficit lesion identified at the onset of MCAO from 30 min up to 4 h. In addition, we sought to establish whether the longitudinal IVIM parameters could differentiate between slow and fast evolvers.Methods
An autologous clot was injected into the MCA of 9 dogs to cause an occlusion and subsequent infarction as previously described.2 After confirming the MCAO using angiography, each dog was imaged using MRI. Imaging protocol included PW-MRI (TR/TE = 1500/20.1ms, FA = 40o, 60 dynamics, matrix = 320×320), which was performed during administration of 0.2 mmol/kg of Magnevist at ~30 min post-MCAO, and DW-MRI (TR/TE 2600/76ms, FA = 90o, 3-gradient direction b-values = 0, 50, 100, 150, 200, 250, 300, 500, 700, and 900 s/mm2, NEX = 6, matrix = 144×144), which was performed immediately after PW-MRI and every 30 min up to 4 h post-MCAO. As previously described,2 a prediction was made whether the dog would be a fast or slow evolver based on binning of rTTP map histograms derived from PW-MRI. Each dog received an oxygen carrier drug, which involved an intravenous bolus at ~45 min post MCAO followed by slow infusion for ~2 h. This regimen prolonged the infarct evolution while maintaining the infarct-evolution type (see Abstract ID#821). Histology was performed post-mortem using triphenyltetrazolium chloride (TTC) to confirm the brain infarct region. IVIM analysis was performed in a two-step fitting approach5 using:S(b)/S0=(1-f)e-bD+fe-b(D*+D)
where S(b) is the signal intensity at the respective b value, S0 is the signal at b = 0, f is the perfusion fraction, D is the molecular diffusion coefficient, and D* is the pseudo-diffusion coefficient related to microvascular perfusion. Infarct region of interest (ROI) based on rTTP maps2 and contralateral ROIs from each brain slice were fit using the above equation for each time-point. A normalized signal was also generated by taking a ratio of the infarct region to the non-infarct contralateral side. Parameter maps for D, f, D*, and also fD*, which relates to the blood flow, were generated on a voxel-by-voxel basis after applying a Gaussian filter on the raw images. Analysis of variance (ANOVA) for mixed models was used to determine if there was a significant change in the IVIM parameters between the slow and fast evolver groups, and with time post-MCAO.
Results and Discussion
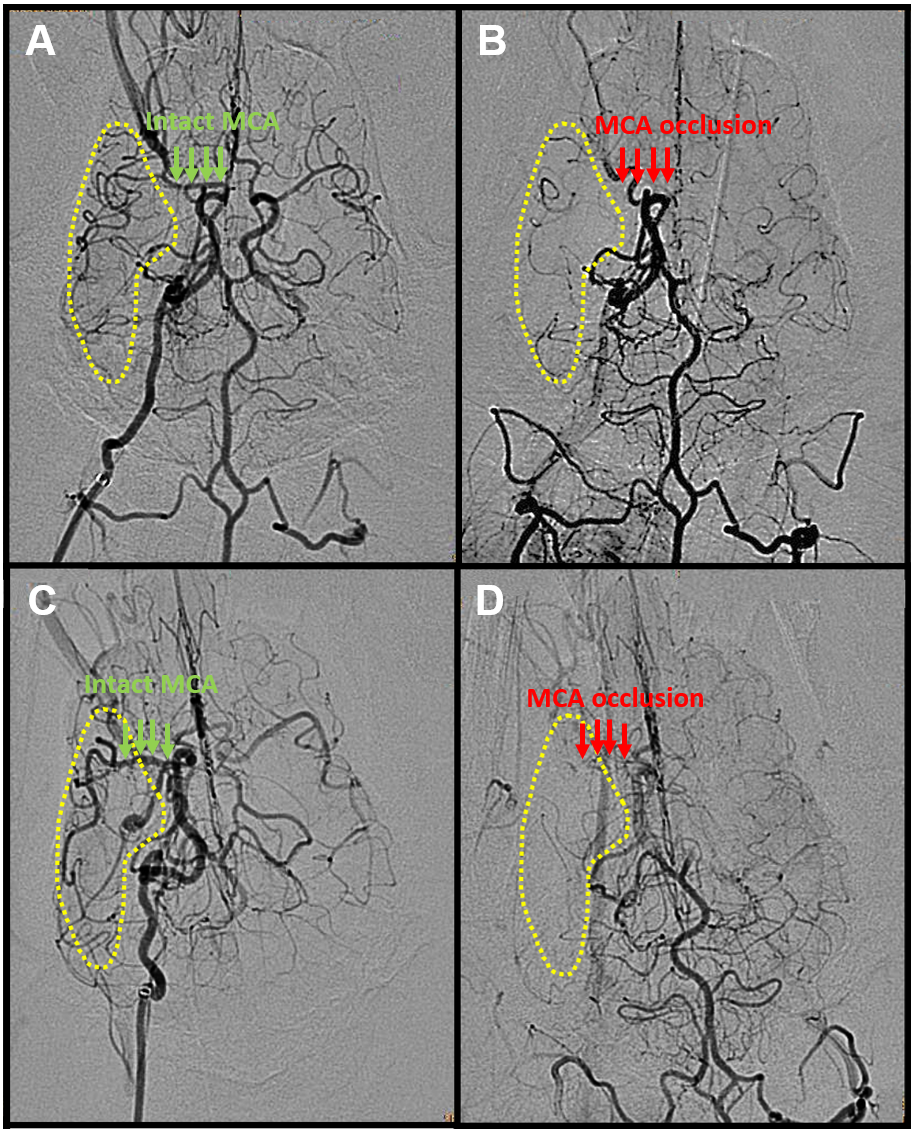
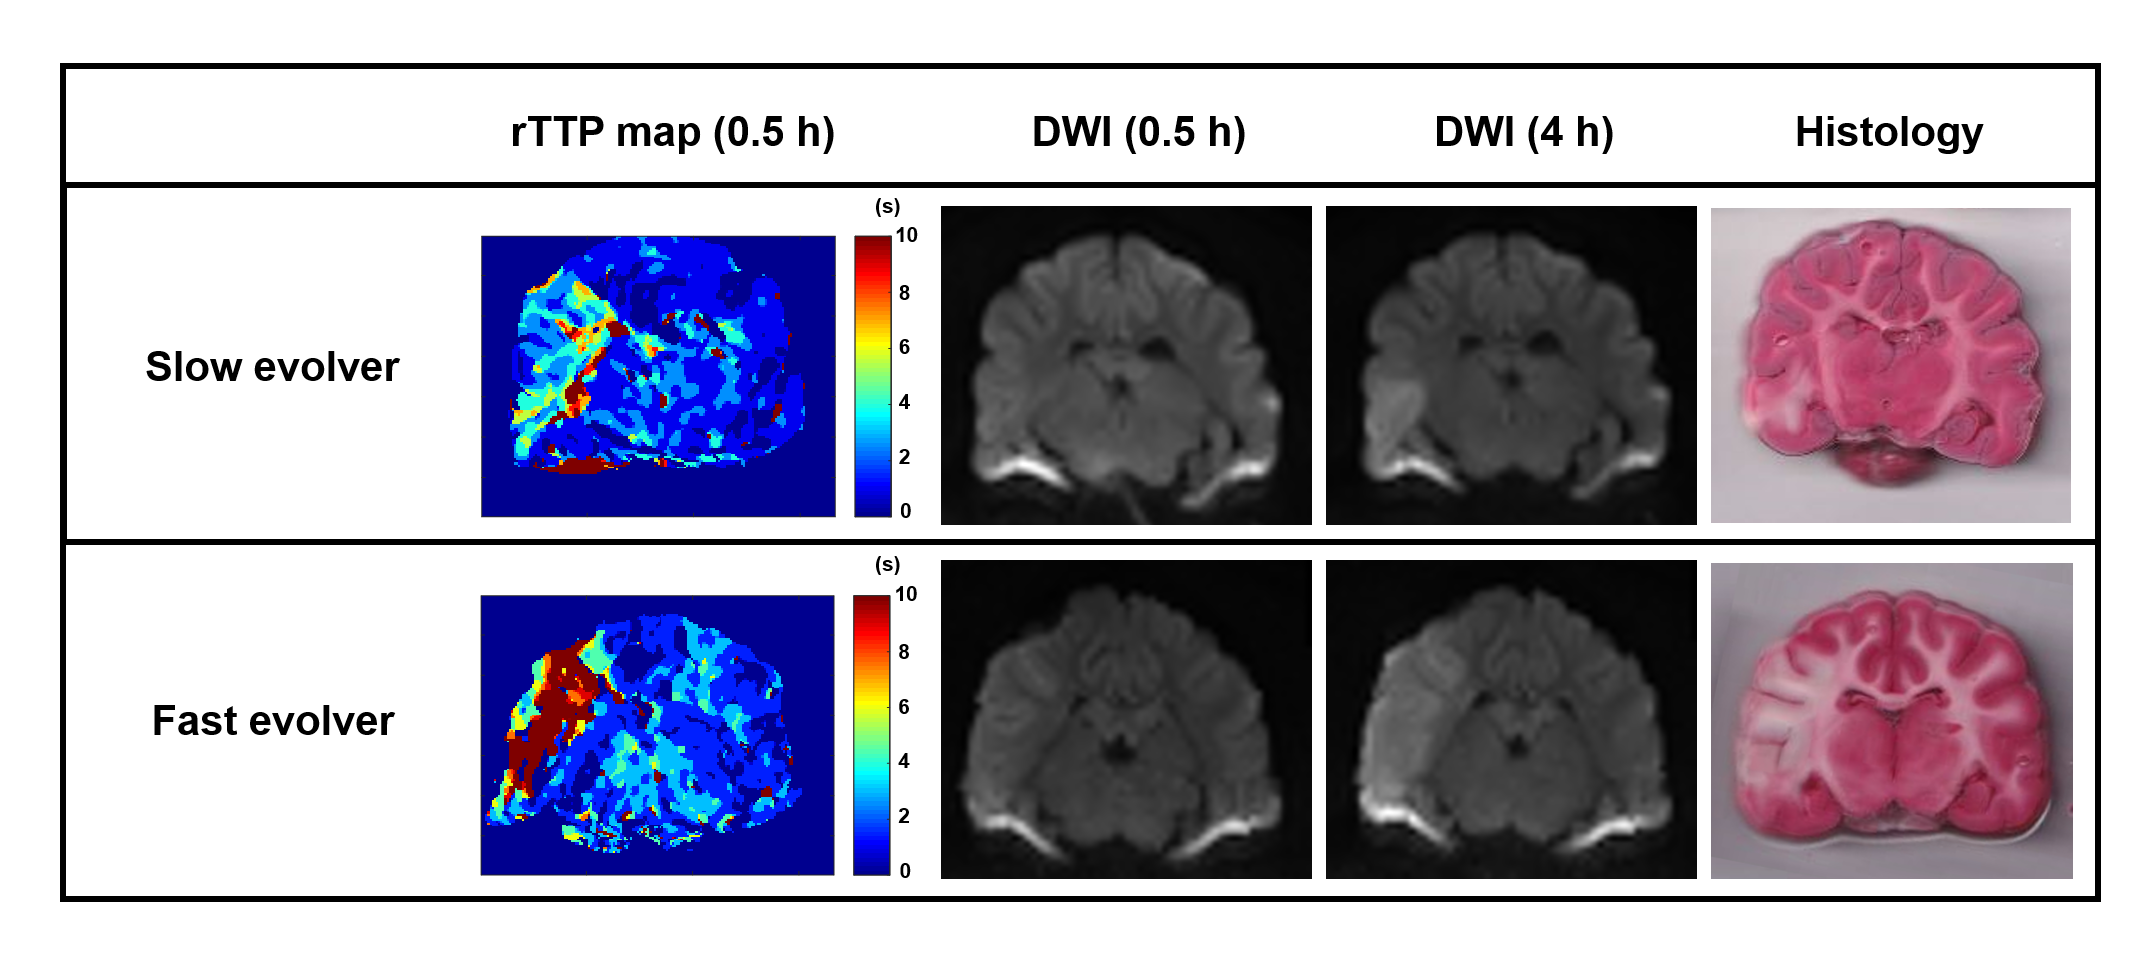
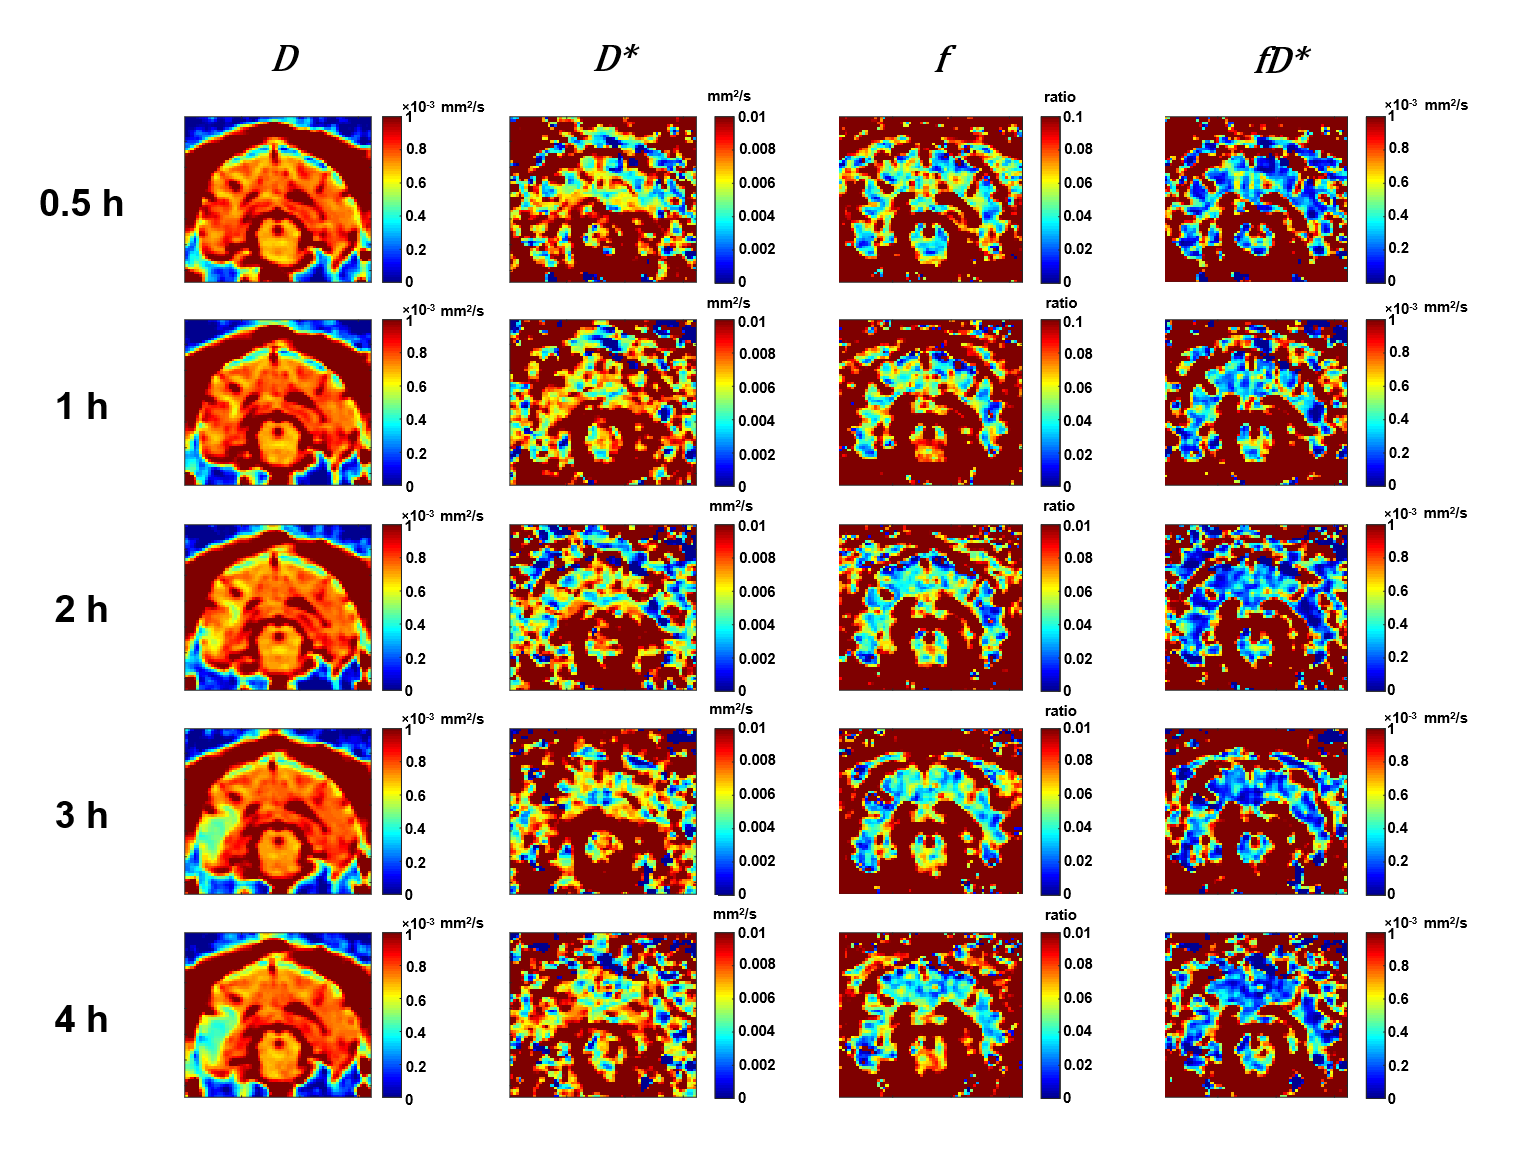
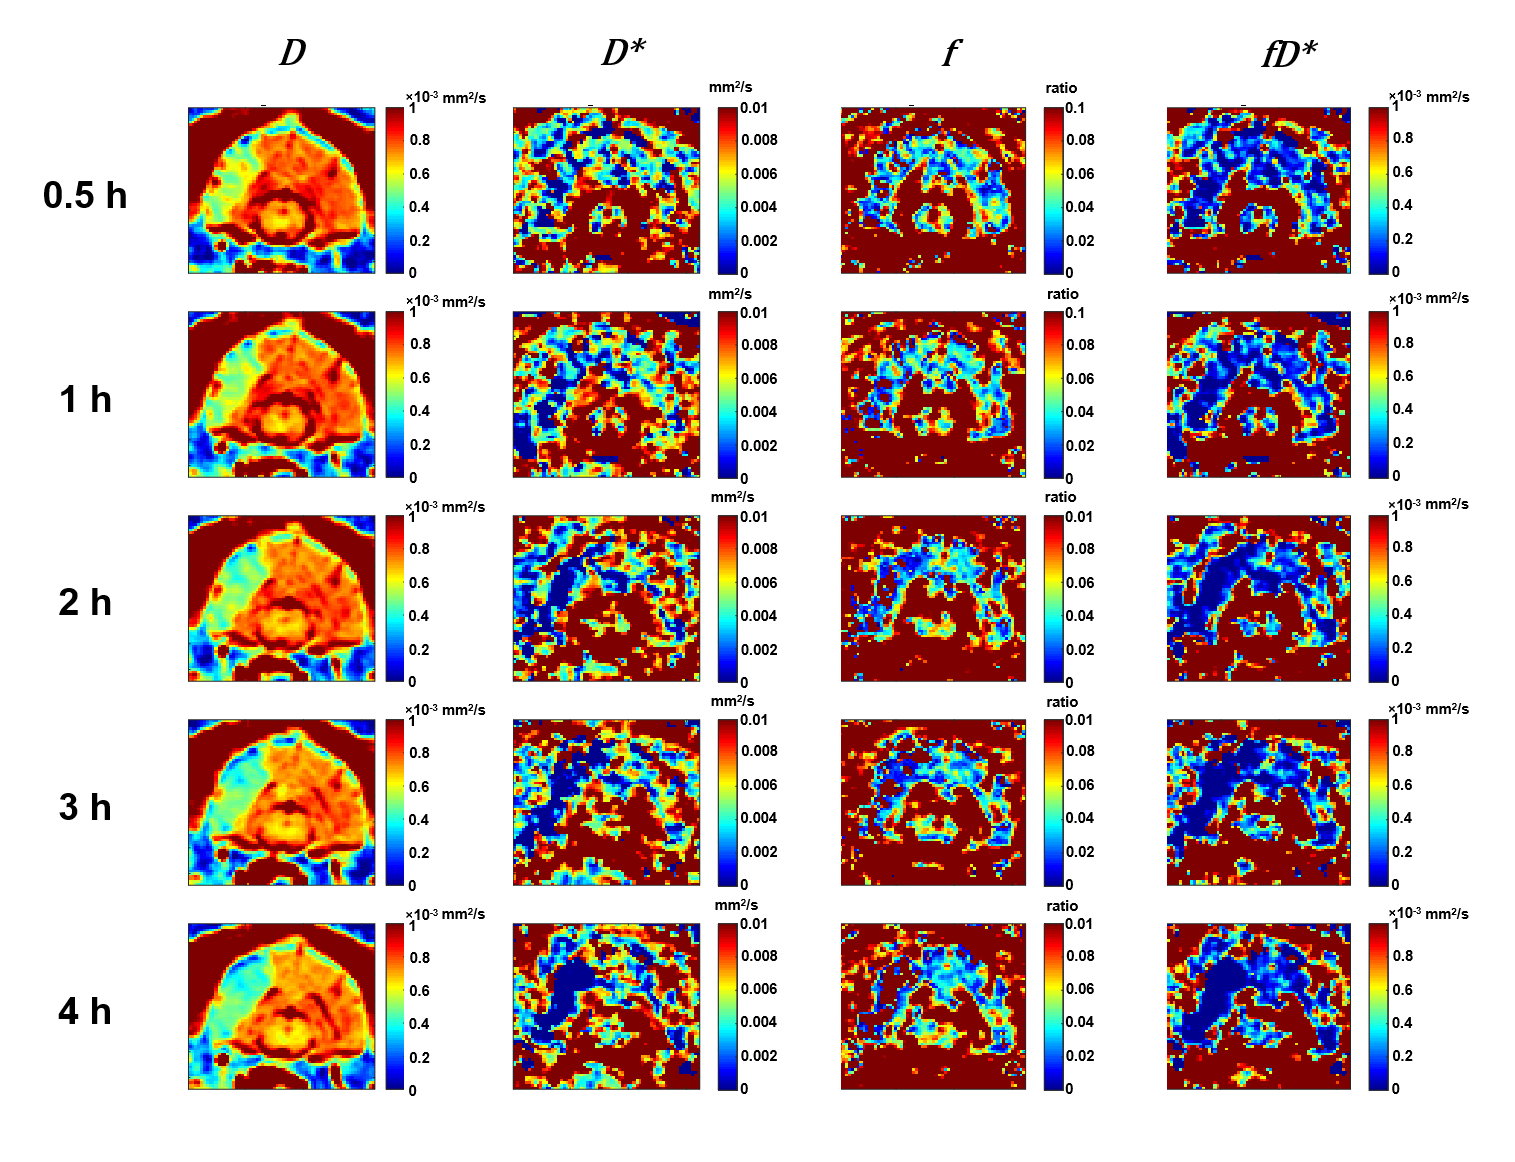
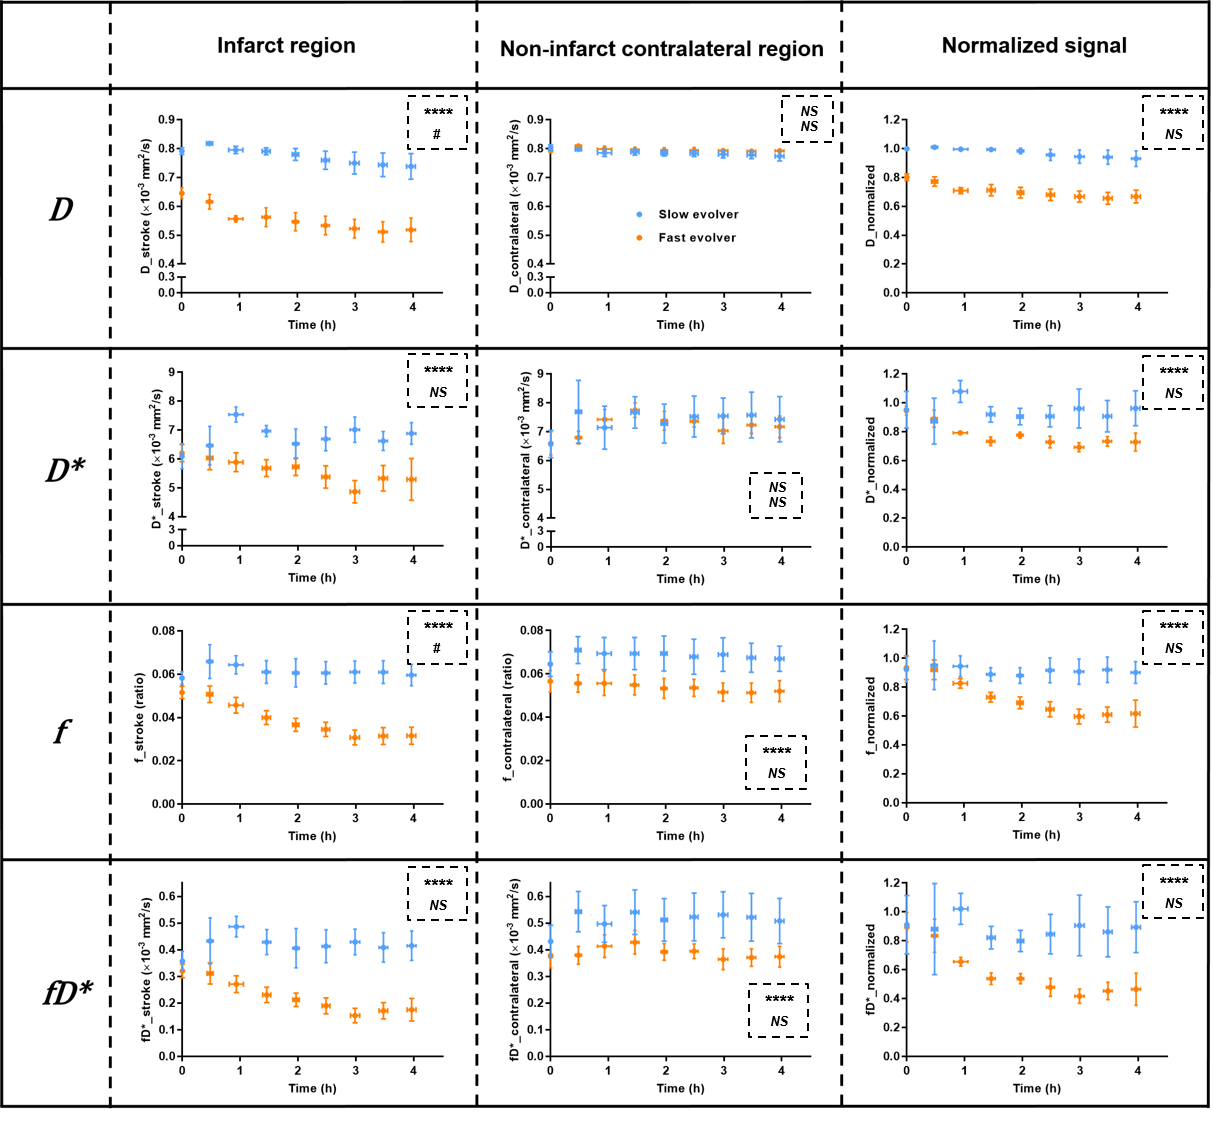
Of the 9 dogs, 4 were slow evolvers and 5 were fast evolvers. Figure 1 shows the digital subtraction angiography (DSA) images of a representative dog from each of the slow and fast evolver groups, highlighting the differences in cerebral vasculature prior to and post-clot placement in the MCA. Figure 2 shows the rTTP map and DW images from the same slow and fast evolver indicating the extent of the predicted and actual infarct regions, respectively. Figures 3 and 4 show a time series map of each defined IVIM parameter for the slow and fast evolvers, respectively. A decrease in all the IVIM parameters is apparent in the fast evolver compared to the slow evolver over time. Decrease in f, D*, and fD* indicate a lack of perfusion and hence can be related to a failure of the collaterals over time, which appears to extend even beyond the infarct region defined by the D map. A quantitative summary (Fig. 5) of IVIM parameters indicate a significant difference between the slow and fast evolvers in the infarct region.Conclusion
Recently, IVIM technique in stroke patients has been promising in the assessment of cerebral perfusion.5-6 Longitudinal IVIM parameters depicting collateral blood flow changes (f, D*, and fD*) clearly differentiated between slow and fast evolvers in the dog LVO model. This direct quantification of collateral blood flow changes (without contrast agents) can not only determine the severity of the ischemic injury but also track longitudinal changes in response to therapeutic treatments/interventions in preclinical studies.Acknowledgements
This work is funded by NINDS 5R44NS076272-03. The content is solely the responsibility of the authors and does not represent the official views of the NIH.References
1. Kang BT, Lee JH, Jung DI et al. Canine model of ischemic stroke with permanent middle cerebral artery occlusion: clinical and histopathological findings. J Vet Sci. 2007;8:369-376.
2. Shazeeb MS, King RM, Brooks OW et al. Infarct Evolution in a Large Animal Model of Middle Cerebral Artery Occlusion. Transl Stroke Res. 2019;doi: 10.1007/s12975-019-00732-9.
3. Le Bihan D, Breton E, Lallemand D et al. MR imaging of intravoxel incoherent motions: applications to diffusion and perfusion in neurologic disorders. Radiology. 1986;161:401-407.
4. Christoforidis GA, Vakil P, Ansari SA et al. Impact of pial collaterals on infarct growth rate in experimental acute ischemic stroke. AJNR Am J Neuroradiol. 2017;38:270-275.
5. Zhu G, Federau C, Wintermark M et al. Comparison of MRI IVIM and MR perfusion imaging in acute ischemic stroke due to large vessel occlusion. Int J Stroke. 2019; doi: 10.1177/1747493019873515.
6. Federau C, Wintermark M, Christensen S et al. Collateral blood flow measurement with intravoxel incoherent motion perfusion imaging in hyperacute brain stroke. Neurology. 2019; 92(21):e2462-e2471.
Figures