3313
Comparison of multi-platform 2D and 3D MR elastography in vivo and in vitro
Paul Kennedy1,2, Daniel Stocker1,2, Octavia Bane1,2, Stefanie Hectors1,2,3, Bradley D Bolster Jr. 4, and Bachir Taouli1,2
1BioMedical Engineering and Imaging Institute, Icahn School of Medicine at Mount Sinai, New York, NY, United States, 2Department of Diagnostic, Molecular and Interventional Radiology, Icahn School of Medicine at Mount Sinai, New York, NY, United States, 3Department of Radiology, Weill Cornell Medicine, New York, NY, United States, 4Siemens Medical Solutions USA, Inc., Salt Lake City, UT, United States
1BioMedical Engineering and Imaging Institute, Icahn School of Medicine at Mount Sinai, New York, NY, United States, 2Department of Diagnostic, Molecular and Interventional Radiology, Icahn School of Medicine at Mount Sinai, New York, NY, United States, 3Department of Radiology, Weill Cornell Medicine, New York, NY, United States, 4Siemens Medical Solutions USA, Inc., Salt Lake City, UT, United States
Synopsis
In this study we assess the variation in 2D and 3D MR elastography (MRE) measures in patients, volunteers and a phantom across two MR system vendors. Interobserver variability was also examined. 2D and 3D MRE liver measurements were not significantly different across systems and showed excellent intraclass correlation coefficient (ICC) between readers. Spleen measurement showed excellent ICC between readers but significant variation in 3D MRE spleen stiffness was found between systems. Liver 3D MRE is stable across platforms however further study is required to assess the bias in 3D MRE spleen measurements from multiple vendors.
Introduction
3D MR elastography (MRE) has been proposed as a more accurate measure of tissue stiffness due to the integration of the 3D wave field into the inversion algorithm addressing elevated stiffness in the presence of oblique waves in 2D MRE. Before it is clinically adopted the differences between 2D and 3D MRE and the variability between readers and vendors must be clarified. In this prospective study 2D and 3D MRE measures from two vendors are compared in patients and volunteers by two readers. A phantom study is also performed.Methods
In this prospective single center study 5 patients and 3 volunteers (M/F 6/2 mean age 53±3.1y) underwent 2D and 3D MRE exams at 60Hz on two MR systems (1.5T MAGNETOM Aera, Siemens Healthcare, Erlangen, Germany and 3T Discovery 750W, GE Healthcare, Waukesha, WI, USA) on the same day. All patients had liver disease and 4/5 patients had portal hypertension (HVPG 8.2±4.2 mmHg). A phantom provided with the MRE hardware (Resoundant, Rochester, MN, USA) was also scanned 5 times on both systems on the same day. Driver amplitude was identical for patients and phantoms between systems. MRE data were acquired on both systems using a prototype spin-echo EPI sequence with default protocol parameters (Table 1) and dual paddles enabling simultaneous liver and spleen data acquisition1. On the GE system, 3D MRE data were reconstructed using a previously described algorithm2. 2D MRE data on both systems were reconstructed using a commercially available algorithm3. A recently developed 3D MRE algorithm generated 3D Siemens MRE outputs. The magnitude of the complex shear modulus was analyzed by one reader for phantom data and 2 readers for human data. Reader comparisons were performed using intraclass correlation coefficients (ICC). Bland Altman analysis determined inter- and intraplatform variation between 2D/3D measurements. Spearman correlation were performed to assess the relationship between MRE measurements across platforms. Wilcoxon signed rank tests were performed on inter- and intraplatform 2D/3D MRE measurements.Results
Phantom measurements showed very small deviation in repeated 2D and 3D measurements for both systems (variation <0.03 kPa). 3D MRE measurements were significantly lower for both Siemens and GE systems (p=0.043) however the mean difference was only 0.08 kPa for Siemens and 0.18 kPa for GE. There was also a small but significant difference between 2D (mean difference 0.13 kPa, p=0.043) and 3D measurements (mean difference 0.23 kPa, p=0.043) across platforms.MRE failed in the liver of one patient on one system due to poor wave propagation. Example images are shown in Figure 1. For both readers, no significant difference was found between 2D/3D measurements of the liver on both systems (p>0.161). Bland-Altman analysis found a bias of 0.01 kPa for 2D liver MRE across platforms and a bias of 0.38 kPa for 3D liver measurements (Figure 2). ICC was excellent between both readers for liver 2D MRE (0.997 for both platforms) and 3D MRE (GE – 0.990, Siemens – 0.980). Liver 2D and 3D MRE measurements were significantly correlated on both GE and Siemens systems for both readers (Table 2).
For spleen, there was again excellent ICC for 2D MRE (GE - 0.989, Siemens - 0.998) and 3D MRE (GE - 0.997, Siemens - 0.987). Bland-Altman analysis found a bias of 0.06 kPa for 2D spleen MRE across platforms and a significant bias of 2.03 kPa for 3D spleen measurements (Figure 2). Spleen 2D and 3D MRE measurements were significantly correlated for both readers on both systems (Table 2). There was a significant difference found between 2D/3D MRE spleen measurements on both platforms (p=0.012 for both) however on one platform 2D spleen stiffness was significantly higher than 3D and on the other the opposite was true. In healthy volunteers only, higher mean 2D MRE stiffness was seen on both platforms and from both readers however the differences were not significant (p>0.109). With the exception of 2D and 3D MRE liver stiffness on the GE system all other stiffness measurements were significantly higher in patients compared to volunteers (p=0.036 for all, Table 3).
Discussion
These results suggest that 2D and 3D MRE measurements in phantoms are significantly different however the difference is negligible. Mean 2D MRE liver stiffness was higher for both platforms however the difference was not significant in contrast to previous reports4-6, potentially due to small sample size. Spleen MRE measurements did not agree across platforms, with 2D showing significantly higher stiffness than 3D on one system and significantly lower stiffness on the other. In healthy volunteers 2D MRE spleen stiffness was higher than 3D MRE stiffness on both platforms. These discrepancies are likely due to the difference in inversion algorithms employed coupled with the more complex geometry of the spleen and pathology associated with portal hypertension. Finally, ICCs were excellent for agreement between readers.Conclusion
2D and 3D MRE of the liver show reasonable agreement across platforms and readers in this small study. Spleen results were not concordant across platforms likely due to differences in reconstruction techniques and the more anisotropic structure of the spleen in the setting of liver disease related portal hypertension. Further work in a larger cohort is required to determine the bias in spleen 3D MRE measurements across platforms.Acknowledgements
This research was supported by NIDDK grant 1R01DK113272. Many thanks to Stephan Kannengiesser, Michael Bush, Kevin Glaser, Jun Chen and Roger Grimm for disseminating and supporting the sequences and reconstructions used in this work.References
- Dyvorne HA, Jajamovich GH, Besa C, Cooper N, Taouli B. Simultaneous measurement of hepatic and splenic stiffness using MR elastography: preliminary experience. Abdom Imaging 2015;40(4):803-809.
- Shi Y, Glaser KJ, Sudhakar VK, Ben-Abraham EI, Ehman RL. Feasibility of Using 3D MR Elastography to Determine Pancreatic Stiffness in Healthy Volunteers. Journal of magnetic resonance imaging : JMRI 2015;41(2):369-375.
- Dzyubak B, Glaser K, Yin M, et al. Automated Liver Stiffness Measurements with Magnetic Resonance Elastography. Journal of magnetic resonance imaging : JMRI 2013;38(2):371-379.
- Morisaka H, Motosugi U, Glaser KJ, et al. Comparison of diagnostic accuracies of two- and three-dimensional MR elastography of the liver. J Magn Reson Imaging 2017;45(4):1163-1170.
- Wang K, Manning P, Szeverenyi N, et al. Repeatability and reproducibility of 2D and 3D hepatic MR elastography with rigid and flexible drivers at end-expiration and end-inspiration in healthy volunteers. Abdom Radiol 2017:1-12.
- Wang J, Glaser KJ, Zhang T, et al. Assessment of advanced hepatic MR elastography methods for susceptibility artifact suppression in clinical patients. J Magn Reson Imaging 2018;47(4):976-987.
Figures
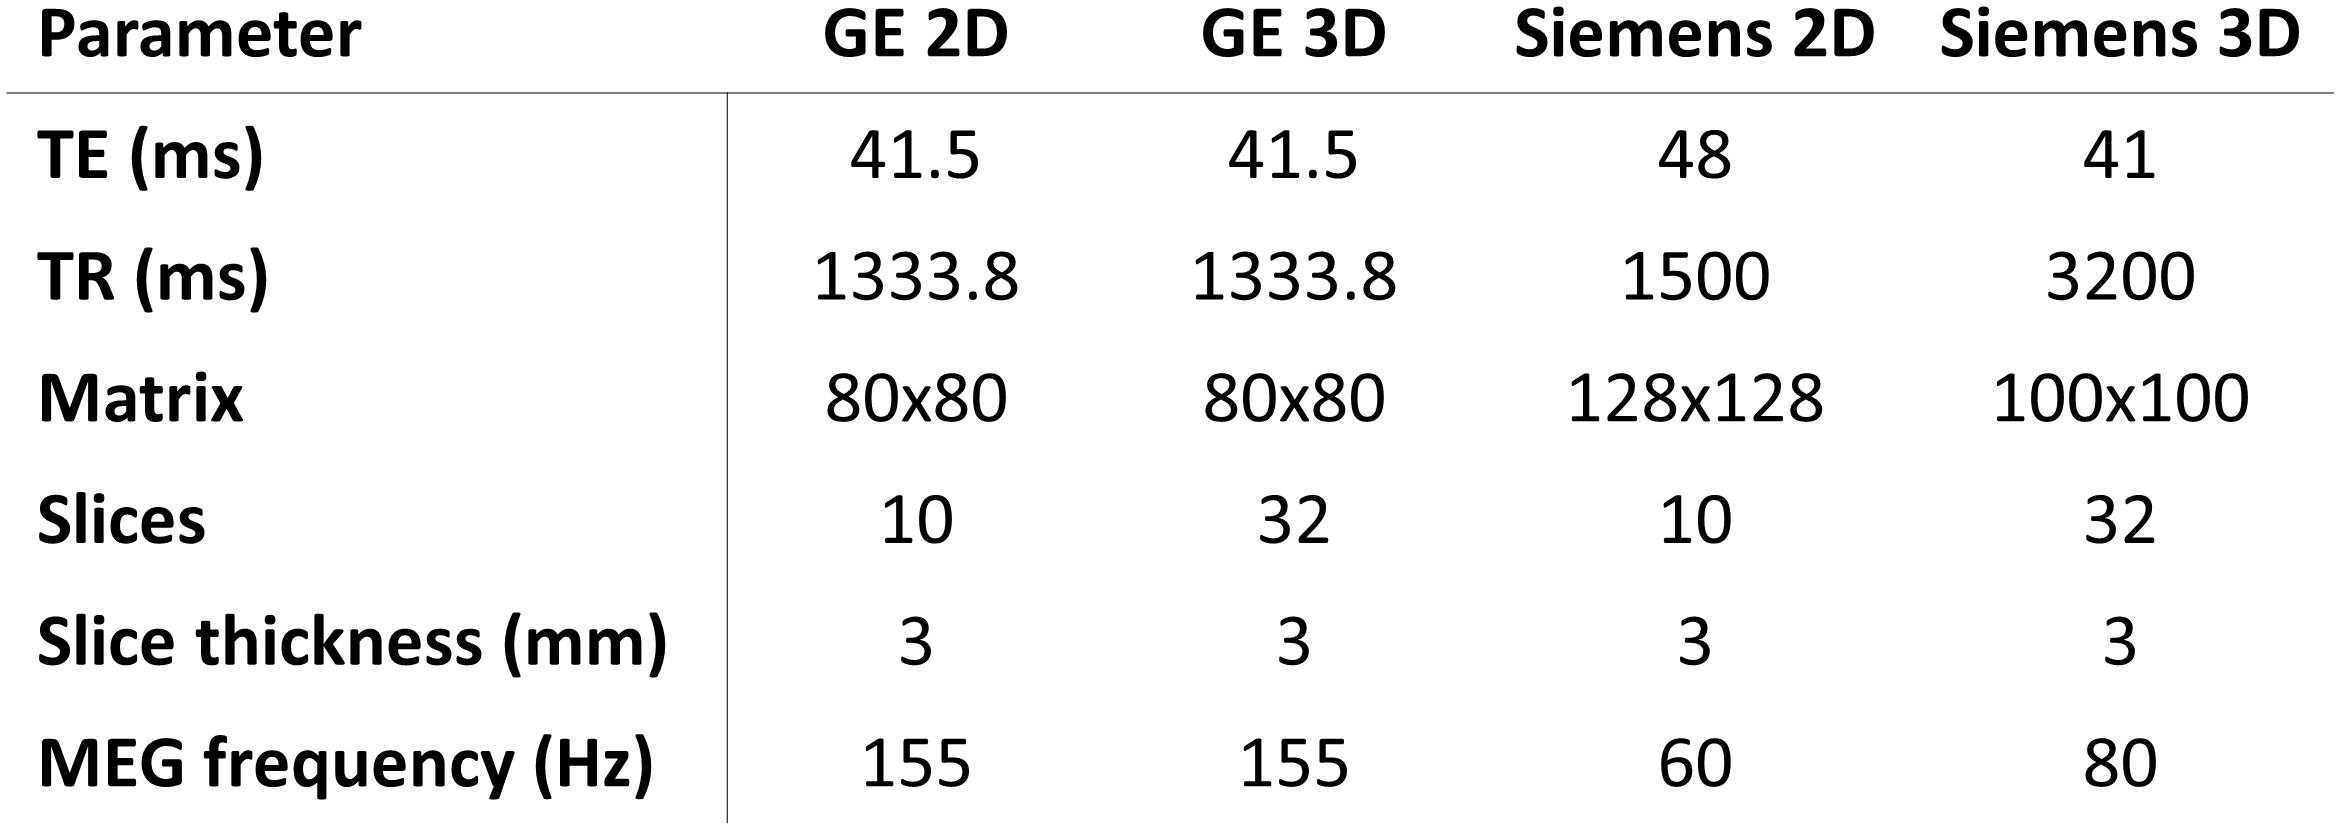
Table 1: Imaging
parameters for MRE sequences
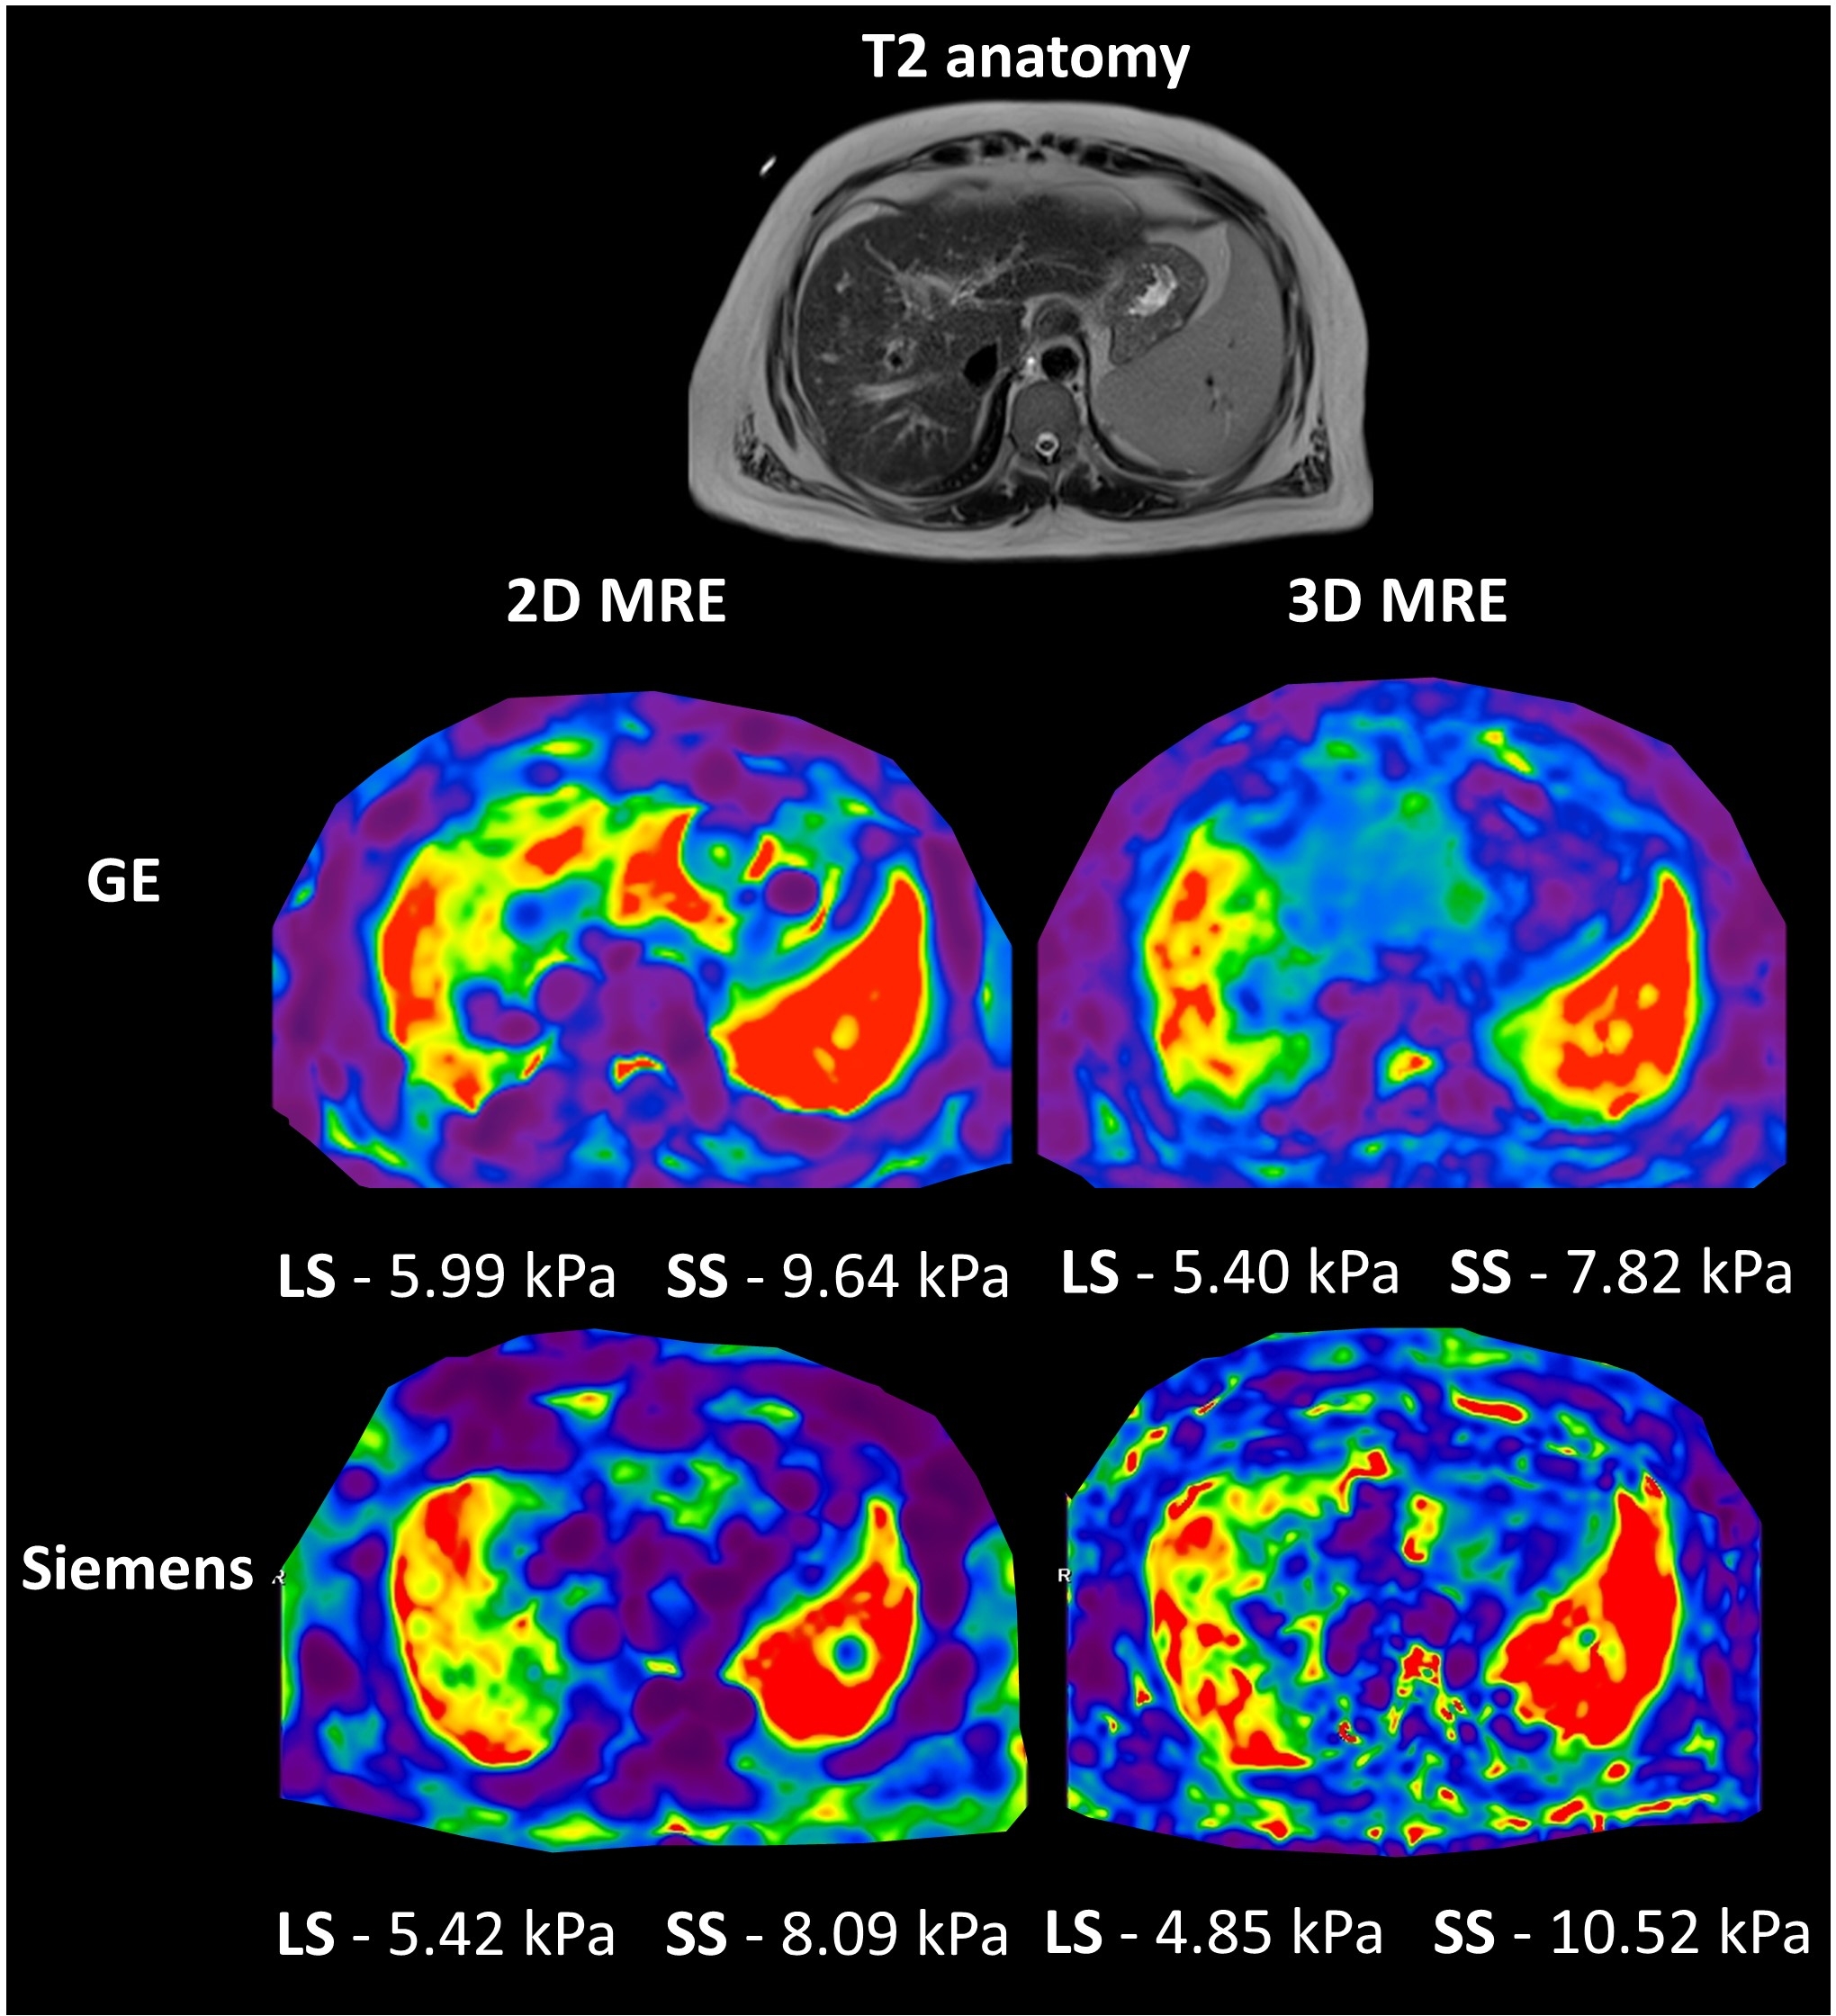
Figure 1: Example images from a 48 year old male with biopsy proven
cryptogenic cirrhosis and portal hypertension (HVPG 15mmHg). 2D and 3D MRE liver
and spleen stiffness from both
vendors are shown.
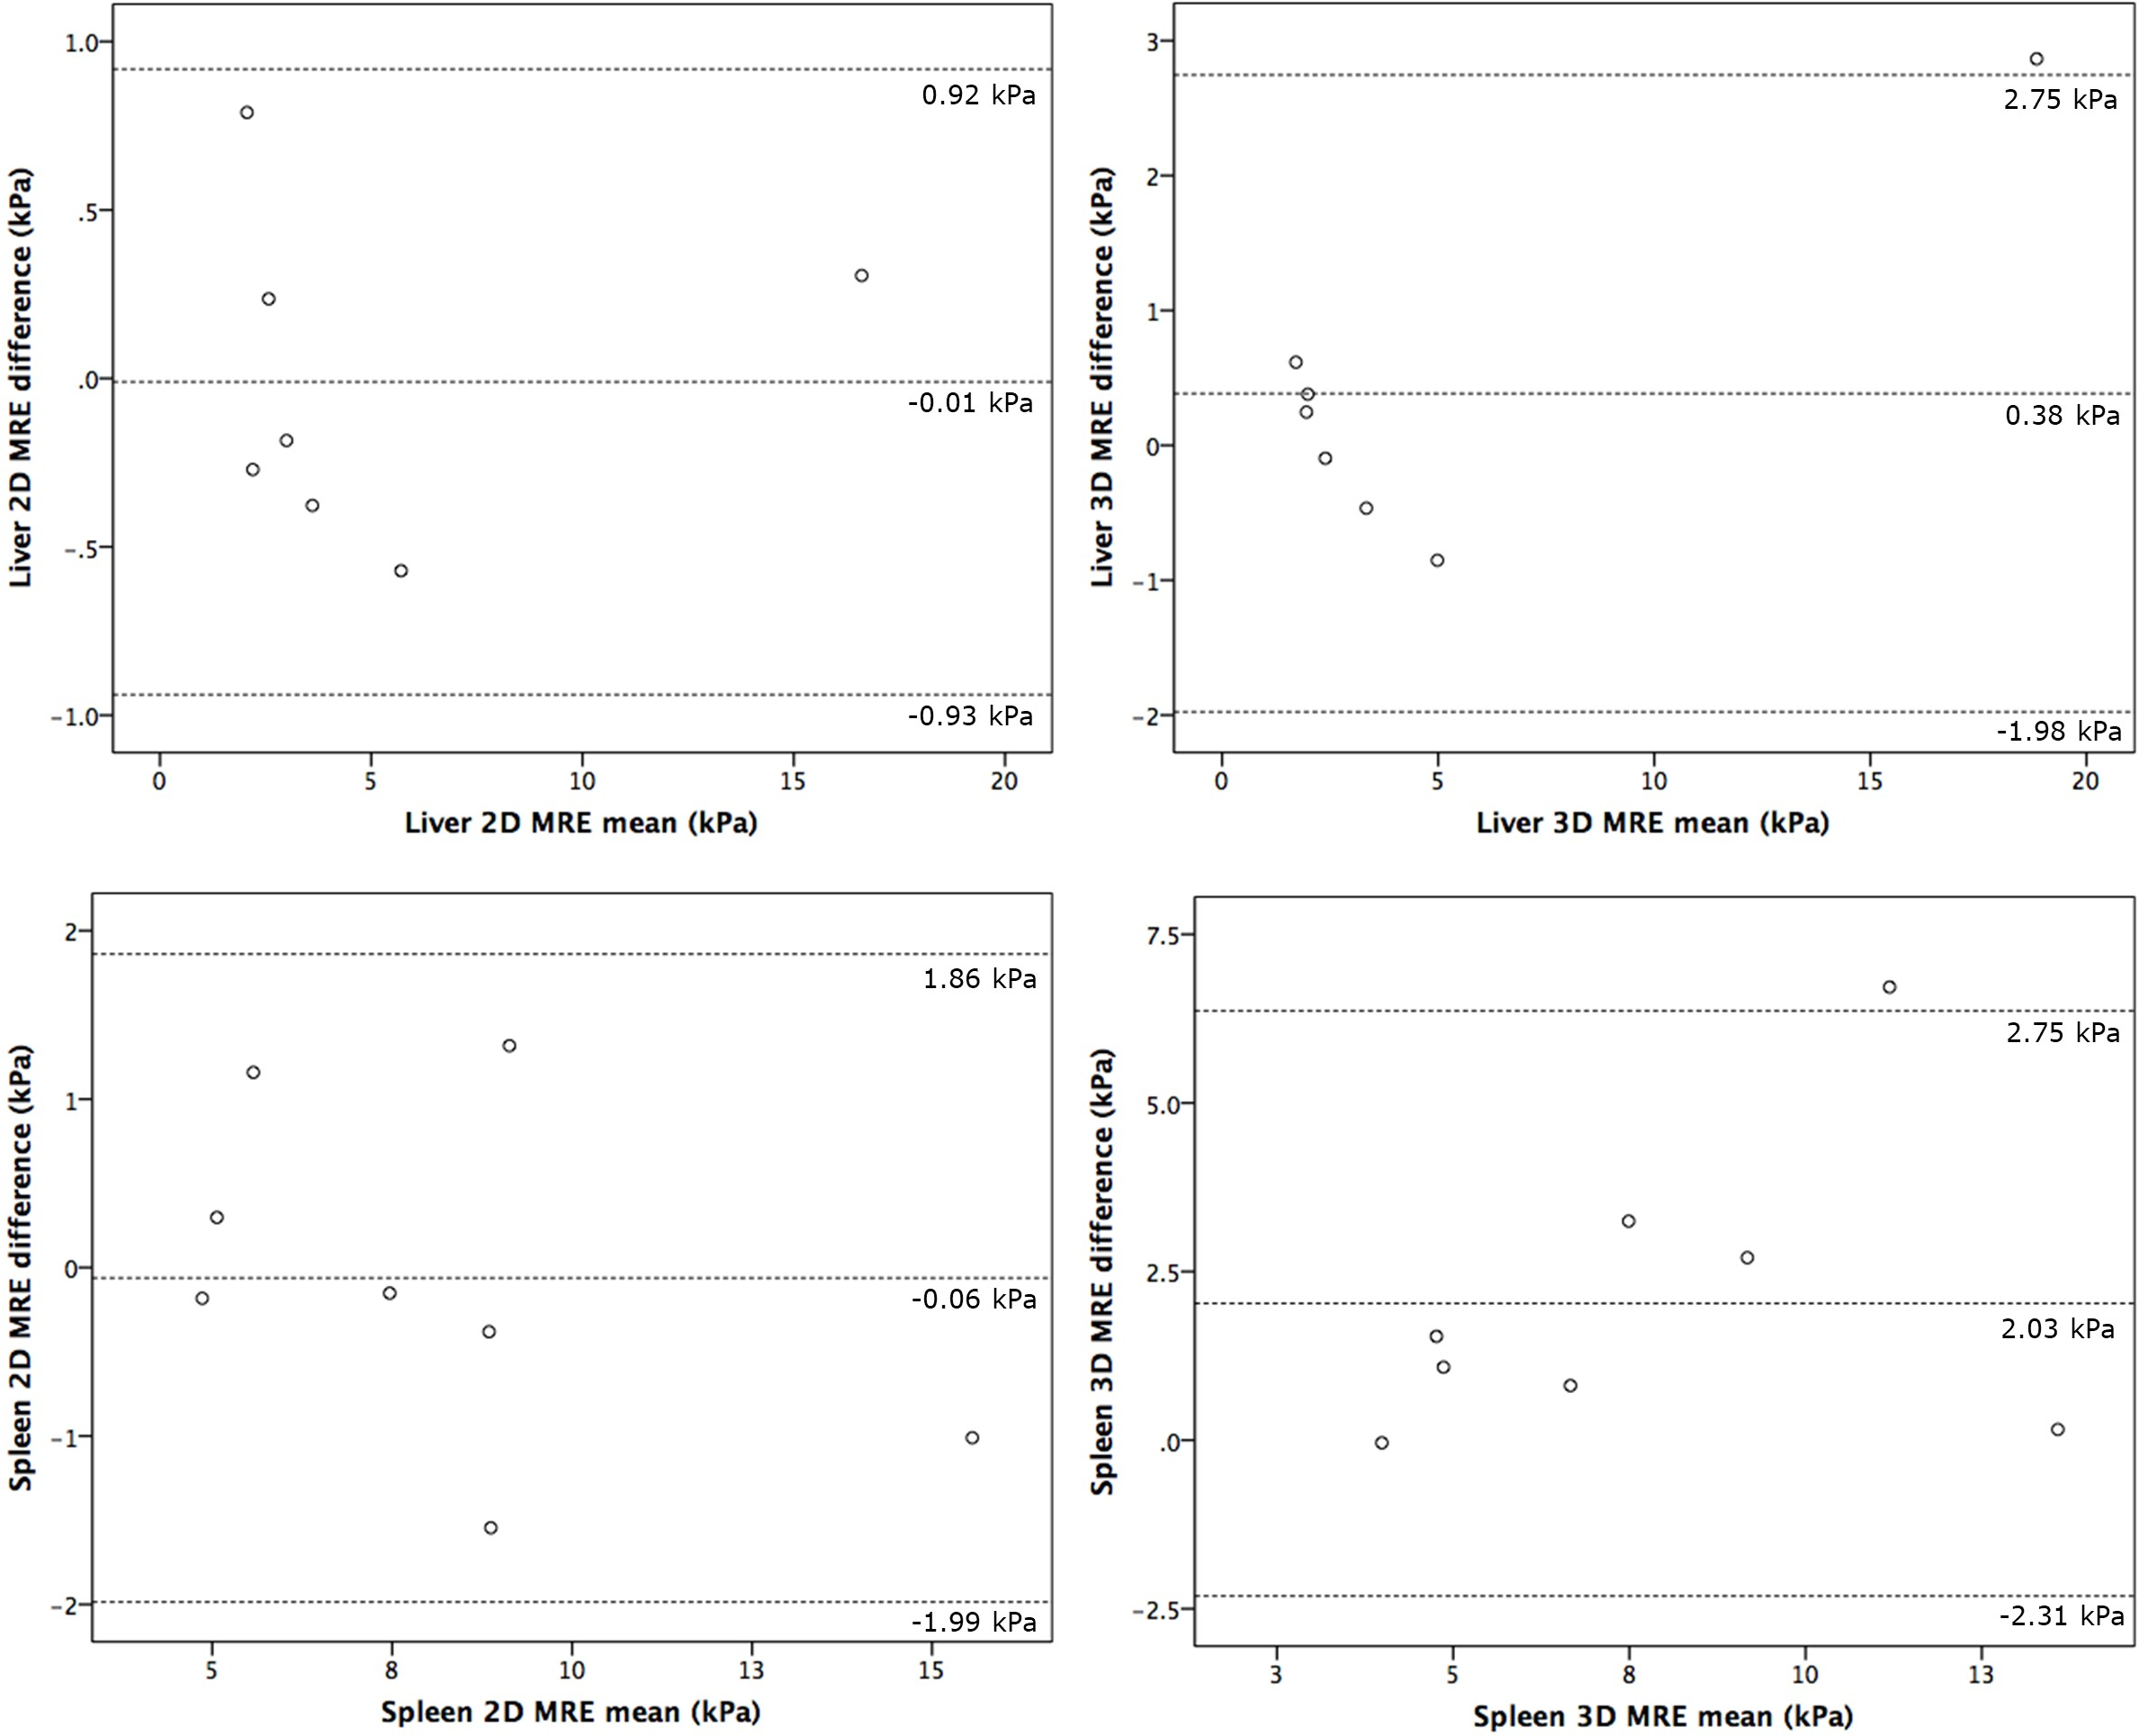
Figure 2: Bland-Altman plots of
2D (left) and 3D (right) MRE measurements in liver (top) and spleen (bottom).
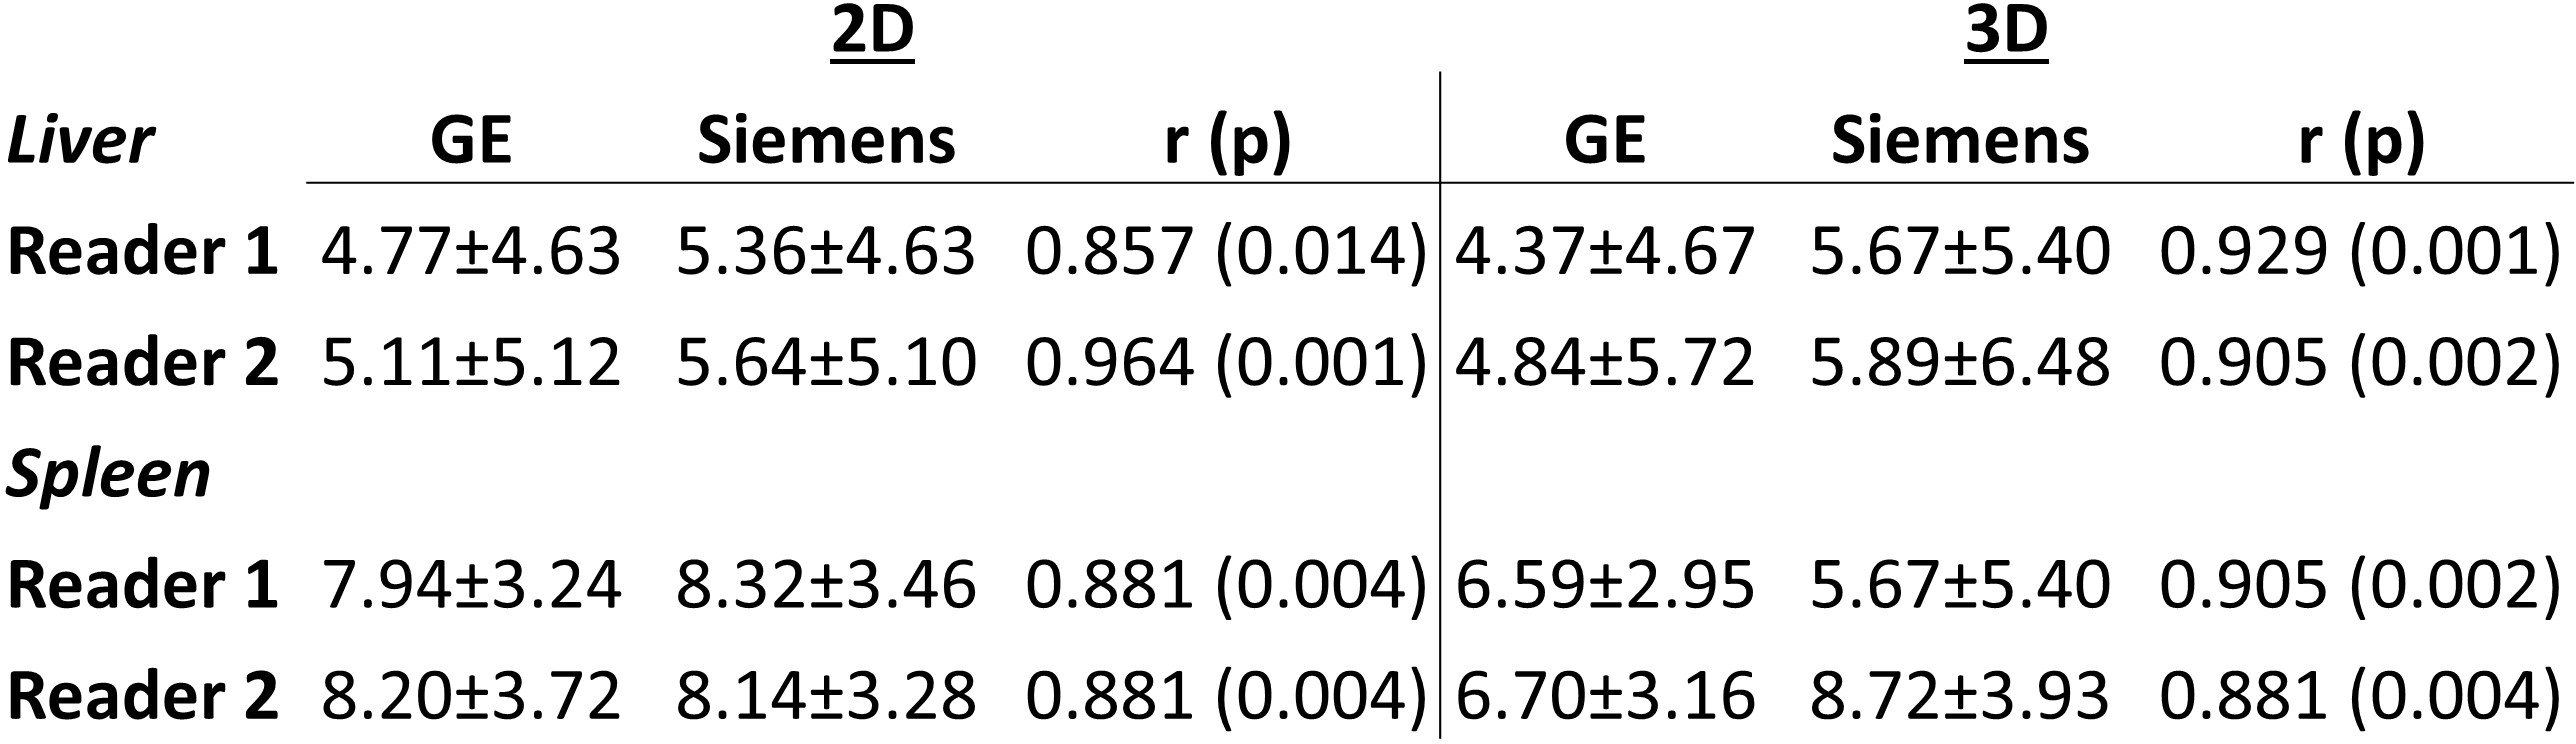
Table 2: 2D
and 3D MRE measurement from both readers in liver and spleen. Spearman
correlation coefficients and p values from sequence comparison across platforms
are also included.
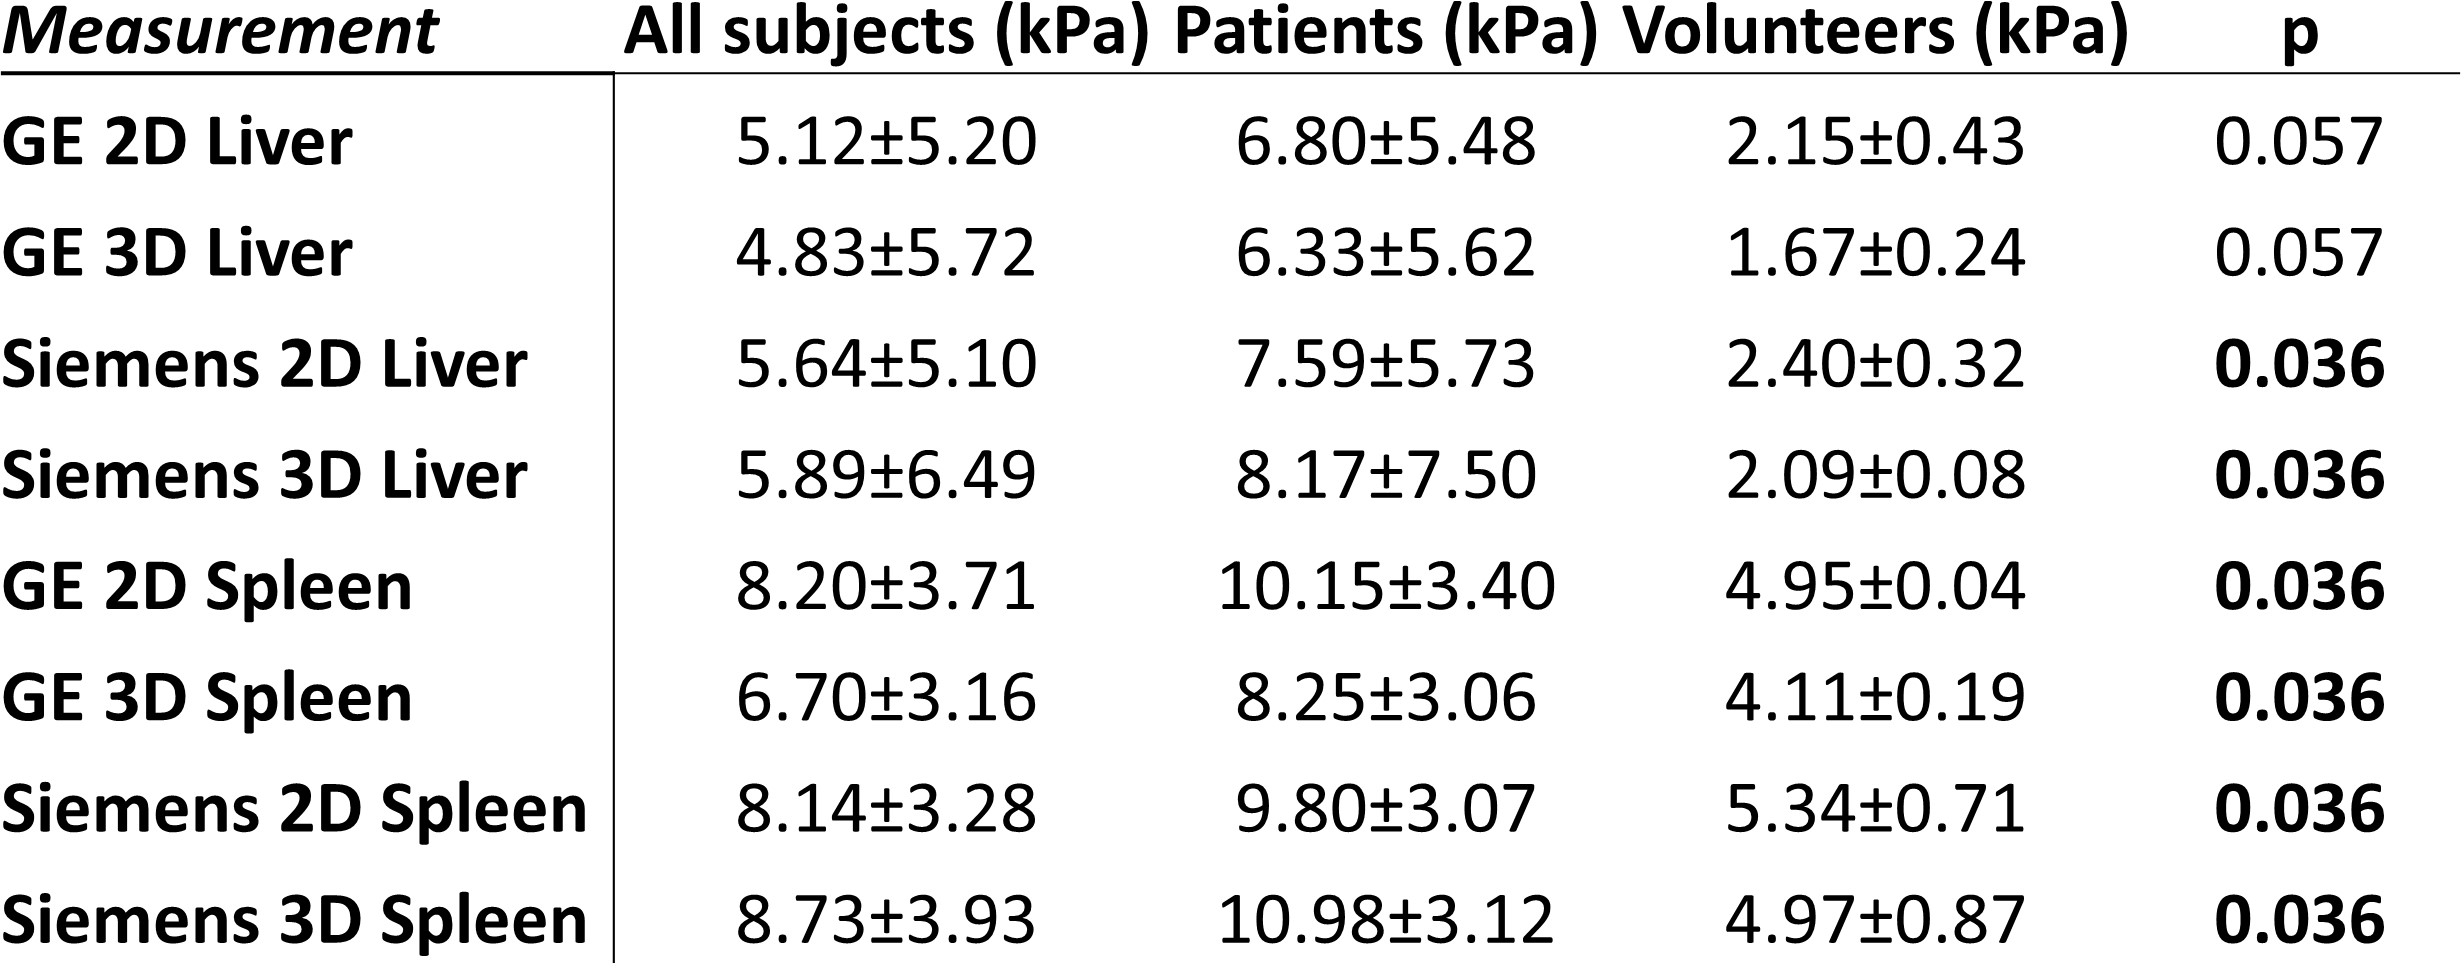
Table 3: Single
reader measures of 2D and 3D MRE measures in liver and spleen in all subjects,
patients only and volunteers only. Mann-Whitney U-test p-values are shown
depicting significance of differences between volunteer and patient groups.