3312
Improving the SNR and Correcting the Bias in Elastograms in Helmholtz Inversion for MR Elastography1Department of Electrical and Electronics Engineering, Bilkent University, Ankara, Turkey, 2National Magnetic Resonance Research Center (UMRAM), Ankara, Turkey
Synopsis
In Helmholtz inversion an equation is obtained for each MR elastography displacement data collected for each motion direction and each excitation frequency. Under high SNR, SNR of the estimated elasticity map by the Helmholtz inversion can be derived. Prior to the inversion, each equation can be weighted by the SNR of the elasticity estimate to improve SNR of the elastogram and low SNR ones can be thresholded to reduce bias in the elasticity estimation. Simulation and experiment results demonstrate that the original inversion underestimates the elasticity when there is noise and this bias can be corrected by the proposed reconstruction.
Introduction
In MR elastography (MRE), 3D Helmholtz inversion1,2 is widely used for elasticity reconstruction, which is also applicable to multifrequency MRE (MMRE)3. Noise in the collected MRE data may cause bias in the estimation of elasticity. Prior to the inversion, using weighted-least-squares (WLS) with the SNR estimate of each complex shear moduli using SNR thresholding, may improve the SNR and reduce the bias in the SNR of the elastogram.Theory
The primary noise on the complex MRI signal can modelled as additive white Gaussian noise (AWGN). Using high SNR assumption, the standard deviation of the noise on the phase is equal to SNR of the MRI signal (i.e., image SNR) and noise distribution of the complex shear modulus G*(r) can be derived analytically for Helmholtz inversion, similar to the analysis conducted for k-MDEV4. For each motion direction and excitation frequency, an equation is obtained using Helmholtz equation. Each equation represents a row in $$$Δu(r,w) G^*(r)=-ρw^2u(r,w)$$$, where we solve for G*(r). Each equation is weighted by its $$${SNR}^2$$$ using WLS method to improve SNR of the inversion. If the SNR value cannot meet the minimum SNR threshold required for the high SNR assumption in the analytical derivations, then that equation (i.e., row) is simply deleted, hence not involved in the inversion. The thresholding reduces the bias in the elasticity inversion.Methods
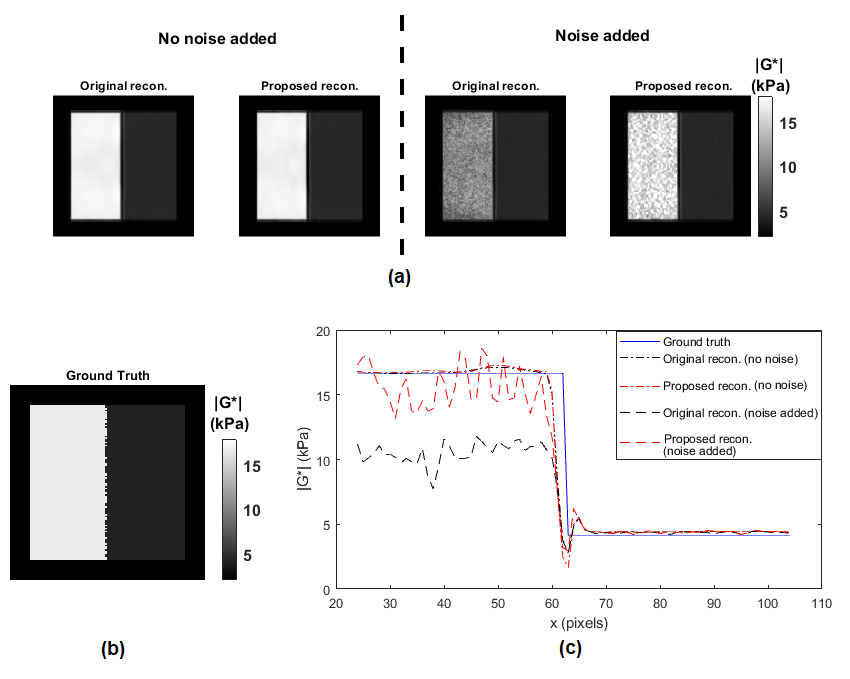
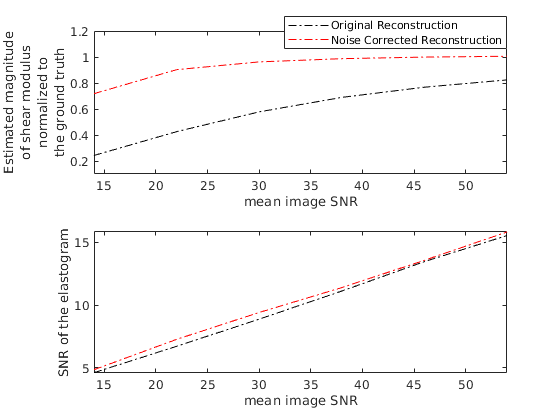
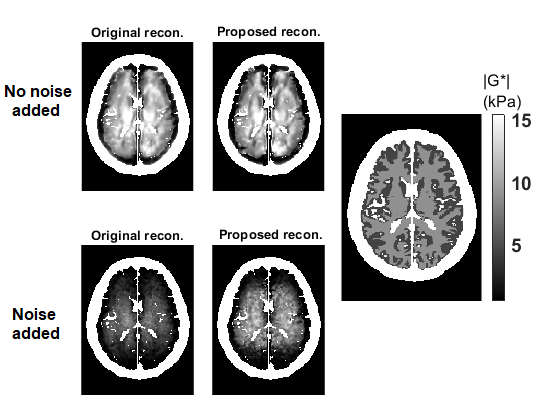
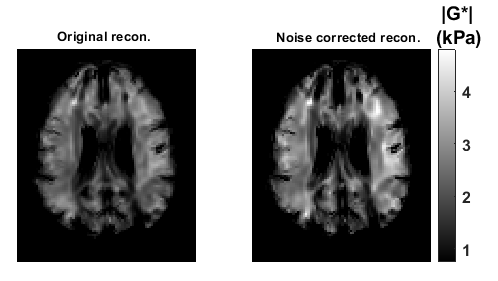
To verify SNR approximations, Monte Carlo simulations (MCS) were performed on a simulated plane wave data by adding AWGN with SNR swept from 1 to 30 by 0.5 increments. The minimum SNR required for the high SNR assumption used in the derivations was determined by comparing MCS results with the analytical approximations. MMRE simulations were conducted on a phantom with two homogeneous mediums. Elasticity maps were generated using the original Helmholtz inversion and the proposed inversion for both no-noise and noise added cases. Then, the SNR performance of the proposed inversion was assessed by adding AWGN for each SNR level, and then by computing the elasticity map and its SNR by MCS. Furthermore, a 3D brain model consisting of scalp, skull, falx cerebri, cerebrospinal fluid, gray matter and white matter, developed from the segmented brain images5,6 of a healthy human, was imported to COMSOL Multiphysics (COMSOL, Stockholm, Sweden). Young’s modulus, Poisson’s ratio, density and damping parameters were assigned to the model. MMRE brain simulation data were collected by performing frequency domain analysis on the model, by rotationally vibrating the head about the y-axis, similar to the excitation of a bite actuator. The excitation frequency was swept from 24 to 60 Hz with 4 Hz increments. Furthermore, elasticity inversions for an in-vivo MMRE brain data7, comprising excitation frequencies from 20 to 60 Hz with 5 Hz increments, were obtained for both reconstructions.Results
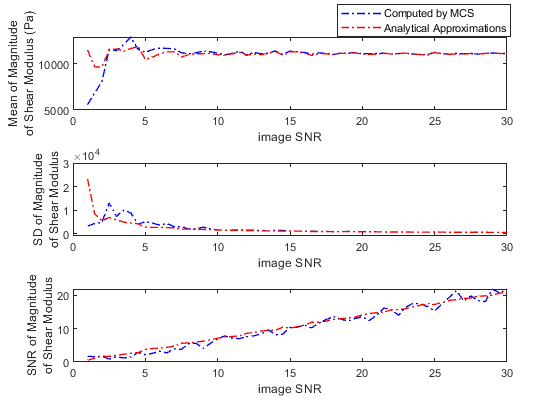
Validation of SNR analytical approximations using MCS is depicted in Figure 1, demonstrating mean, standard deviation and SNR of the magnitude of the complex shear modulus |G*|. The minimum image SNR value that analytical approximations hold is determined as 10. Elasticity maps for the simulation phantom with two homogeneous mediums are given in Figure 2. SNR performance of the inversions are demonstrated in Figure 3, depicting estimated magnitude of shear moduli normalized with respect to the ground truth and their SNR. Inversion results for simulated 3D brain MRE data for no-noise and noise added cases are shown in Figure 4. In-vivo brain elastograms are given in Figure 5.Discussion
Analytical approximations for SNR of the complex shear modulus have been validated by MCS and the SNR threshold required for the approximations to hold has been determined (Figure 1). Inversion results for the simulation phantom given in Figure 2 demonstrates that elasticity is underestimated in the stiff region by approximately 35% due to noise when the original Helmholtz inversion is used. Fortunately, this bias can be corrected by the proposed reconstruction, as seen in Figure 2. Underestimation of shear modulus by the original Helmholtz inversion for different SNR levels is observed in Figure 3. For the proposed inversion, bias is 10% for SNR=25 and there is almost no bias when SNR is 30, whereas for the original inversion underestimation is 50% when SNR is 30. As observed in Figure 3, there is a slight improvement in SNR of the elastograms for the proposed reconstruction. In Figure 4, it can be seen that for noisy data, the original reconstruction underestimates the complex shear modulus, whereas underestimation is less for the proposed inversion. Comparing reconstructed elasticity maps with the ground truth for the no-noise case, one can conclude that the Helmholtz inversion is not exactly accurate and has resolution problems with low reconstruction SNR gain. Consistent with the simulation results, the estimate of the complex shear modulus map has increased when the proposed noise corrected inversion is used compared to the original inversion, as given in Figure 5.Conclusion
The Helmholtz inversion is one of the most common inversion techniques used among MRE research groups. The bias in the estimation of the elasticity, caused by noise in the data, is significantly reduced when thresholded SNR estimates of elasticities were included in the inversion using WLS method.Acknowledgements
No acknowledgement found.References
1. Oliphant TE, Manduca A, Ehman RL, Greenleaf JF. Complex‐valued stiffness reconstruction for magnetic resonance elastography by algebraic inversion of the differential equation. Magnetic Resonance in Medicine: An Official Journal of the International Society for Magnetic Resonance in Medicine. 2001 Feb;45(2):299-310.
2. Papazoglou S, Hamhaber U, Braun J, Sack I. Algebraic Helmholtz inversion in planar magnetic resonance elastography. Physics in Medicine & Biology. 2008 May 21;53(12):3147.
3. Papazoglou S, Hirsch S, Braun J, Sack I. Multifrequency inversion in magnetic resonance elastography. Phys Med Biol 2012;57:2329–2346.
4. Ariyurek C, Tasdelen B, Sadeghi-Tarakameh A, Ider YZ, Atalar E. Analysis and Maximization of SNR in MR Elastography Inversion. 27th Annual Meeting of ISMRM, Montréal, QC, Canada, 2019. p. 3962.
5. Aubert-Broche B, Evans AC, Collins L. A new improved version of the realistic digital brain phantom. NeuroImage. 2006 Aug 1;32(1):138-45.
6. “Brainweb: Simulated brain database, [online]. available: http://brainweb.bic.mni.mcgill.ca/brainweb/.”
7. Charite Universitatsmedizin Berlin, Germany. In-vivo Brain Data. https://bioqic-apps.charite.de/downloads Accessed September, 2018
Figures