3311
Dynamic MR elastography using MR magnitude images1Radiological Sciences, Tokyo Metropolitan University, Tokyo, Japan, 2National Institute of Advanced Industrial Science and Technology (AIST), Tsukuba, Japan, 3Tokyo Metropolitan University, Tokyo, Japan, 4Keio University Hospital, Tokyo, Japan, 5Tokyo Denki University, Tokyo, Japan
Synopsis
We developed a new technique for dynamic MR elastography (MRE) using a MR magnitude image. A general MRE uses a MR phase image as a wave image. Proposed technique was used a MR magnitude image instead of MR phase image as a wave image by using a special vibration. Proposed technique (special vibration MRE) performance was comparable to that of a continuous vibration MRE. Since special vibration MRE need an only few second vibration, it could dramatically eliminated the patients' vibration-related discomfort.
INTRODUCTION
Magnetic resonance elastography (MRE) is a non-invasive technique for measuring the mechanical properties of soft tissues. Assuming that biologic tissues are homogeneous, isotropic and linearly elastic, μ is calculated as follows: μ=ρλ2f2 where λ is the wavelength of shear wave (m), f is the frequency of the shear wave (Hz) and ρ is the soft tissue density (assumed to be 1000 kg/m3). Since the frequency and the density were already known, if the wavelength is imaged, the shear modulus can be calculated. For general MRE, continuous harmonic mechanical excitation is applied to the tissue. In order to detect the propagating shear wave in the tissue, a motion encoding gradient is used to encode the shear wave information onto the MR phase image (wave image). When the accumulated MR phase sifts are out of the [-π, π] range, the true phase values will be wrapped back to this range, creating discontinuities in the MR phase image and subsequently in the estimated motion. Thus the phase needs to be unwrapped before the motion can be estimated accurately. However, the out of the range of [-π, π] is also caused by significantly different magnetic susceptibility. If the MR phase shifts and the significantly different magnetic susceptibility region are overlapped, there is a possibility that an error occurs in the phase unwrapping process. Against this background, we developed a novel MRE technique which used only MR magnitude images instead MR phase images. The MR magnitude image MRE (MI-MRE) was used a special vibration technique instead a continuous vibration. This study shows how the observed pattern of MR magnitude signal variations in MI-MRE related to the underlying shear wave motion, and how these variations can be effected by the special vibrations.METHODS
Our previous study reported a new method for MRE using the GRE-MultiEcho-MRE sequence without motion encoding gradient (MEG)1. The GRE-MultiEcho-MRE uses a series of echoes acquired as a train following after a single excitation pulse. The multiple symmetrical gradient-echoes in the GRE-MultiEcho-MRE are acquired by symmetrical bipolar readout gradient (GR). This GR has a function comparable to MEG (MEG-like effect). In the all MRE, the vibration power was giving continuous throughout the whole acquisition. For a new attempt, we changed the vibration of the GRE-MultiEcho-MRE from continuous to the special vibration (Fig.1). Specifically, arbitrary Gaussian distributions of vibration power were formed on half an acquisition time. Interestingly, it was observed that the propagating wave pattern was visualized on MR magnitude image. Glaser et al. (2003) reported a phenomenon that the propagating wave pattern was visualized on MR magnitude image as intravoxel phase dispersion (IVPD)2. We found the phenomenon by using the special vibration was an entirely different from IVPD. All MRE experiments were performed on a clinical MR imager (Achieva 3.0 T, Philips) using a flex-M coil (gel-phantom) and a torso coil (volunteer lower back). A self-made waveform generation system (LabVIEW, USB-6221, National Instruments) was used to generate the vibration waveform. This system is capable of generating sinusoidal waveforms with arbitrary frequencies and phases. For the special vibration, the waveform generation system can control arbitrary Gaussian distributions of output voltage at during acquisition. Power amplifier (XTi 1000, Crown) and a pneumatic pressure generator (Subwoofer TIT320C-4 12”, Dayton Audio) units were used to supply vibrations to a vibration pad. The vibration pad was designed using a three-dimensional printer (3D touch; 3D system) in order to adapt to the gel-phantom and the lower back region. The GRE-MultiEcho-MRE sequence parameters were TR, 40ms; 1st TE, 2.2ms; dTE, 3.3ms@150Hz, 5ms@100Hz, 10ms@50Hz; flip angle, 20degree; scan matrix, 512×256; image matrix, 512×512; vibration frequency, 50, 100, 150Hz; vibration phase offset, 4; total acquisition time, 82s; MEG-like effect direction, L-R. All elastograms were produced by Local Frequency Estimate (LFE) algorithm freeware (MRE/Wave, MAYO CLINIC).RESULTS and DISCUSSION
Figure 2 shows the MI-MRE of gel-phantom by using 100 Hz vibration. In Fig.2a, continuous vibration, the shear wave information was visualized on MR phase image. Since the shear wave information was never visualized on MR magnitude image, the maximum power was well adjusted for prevent IVPD. In Fig.2b, special vibration, the shear wave information was visualized on both images. Since the maximum vibration power of special vibration (peak of Gaussian distribution) was set to the power of continuous vibration, the IVPD was prevented on this gel-phantom experiment. Figure 3 shows spatial frequency analyses of each vibration frequency and variation of special vibration. Figure 4 shows the difference between the k-space data of continuous vibration and the one of special vibration. When the vibration frequency increases, the wavelength is shortened, and high spatial frequency information is required. Since the gap of the difference domain of k-space (white arrow) was broadening dependent on vibration frequency, we considered that the difference domain of k-space (blue arrow) has key component of MI-MRE. Figure 5 shows the difference domain of k-space (blue arrow) and the width of special vibration (blue belt). In Amplitude Convex 05 had only convolved shear wave information in the low-spatial frequency domain, blue arrows and blue belt was not overlapped on 100, 150 Hz, the image contrast of MI-MRE decreased (Fig.3e).Acknowledgements
This work was supported by JSPS KAKENHI Grant NumberJP19K09579, Japan.References
- Numano T, Mizuhara K, Hata J, et al. A simple method for MR elastography: a gradient-echo type multi-echo sequence. Magn Reson Imaging 2015;33(1):31-7
- Glaser KJ, Felmlee JP, Manduca A, et al. Shear stiffness estimation using intravoxel phase dispersion in magnetic resonance elastography. Magn Reson Med. 2003 Dec;50(6):1256-65.
Figures
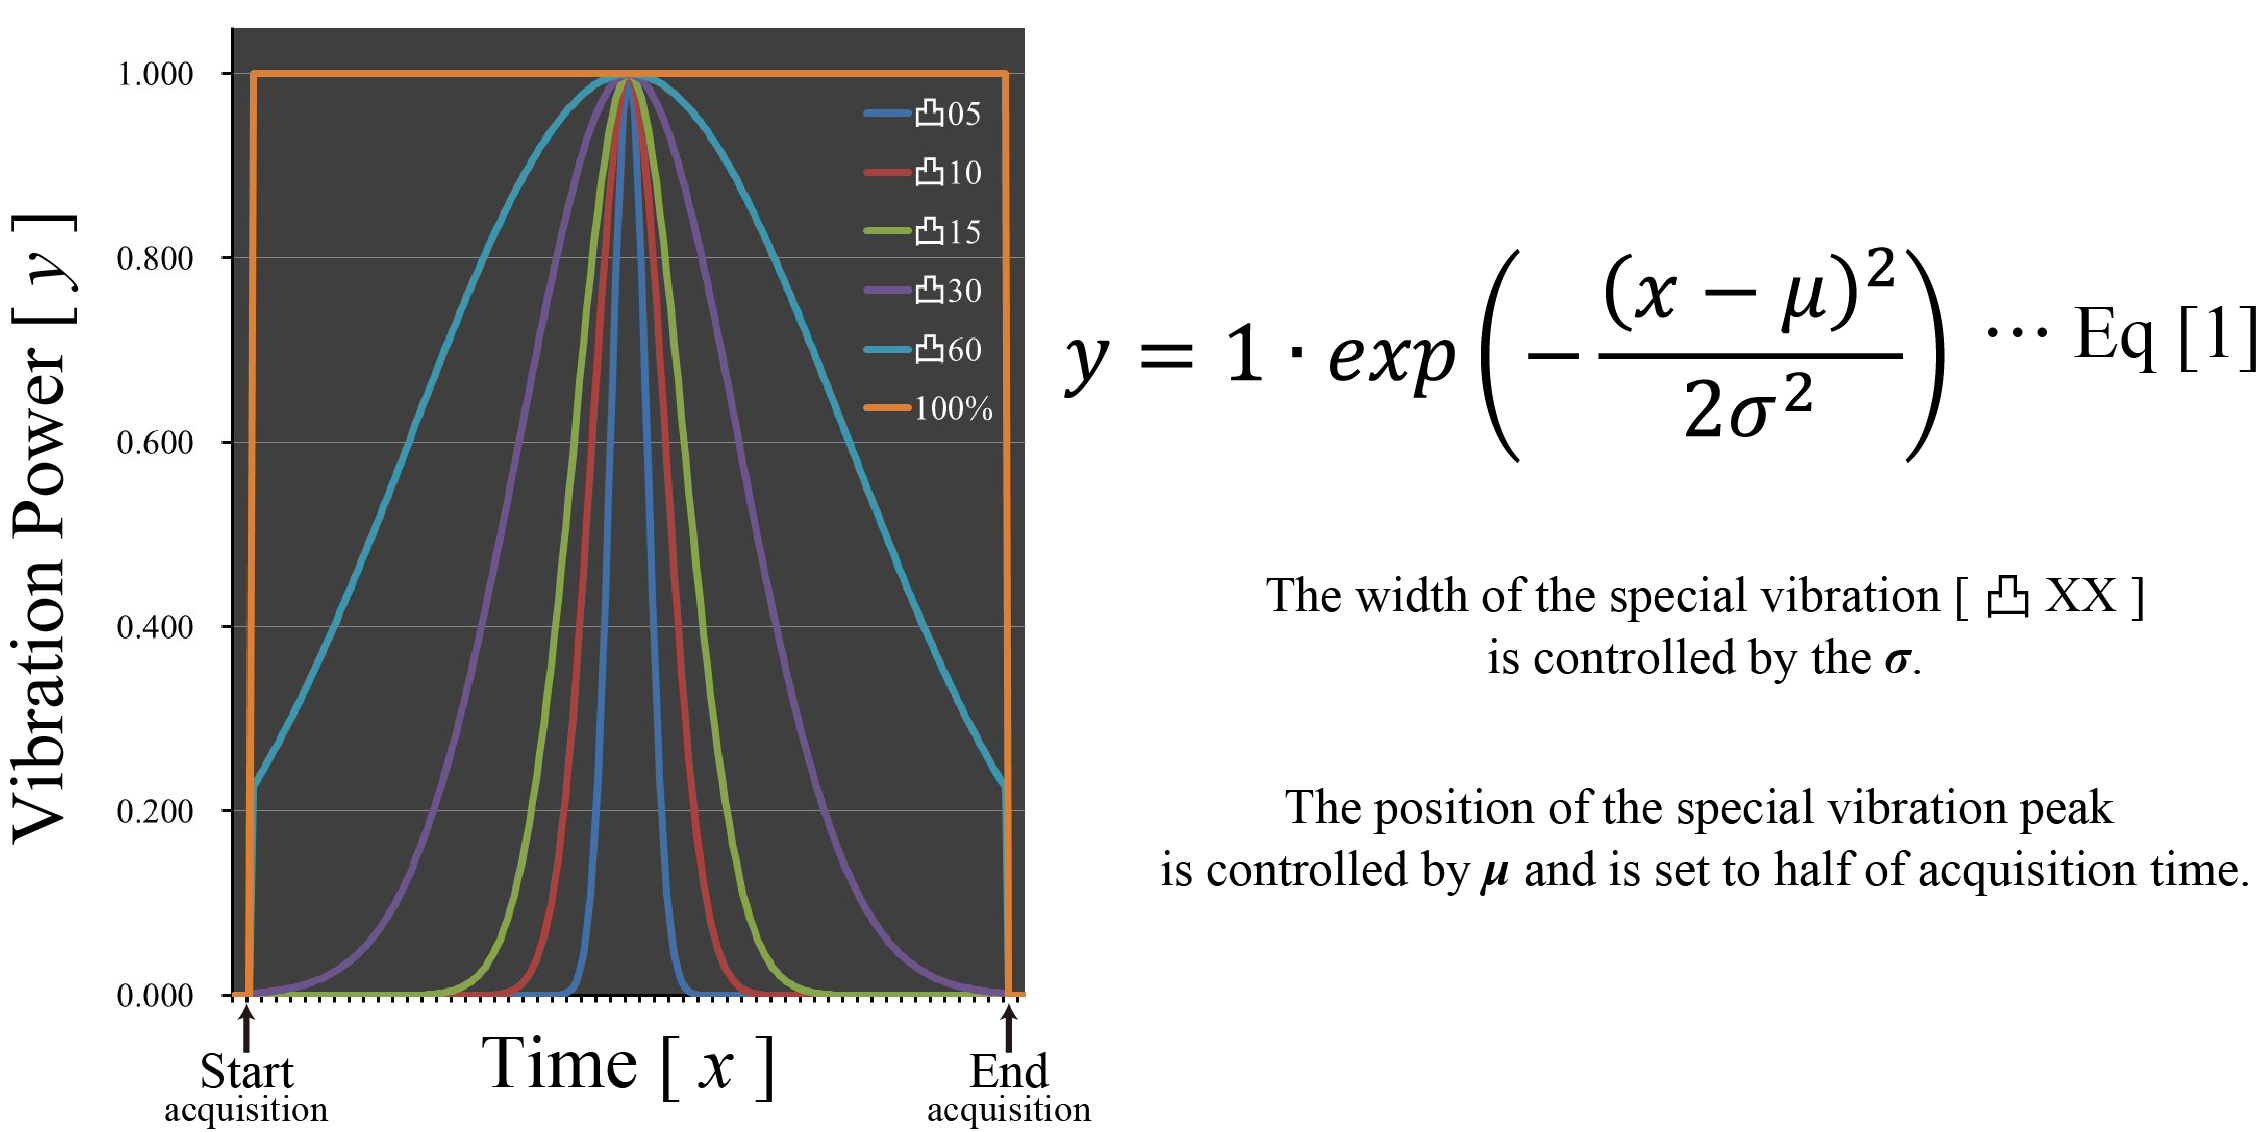
Variation of special vibration
In general MRE, the vibration power is constant at during image acquisition; orange color line (100%). Special vibration (time-dependent vibration power in Gaussian distribution) is used for a MR magnitude image MRE. The special vibration is generated by Eq [1]. The peak of the special vibration is set to half time of the acquisition time. The width of the special vibration is controlled by the σ in Eq [1].
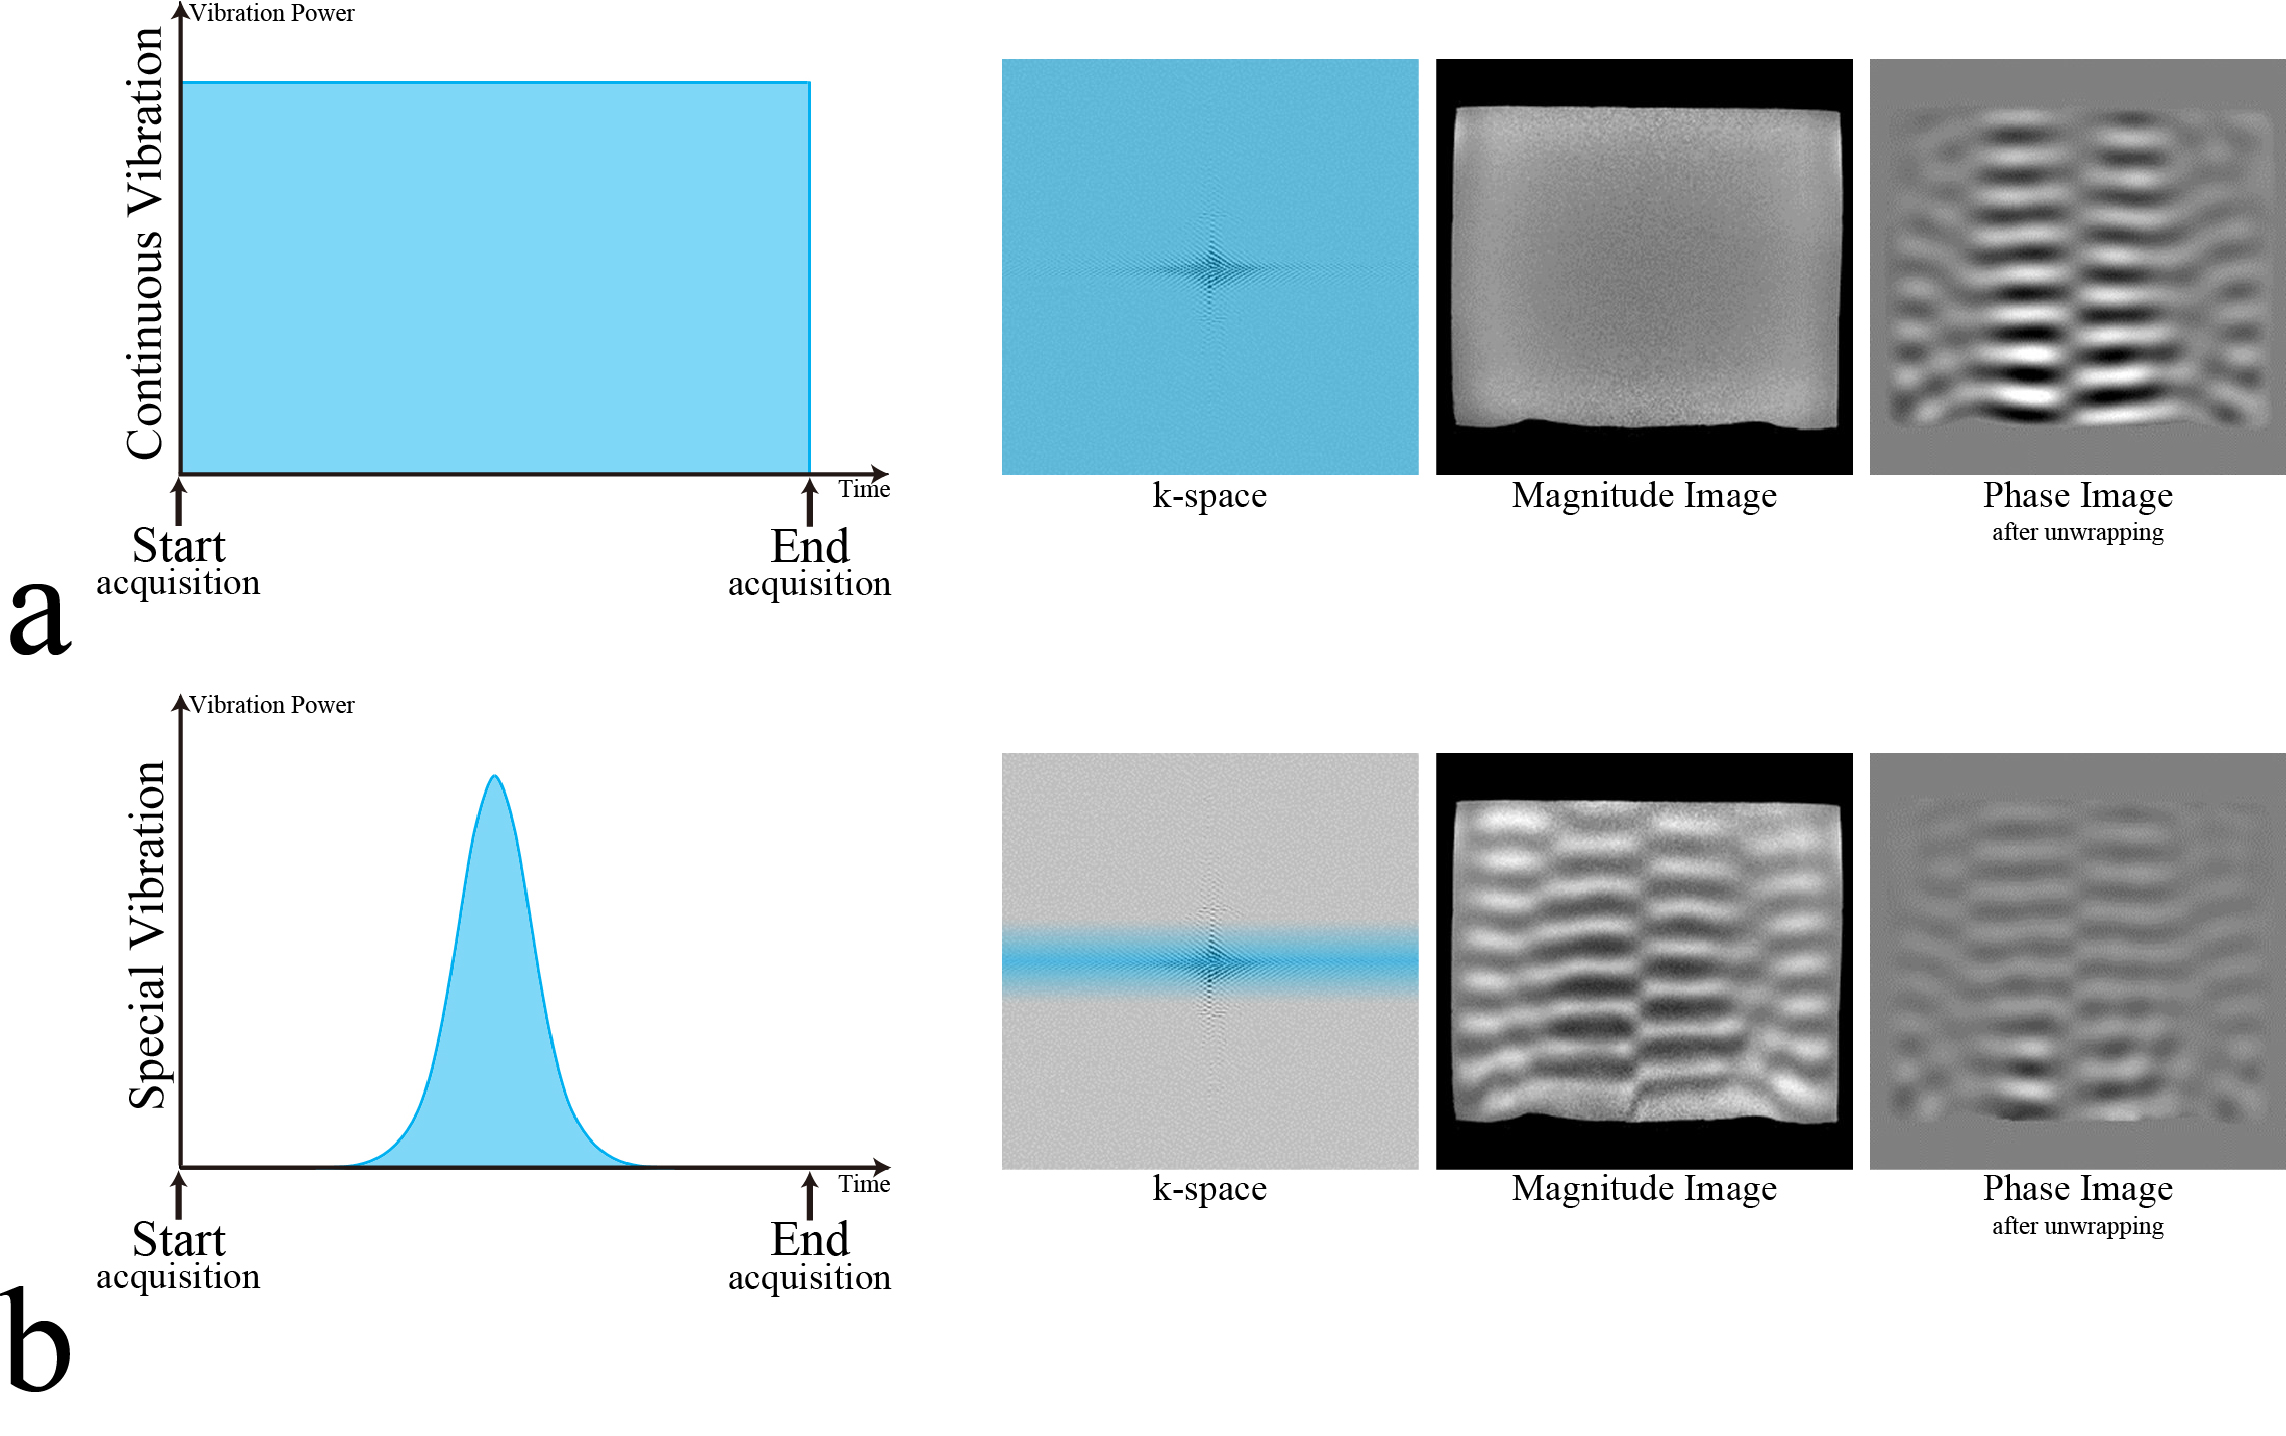
MR magnitude image MRE (MI-MRE)
a: The vibration effect of k-space in the continuous vibration is convolved in all spatial frequency domains as all area of k-space. The shear wave information was visualized on only MR phase image. b: The vibration effect of k-space in the special vibration is selectively convolved in only low-spatial frequency domain as only blue area of k-space. The shear wave information was visualized on both images. The shear wave information of phase image was low visibility compared with the one of continuous vibration.
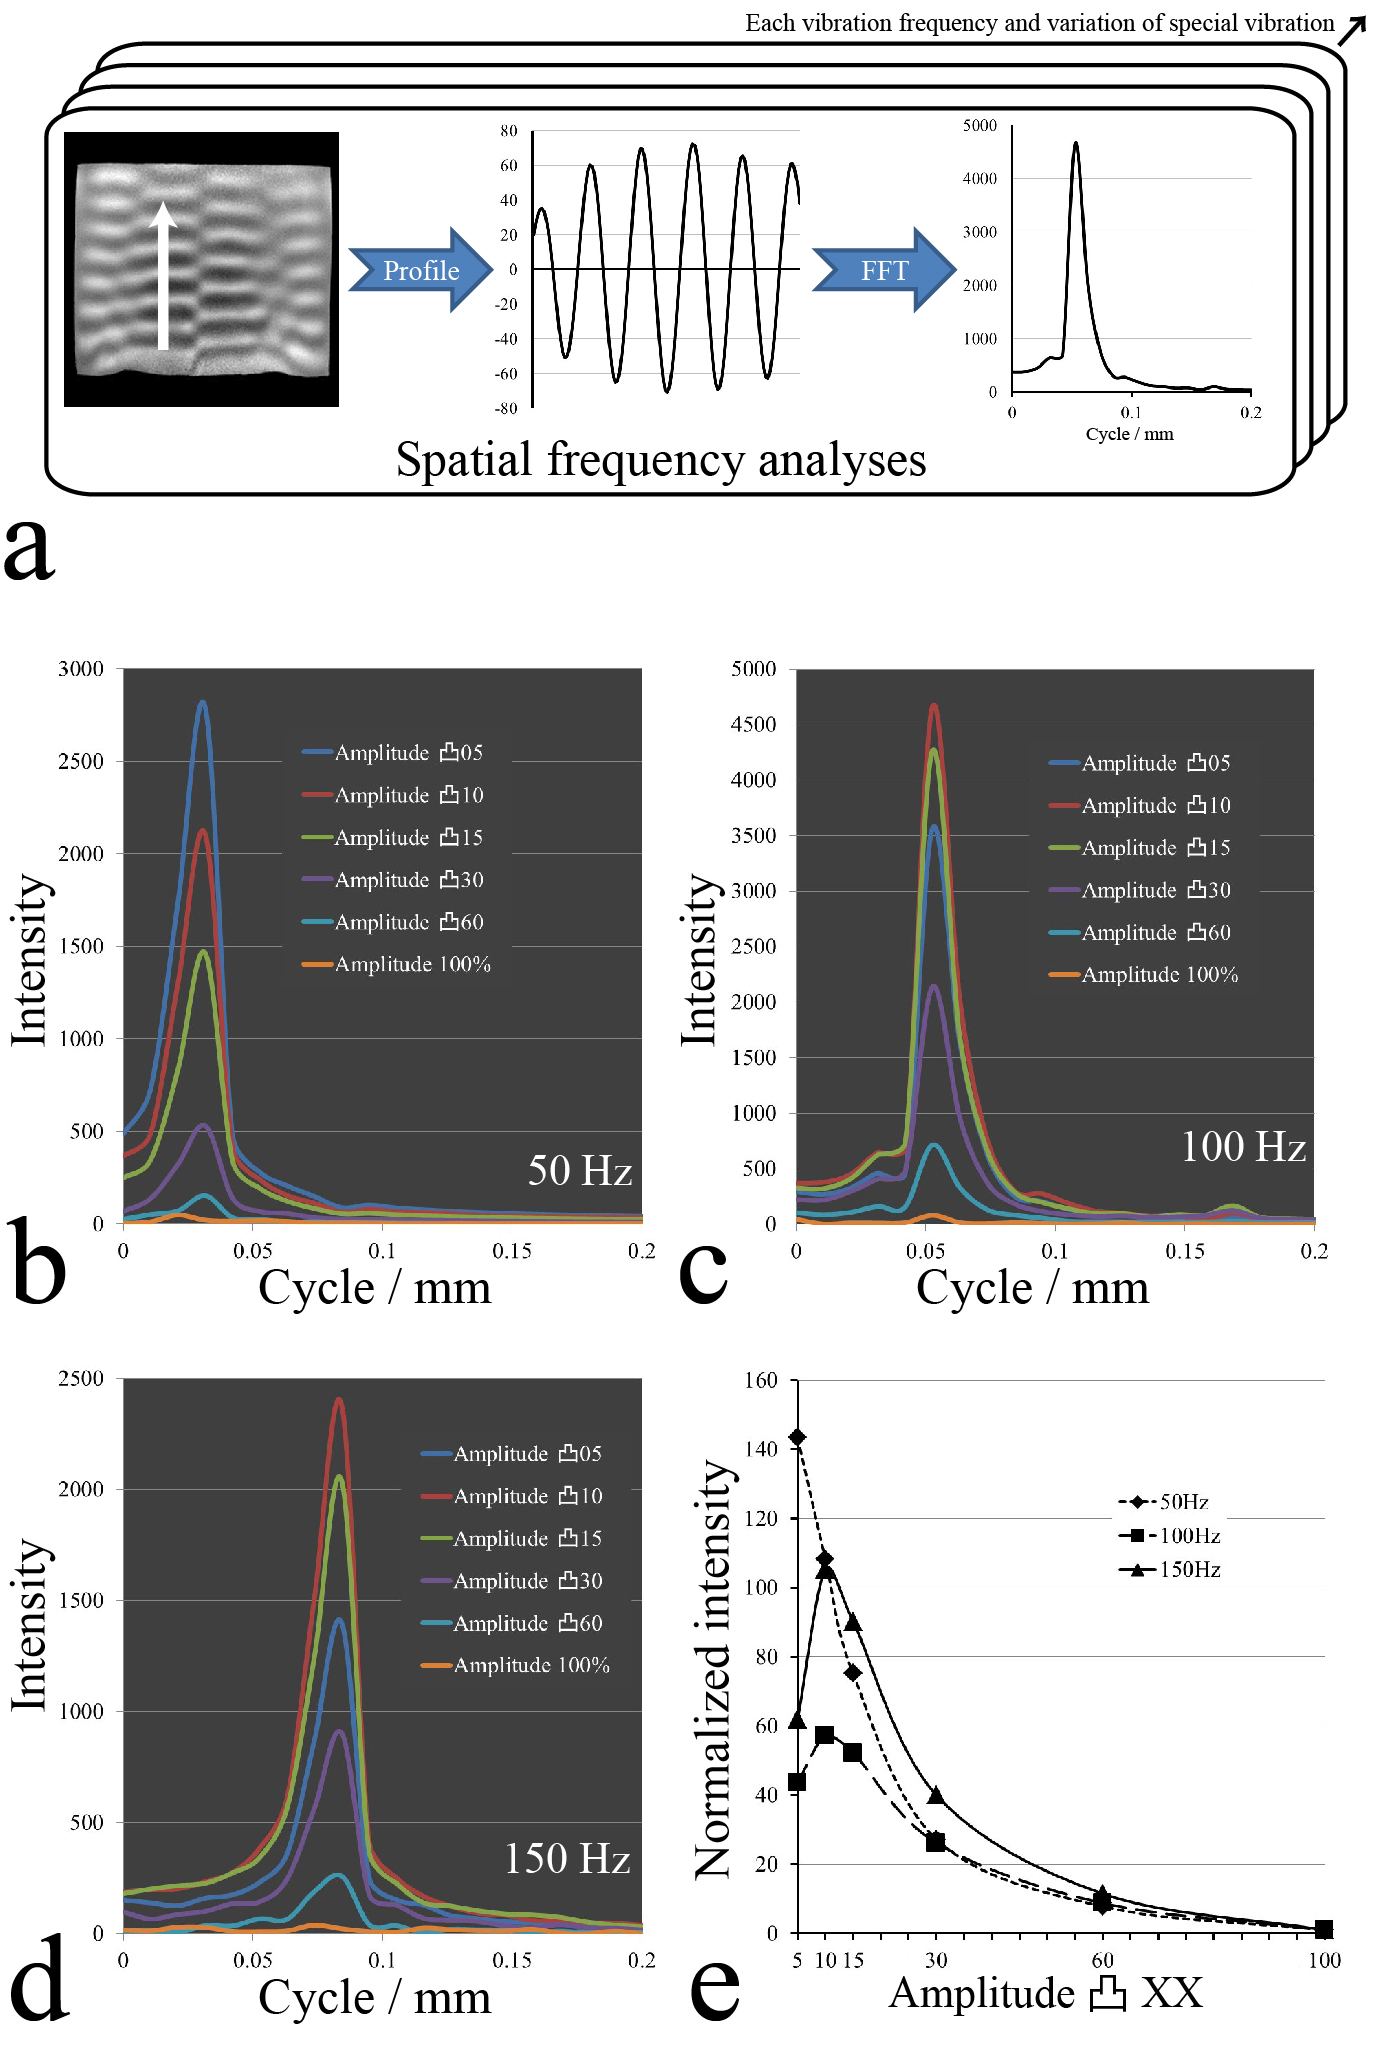
Spatial frequency analyses of special vibration
a: Process of spatial frequency analyses. This process was performed at each vibration frequency and special vibration. b,c,d: The results of each spatial frequency analyses were organized into charts of each vibration frequency. In each vibration frequency, the spatial frequency was the same, but the intensity changed. e: The normalized intensity of each spatial frequency analyses were organized into chart. Amplitude Convex 05 lack the high spatial frequency domain, which reduces the normalized intensity at 100 Hz and 150 Hz.
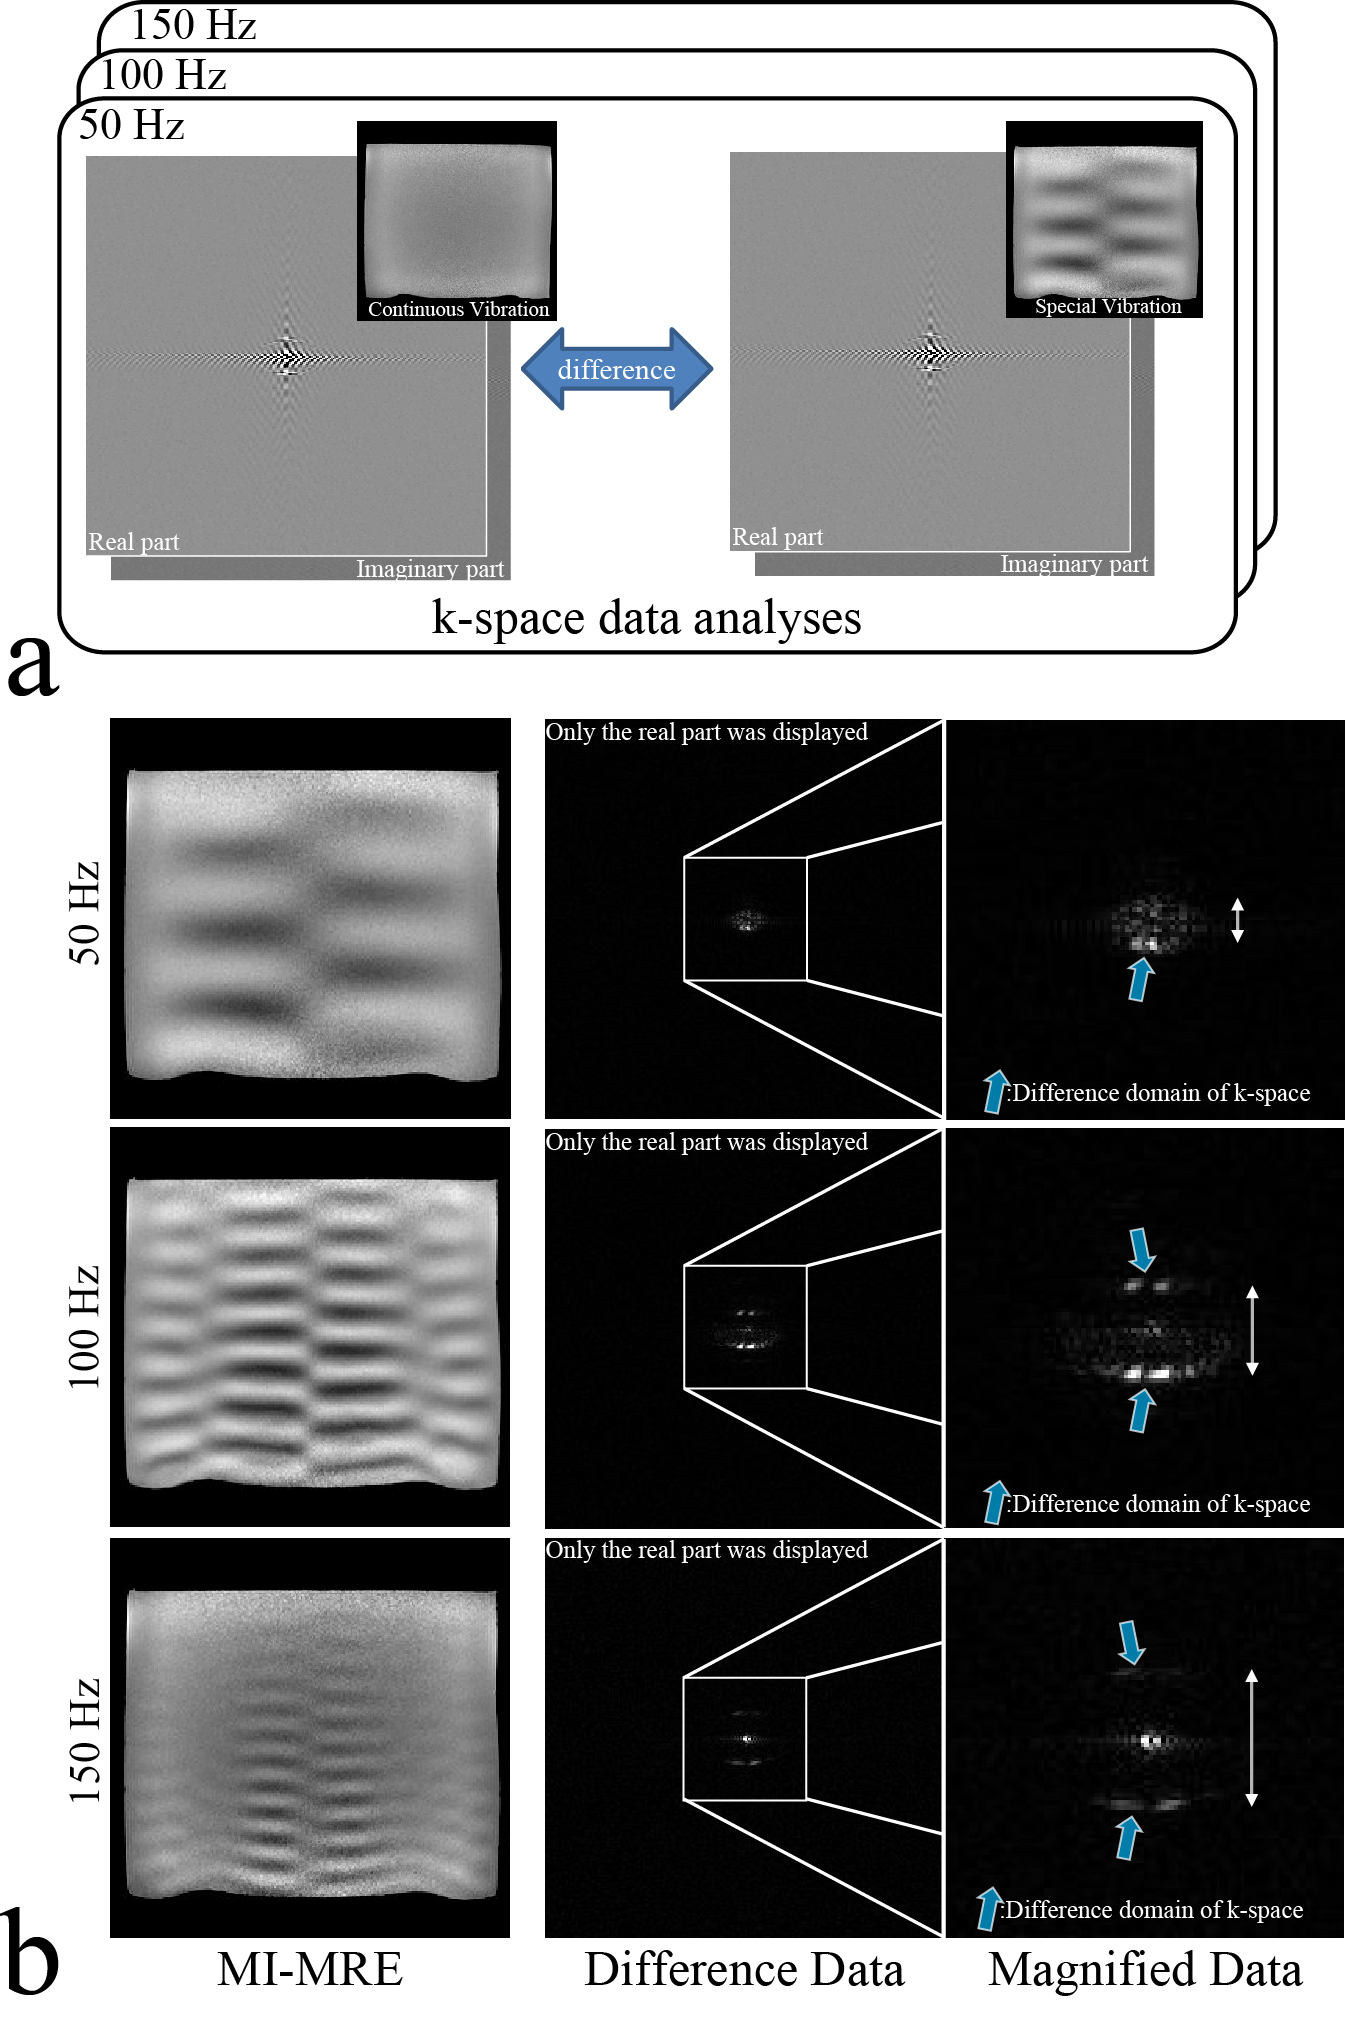
k-space data analyses of vibration frequency
a: Process of k-space data analyses. Get the difference between the k-space data of continuous vibration and the one of special vibration. b: The difference domain of k-space (blue arrow) was observed on origin symmetry of k-space. The gap of the difference domain of k-space (white arrow) was broadening dependent on vibration frequency (or wavelength).
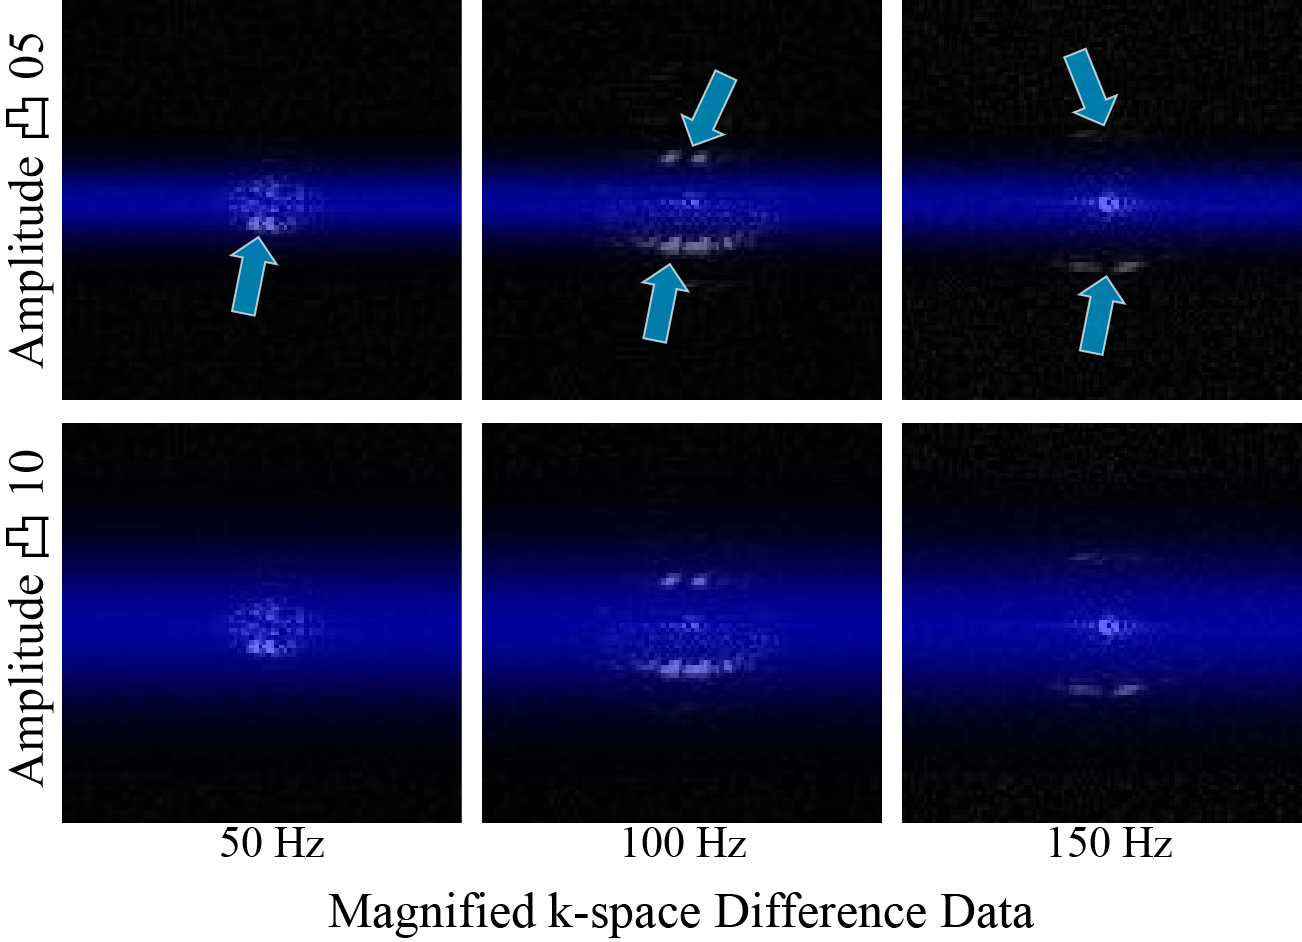
Difference domain of k-space and special vibration
For better view ability, these data was magnified at the center of k-space. The blue belt on k-space difference data were the width (duration and power) of special vibration. In Amplitude convex 05 and 50 Hz, the difference domain of k-space (blue arrow) and the blue belt was overlapped. In Amplitude convex 05 and 100 or 150 Hz, the blue arrow and the blue belt wasn’t overlapped.