3304
Velocity selective arterial spin labeling at 7Tesla: a comparison of the temporal bolus width with FAIR1University College London Hospital, London, United Kingdom, 2Leiden University Medical Center, Leiden, Netherlands
Synopsis
To the best of our knowledge this work is the first implementation of VSASL at 7T. The VSASL technique was compared with FAIR in 3 healthy volunteers. The temporal bolus width was sampled in each case and compared between the two ASL methods.
Introduction
Performing ASL at higher field strengths has the potential to increase perfusion weighted signal due to the intrinsic increase in SNR and T1-values. In practice, the implementation of ASL at higher field strengths is complicated by challenges such as limited coverage of the RF-transmit coil, increased B1 and B0 inhomogeneity and SAR constraints.1So far only the pulsed ASL technique “Flow-alternating-inversion-recovery” (FAIR) has been proven to provide robust and sufficient image quality at 7T.2 In this study we introduce at 7Tesla Velocity-selective arterial spin labeling (VSASL), a flow-based ASL-method that saturates the magnetization of blood flowing faster than the cut-off velocity Vc.3 In labeling efficiency FAIR will outperform VSASL by a factor of 2 (inversion vs saturation respectively), but we hypothesize that VSASL could provide a broader labeling width than FAIR, since VSASL also creates label within the imaging region. The aim of this study was to evaluate the width of the labeling bolus of VSASL and FAIR on 7T.
Methods
We scanned 3 healthy volunteers (age 21-28yo, 2f/1m) at 7T (Achieva, Philips, The Netherlands) using a 32-channel head-coil. All subjects provided written informed consent for this IRB-approved study.For VSASL, the labeling module parameters, which determine the velocity-sensitivity, were δ=1ms, Δ=46ms, G=3mT/m, corresponding to Vc=2.1cm/s. The time between the first labeling module and the readout was kept constant at 1600ms. FAIR labeling was implemented consisting of a time resolved frequency-offset-corrected-inversion (tr-FOCI) RF-pulse with 10mm larger coverage than the volume-of-interest. Pre- and post-saturation modules were included to saturate the imaging volume. Background suppression was performed at 1200 and 1830ms post labeling. The inversion time (TI) was kept constant at 2000ms. The readout module of both sequences consisted of a multi-slice, single-shot EPI (resolution:3×3X3mm, 13 slices).
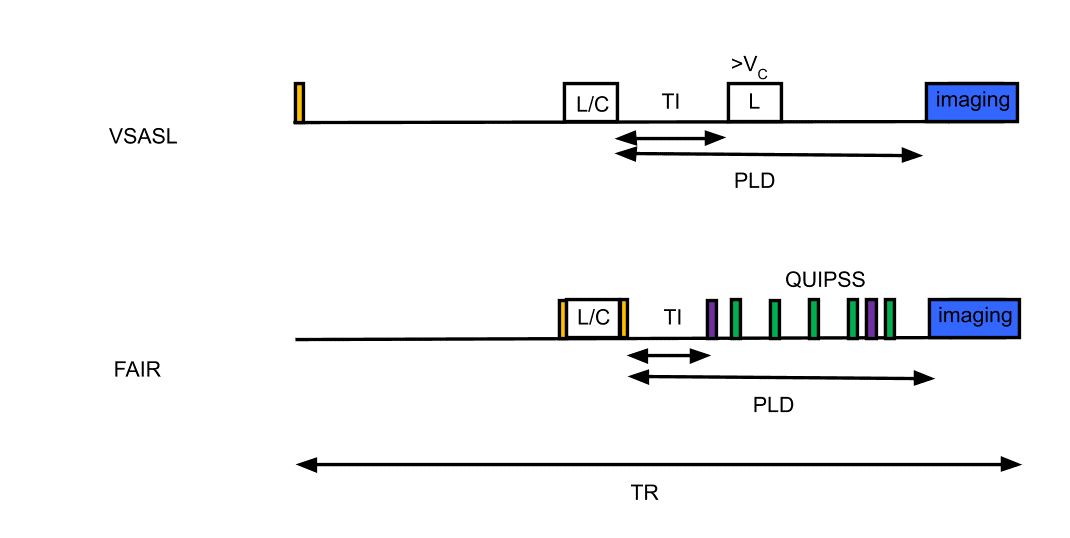
To measure the bolus width, a second VS-labeling module for VSASL was performed at 250, 500, 750, 1000, 1200, 1400, and 1600ms after the first. For FAIR similar inflow times were used as timing for the first of 5 equally spaced QUIPSS saturation pulses with a width of 60mm positioned 10mm below the imaging volume. Also, an additional FAIR-measurement without QUIPSS was performed. A schematic overview of the sequences is shown in figure 1.
Perfusion-weighted (PW)-maps were calculated as the average difference between the label and control images. The PW-map of FAIR without QUIPSS was thresholded to create a GM-mask, which was applied to all image series after excluding the top and bottom slice. The median signal over the remaining slices was calculated and normalised with respect to the value of the longest FAIR and VSASL inflow-timepoints. The median signal across individual slices was also calculated and normalised similarly.
Results
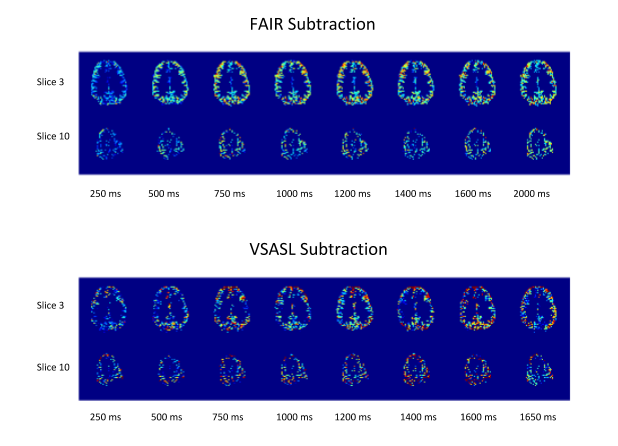
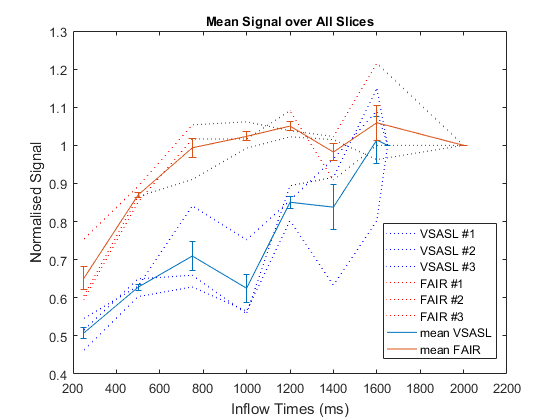
Figure 2 shows the acquired PW-maps for both FAIR and VSASL across all sampled inflow-timepoints in one volunteer. The FAIR PW-maps yielded higher SNR and were more robust to B1 inhomogeneity.Figure 3 shows the normalised average signal within the GM-mask for FAIR and VSASL over the sampled inflow-timepoints . The data suggests that the temporal bolus width of FAIR is smaller than that of VSASL however data quality makes it difficult to substantiate this observation.
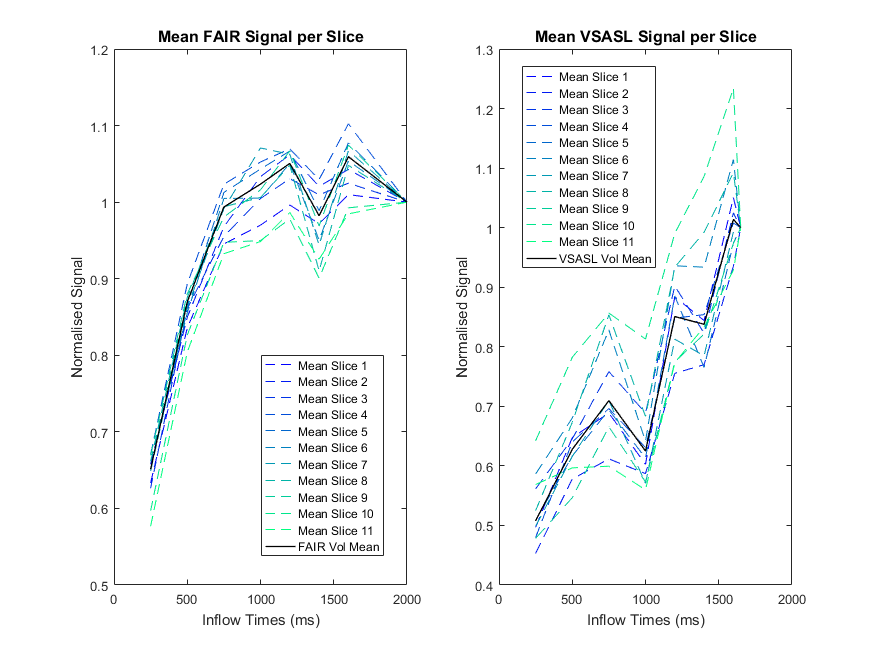
Figure 4 shows the normalised average signal over each slice for FAIR and VSASL. The FAIR signal is seen to be stable over the slices, whereas VSASL shows more variation particularly for the higher slices.
Discussion
Although the results presented here suggested that the proposed VSASL scheme produces a larger temporal bolus width than the FAIR labelling scheme, the image quality was less robust. Although increased temporal width should increase the portion of labeled blood, FAIR has the benefit of creating label by inversion and therefore generating a factor two higher SNR as compared to the saturation labeling of VSASL.Moreover, the FAIR PW-maps were more robust to artefacts created by B1 inhomogeneity, which is likely due to the tr-FOCI inversion pulse used. In the VSASL implementation, two hyperbolic secant pulses were used for refocusing, as previously described. However recent work has demonstrated improved B1 insensitivity by the use of BIR-4 and BIR-8 refocusing pulses.4 Moreover, Velocity selective inversion (VSI)5 has been recently proposed to increase the available perfusion signal at 3T. The implementation of these techniques could improve the SNR and image quality of VSASL images at 7T while retaining the advantages of a velocity-, rather than spatially-selective labeling technique.
The comparison of VSASL with the established FAIR technique has shown the temporal bolus width of FAIR to be relatively short (~700ms) suggesting inversion times could be further optimised.
Conclusion
To the best of our knowledge this is the first time that VSASL has been applied at 7T. The increased temporal bolus width compared with FAIR demonstrated here indicates that VSASL could be beneficial as a high field perfusion imaging technique. However further work is required to implement VSI on 7T, which will provide the benefit of a higher labeling efficiency compared to VSASL.Acknowledgements
No acknowledgement found.References
1. Ivanov D, Gardumi A, Haast R, et al. Comparison of 3 T and 7 T ASL techniques for concurrent functional perfusion and BOLD studies. Neuroimage. 2017;156(1):363-376.
2. Gardener A, Gowland P, Francis S. Implementation of quantitative perfusion imaging using pulsed arterial spin labeling at ultra‐high field. Magn Reson Med. 2009;61(4):874-82.
3. Wong E, Cronin M, Wu W, et al. . Velocity-selective arterial spin labeling. Magn Reson Med. 2006;55(6):1334-1341.
4. Meakin J, Jezzard P, et al. An optimised velocity selective arterial spin labeling module with reduced eddy current sensitivity for improved quantification. Magn Reson Med. 2013;69(3):832-8.
5. Qin Q, van Zijl P, Velocity-selective-inversion prepared arterial spin labeling. Magn Reson Med. 2016;76(4):1136-48.
Figures