3303
Comparison of Velocity-Selective Arterial Spin Labeling using multiple VS Saturation and FT-VS inversion – a Theoretical Study1Bioengineering, University of California, Riverside, Riverside, CA, United States, 2Biomedical Engineering, University of Michigan, Ann Arbor, MI, United States, 3Physics, University of California, Riverside, Riverside, CA, United States
Synopsis
Velocity selective ASL (VSASL) is the latest addition to the family of ASL techniques, with good promise on resolving transit delay sensitivity in ASL. Though an improvement in SNR efficiency has been reported by using two-module VS saturation and VS inversion pulse, the comparison between them is yet to be done. This study aims to compare their theoretical performance with Bloch simulation and a few realistic scenarios and look for knowledge about existing limitations which can, in turn, lead to further improvement of these techniques. Additionally, a few variants of VSI pulses including most recent improvement were explored and compared.
Introduction
Velocity Selective ASL1,2 is insensitive to transit delay (TD) compared to conventional ASL techniques. However, its relatively low labeling efficiency due to saturation instead of inversion has limited its use. Significant efforts that have been made to overcome this problem include the implementation of multiple velocity selective saturation (VSS) modules (mm-VSASL)2 and Fourier-transform based velocity-selective inversion (FT-VSI)3. Both methods report significant SNR improvement over original VSASL method using single VSS module. The purpose of this study is to investigate the performance of mm-VSASL and FT-VSI under various off-resonance (B0) and B1 conditions using Bloch simulation. A few variants of VSI pulses were also compared, including a new modified pulse.Methods
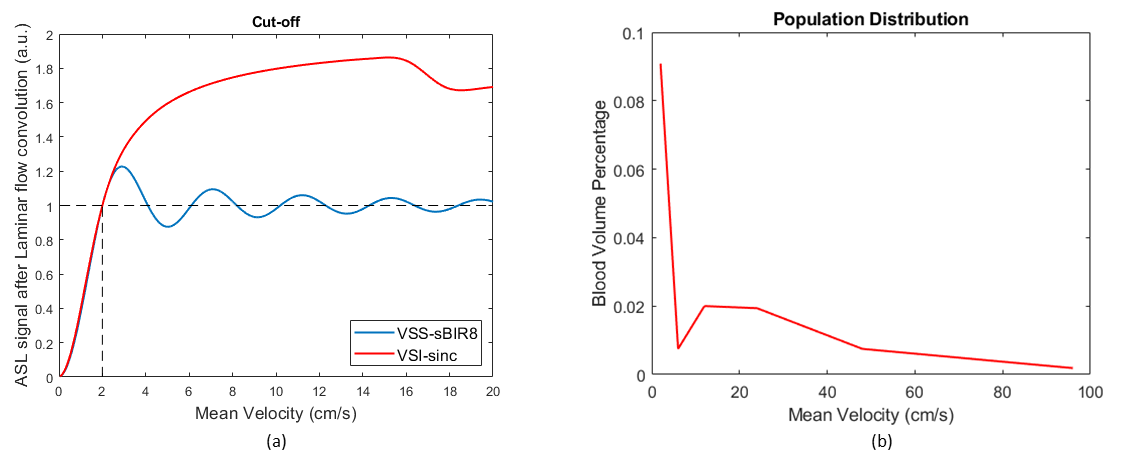
Definition of cutoff velocityIn order to have a meaningful definition of cutoff velocity that works for both the saturation- and inversion-based labeling methods, the ASL signal (label/control difference) was calculated and then convolved with a laminar flow pattern4 to give a SigASL-Vmean profile. Then following the definition in Wong et al1, the cutoff velocity was defined at the first crossing point where SigASL = 1 for both VSS and VSI modules (Figure 1a). The gradient amplitude for all the sequences were adjusted to have a cutoff velocity of 2 cm/s.
Weighting by a realistic arterial velocity/volume distribution
The SigASL-Vmean profile was then weighted with an arterial blood volume distribution measured in human brain over a big velocity range7 (Figure 1b) to calculate the total ASL signal and the signal per unit of time (SigASL,tot/√(2TR), or SNR efficiency). This was done for different values of B0 (from -200 Hz to 200 Hz with an interval of 50 Hz) and B1 (from 70% to 130% of the nominal B1 with an interval of 10%). The obtained results were then weighted by a 2D gaussian distribution (σB0 = 200 Hz, σB1 = 0.3, µB0 = 0, µB1 = 1, ρ = 0) to calculate the mean signal and signal per unit time. The standard deviation (SD) was calculated without weighting.
Bloch simulation with B0 and B1 variation
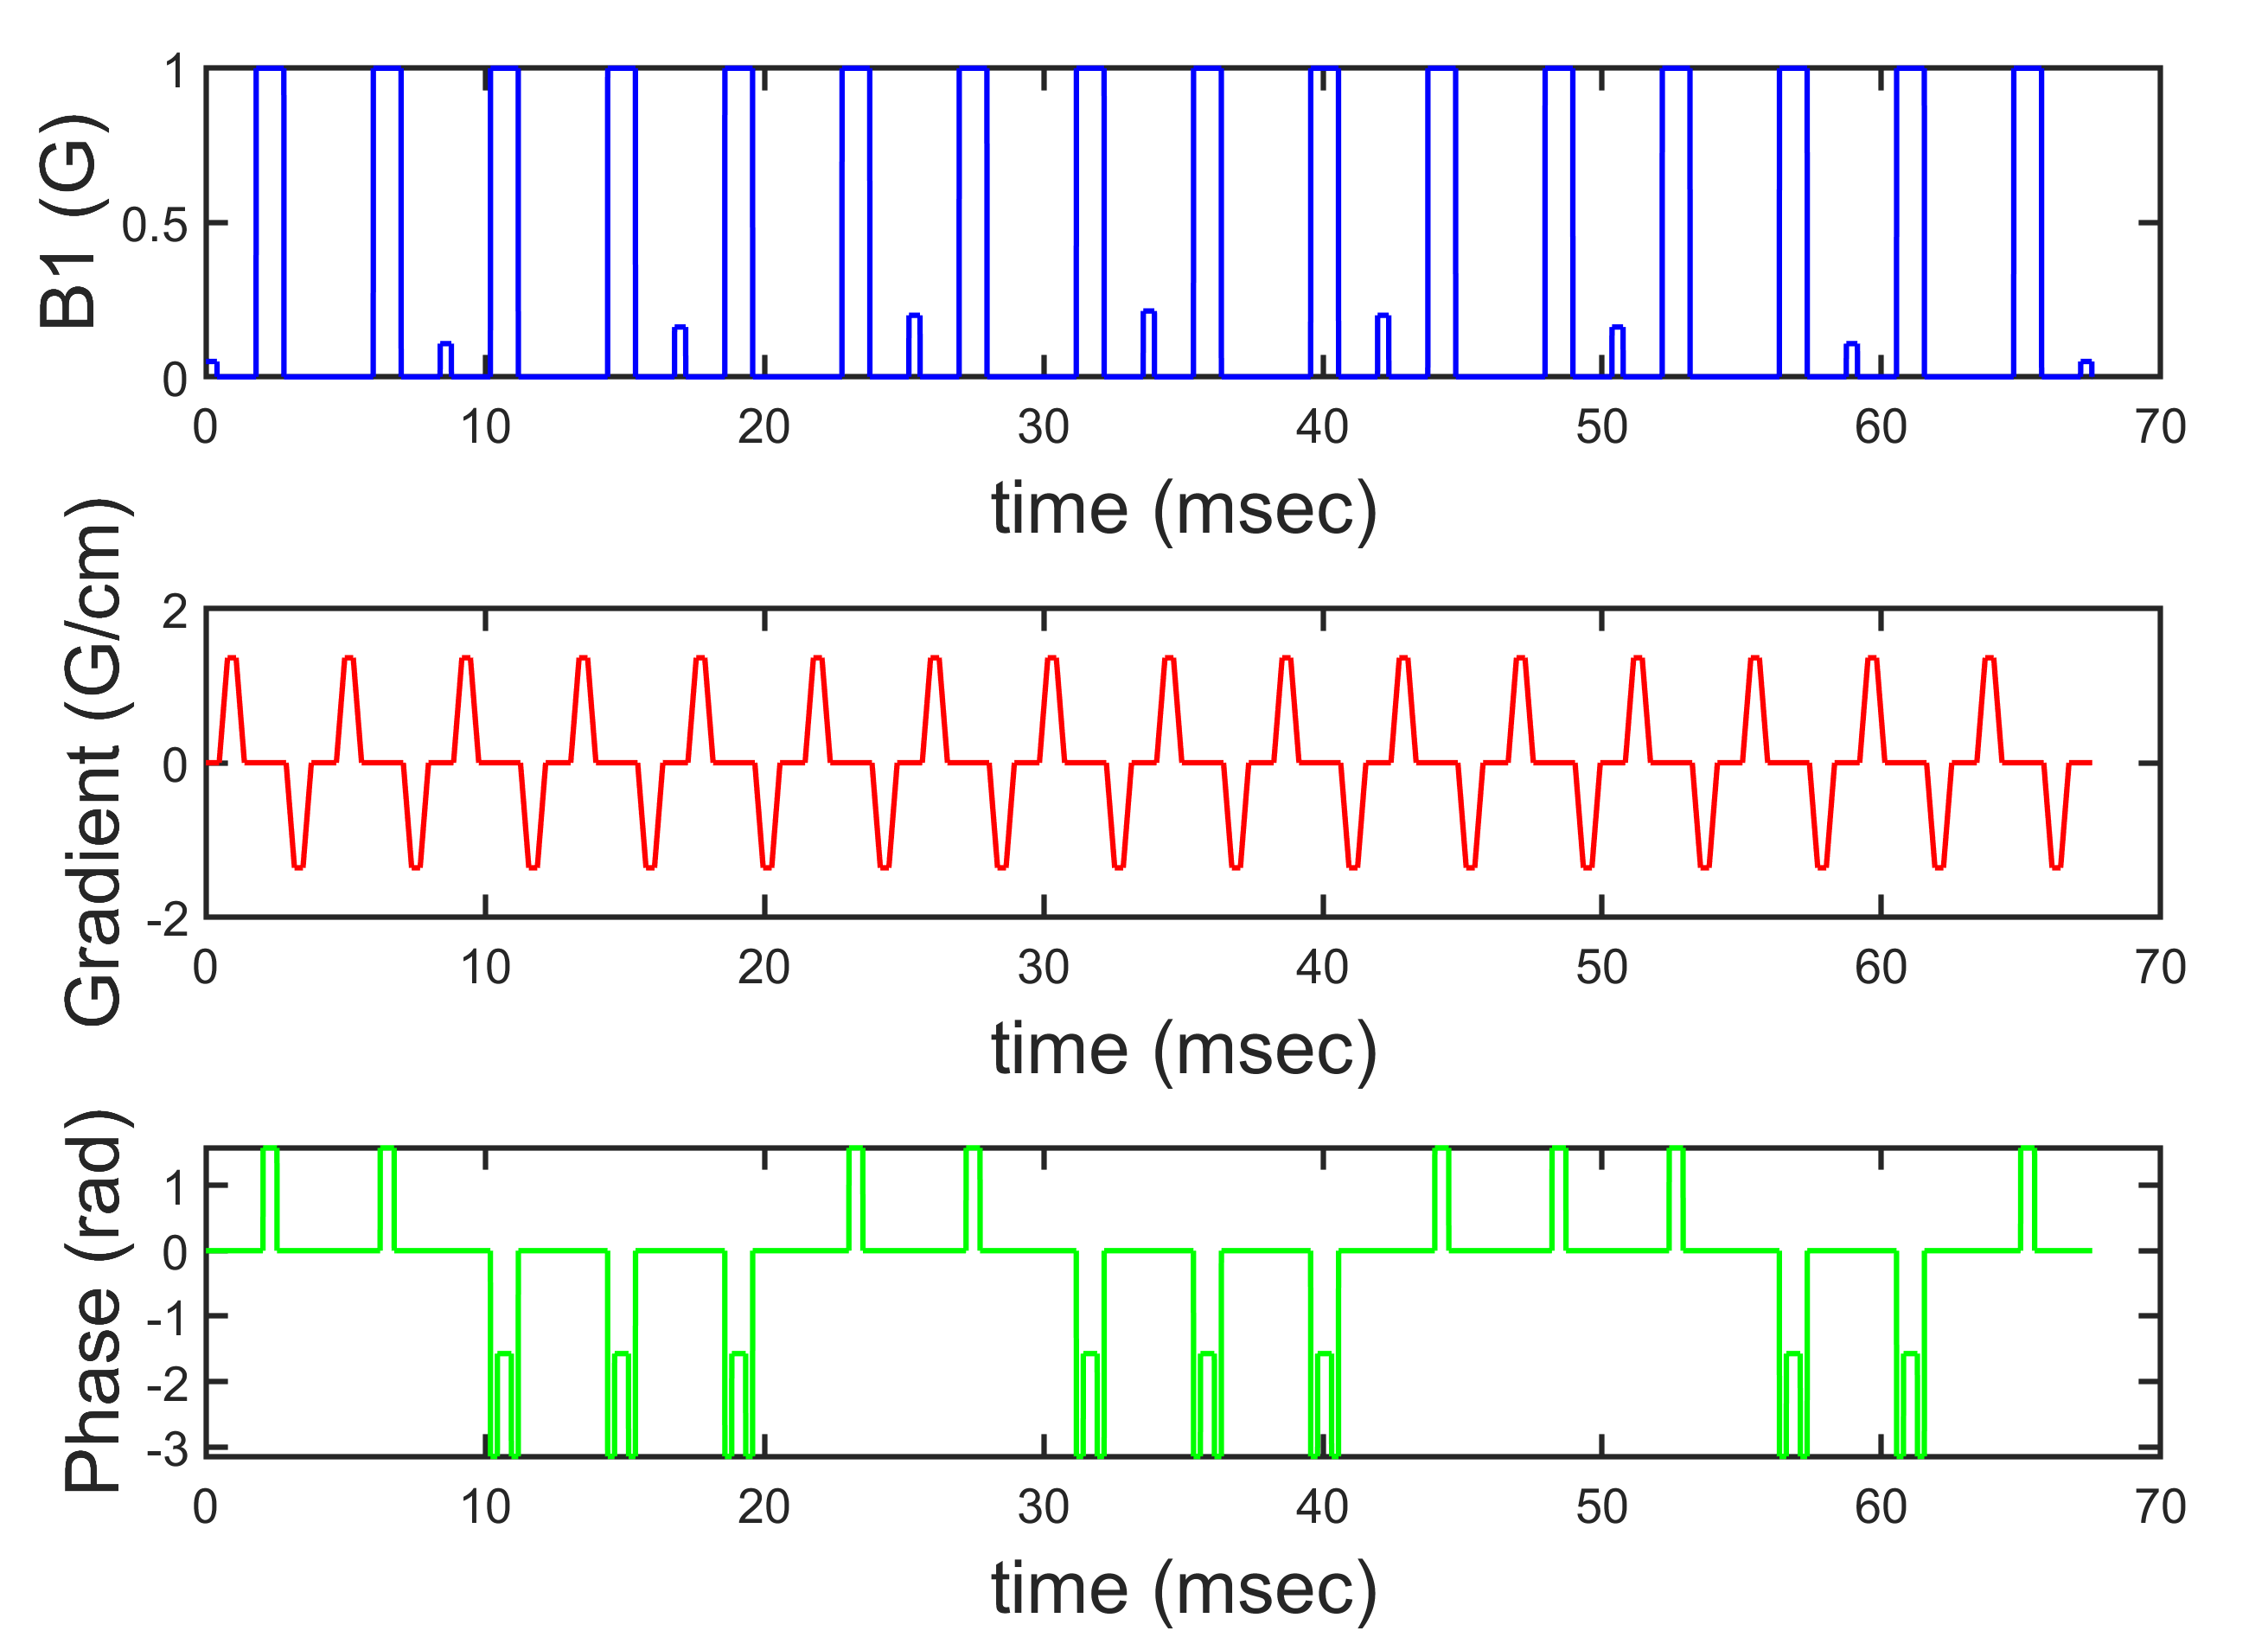
Single module velocity-selective saturation (VSS) with DRHS pulse1 and sym-BIR8 (VSS-sBIR8)5, two-module VSASL (with sym-BIR8, VSS-sBIR8 x2)2, original VSI sequence (VSI-orig)3, a modified VSI pulse using maximum-phase sinc modulation (VSI-mp-sinc)6 and a new modified VSI pulse using regular sinc modulation (VSI-sinc, Figure 2) were investigated. The performance, i.e. SNR efficiency, was simulated using Bloch simulations in MATLAB2019b (The Mathworks, Nantick, MA). The 1xVSS-sBIR85 pulse with nominal B1 scaling = 1 and off-resonance = 0 Hz was considered as the reference for comparison. The other parameters used in simulation included: T1 = 1660 ms, T2 = 150 ms, TR = 4500 ms, TI (single module) = 1300 ms, TI1/TI2 (two modules) = 1150/820 ms2. Additionally, for the two-module case, TI1 + TI2 < BD was considered2. The magnetization response with respect to velocity (SigASL-Vmean) for VSS-sBIR8 and the VSI pulses were simulated for both label and control conditions and subtracted to yield ASL signal.
Results
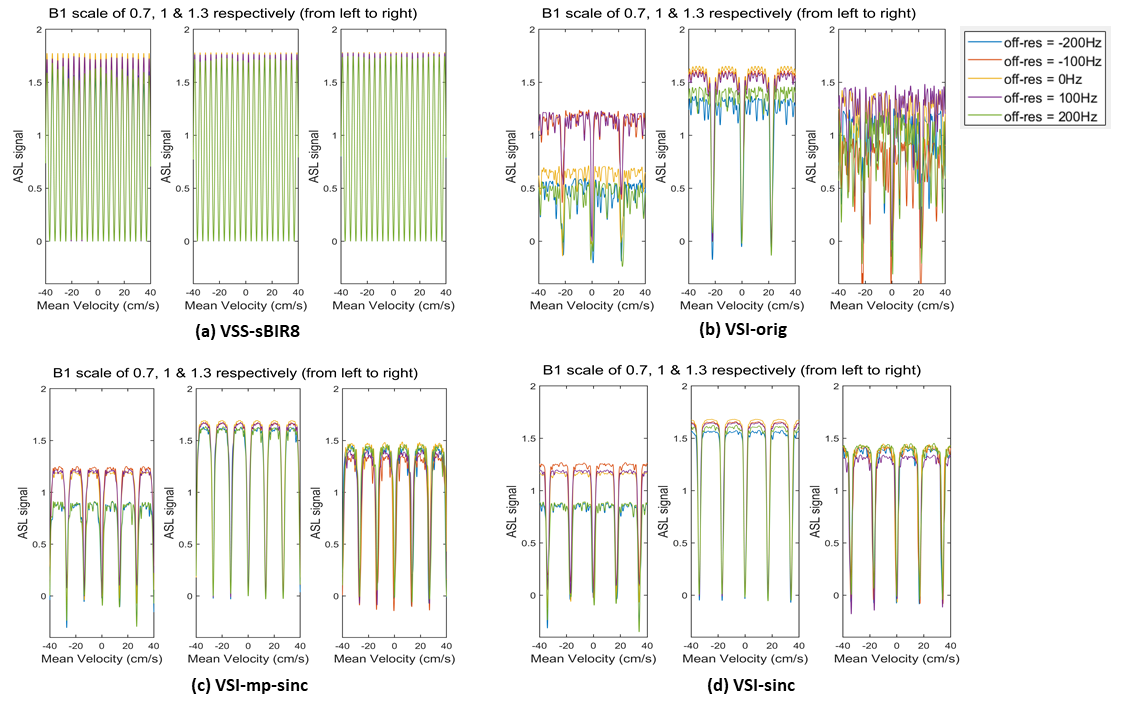
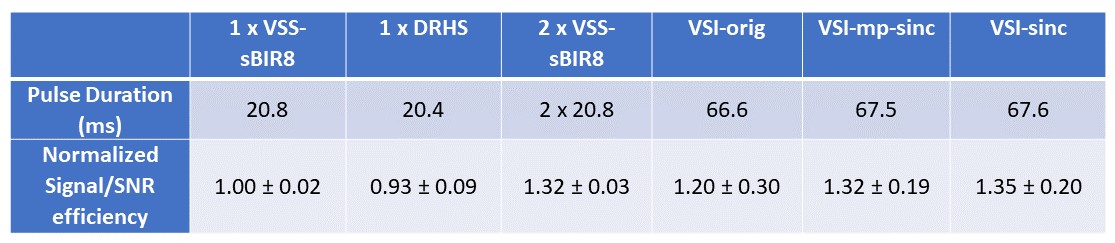
SigASL-Vmean responses shown in Figure 3 demonstrate that the modified VSI pulses contributes to better SigASL-Vmean profile than the original VSI pulse. The overall SNR efficiency and their SDs for all the pulses simulated are listed in the table in figure 4.The two-module VSS and two modified VSI pulses provided over 30% SNR efficiency increase over the single-module VSS. The modified FT-VSI pulses showed higher overall SNR efficiencies compared to the original FT-VSI pulse, with VSI-sinc performing the best with a 35% increase. VSI-orig pulse only showed a 20% increase compared to the single module VSS-sBIR8 pulse. When compared with the single-module DRHS pulse, the increase of 28.9% was consistent with the results reported previously3.
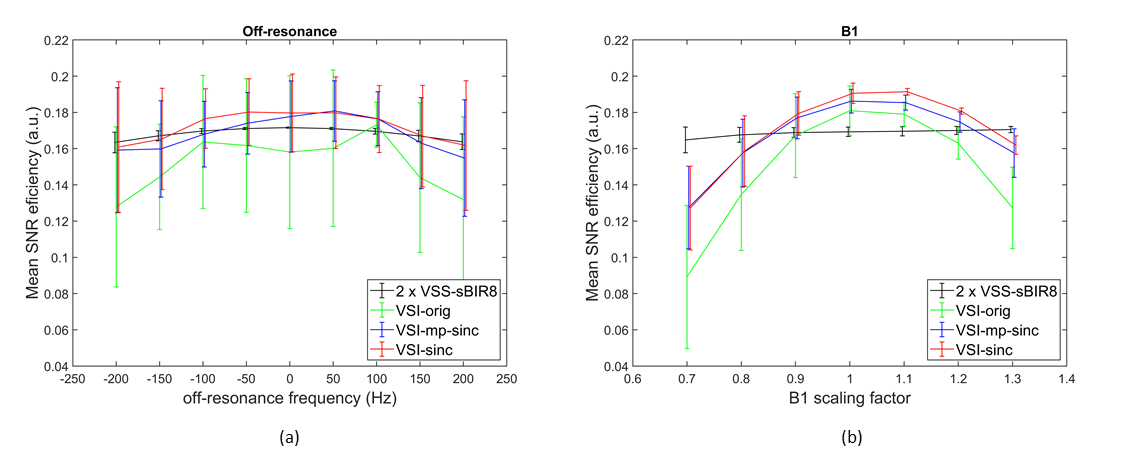
The weighted mean SNR efficiencies and SDs along off-resonance and B1 were calculated to further investigate the dependence of the performance on these variations (Figure 5). The two-module VSS-sBIR8 was the most robust over the ranges of B0 and B1 simulated as the mean SNR efficiency doesn’t change significantly, and the SD values were much lower (~ 1/10th) compared to all the VSI pulses (Figure 4). The modified FT-VSI pulses showed better SNR than VSS-sBIR8 only when B1 variation was relatively small (0.9 ~ 1.2). VSI-orig showed vulnerability to both off-resonance and B1 variation, whereas the modified VSI pulses seemed to have reasonable stability along off-resonance, while both being sensitive to B1 variation. VSI-sinc showed the best stability among the three VSI pulses.
Discussion & Conclusion
Improvement of the modified VSI pulses is likely due to the use of composite refocusing pulses, they also have less SNR efficiency reduction when B1 is higher than lower, as also observed previously6. As all the VSI pulses under investigation are B1 sensitive, it is worth exploring strategies to improve their B1 insensitivity. Alternatively, mm-VSS using sym-BIR8 provides a significant amount of increase in SNR efficiency while being the most robust across a big range of off-resonance and B1 variation. It should also provide a more accurate quantification than FT-VSI pulses.Acknowledgements
References
1. Wong EC, Cronin M, Wu W, Inglis B, Frank LR, Liu TT. Velocity-Selective Arterial Spin Labeling. Magnetic Resonance in Medicine. 2006;55:1334–1341.
2. Guo J, Wong EC. Increased SNR Efficiency in Velocity Selective Arterial Spin Labeling Using Multiple Velocity Selective Saturation Modules (mm-VSASL). Magnetic Resonance in Medicine. 2015;74:694–705.
3. Qin Q, van Zijl PCM. Velocity-Selective-Inversion Prepared Arterial Spin Labeling. Magnetic Resonance in Medicine. 2016;76:1136–1148.
4.Wu W, Wong EC. Intravascular effect in velocity-selective arterial spin labeling: The choice of inflow time and cutoff velocity. NeuroImage. 2006;32:122–128.
5. Guo J, Meakin JA, Jezzard P, Wong, EC. An optimized design to reduce eddy current sensitivity in velocity-selective arterial spin labeling using symmetric BIR-8 pulses. Magnetic Resonance in Medicine. 2015;73:1085–1094.
6. Landes V, Jao TR, Javed A, Nayak KS. Improved Velocity-Selective Labeling Pulses for Myocardial ASL. ISMRM. 2019. p4967.
7. Ding D, Guo J, Wong EC. Determination of Brain Arterial Velocity Distribution Using Velocity Selective ASL. ISMRM. 2010. p1776.
Figures