3302
Comparison of 2D EPI and 3D multi-echo spin echo EPI readout for Venous Velocity Selective Inversion to measure venous blood T2.1Radiology, Leiden University Medical Center, Leiden, Netherlands, 2Leiden Institute of Brain and Cognition (LIBC), Leiden, Netherlands, 3Physics, InBrain Lab, University of Sao Paulo, Ribeirao Preto, Brazil, 4University Medical Center Utrecht, Center for Image Sciences, Utrecht, Netherlands
Synopsis
In this study the variation in the measured apparent T2 was assessed over different slices for venous velocity selective inversion (vVSI) with 2D EPI readout in the sagittal sinus and we compared vVSI with 2D EPI and 3D multi-echo spin echo EPI (mTE-SE-EPI) readout to the gold standard TRUST. With the 2D EPI readout the T2 increases significantly over the slices.
Introduction
Last year, venous velocity selective inversion (vVSI) was introduced to spatially non-selectively label venous blood and measure the T2.1 This method benefits from the improved SNR of Velocity Selective Inversion2 (VSI) and could be used to measure the oxygen extraction fraction from venous and arterial blood separately, also in small vessels closer to the tissue, within a single scan. However, the type of readout influences the measured T2 values. With a multi-slice 2D-readout the time between T2-preparation and image readout increases for each consecutively acquired slice, during which T1-relaxation occurs, thereby influencing the measured apparent T2.In this study the variation in the measured apparent T2 was assessed over different slices for vVSI with 2D EPI readout in the sagittal sinus and we compared vVSI with 2D EPI and 3D multi-echo spin echo EPI (mTE-SE-EPI) readout to the gold standard TRUST3.
Methods
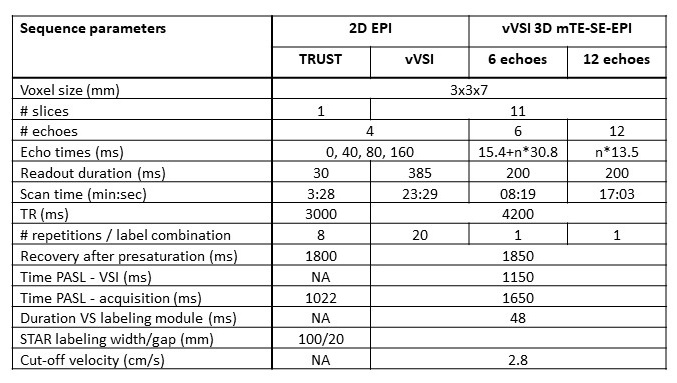
In eight healthy volunteers (23-59yrs, 6f/4m) the vVSI scan with a 2D EPI readout was scanned using a 32ch-head coil at a 3T Philips Achieva scanner, whereas in three of these subjects also two types of mTE-SE-EPI readout was acquired. All volunteers provided written informed consent and the study was approved by the local IRB.The vVSI-method employs a pulsed ASL module T1,blood*ln(2) sec before VSI-labeling to null the arterial pool and cycles through 4 different labeling combinations. When using the label condition of the pulsed ASL (PASL label, Pl) in the post-processing arterial signal will be nulled and thus eliminated. Subtraction of VSI label (Vl) and control (Vc) images will subsequently provide a map of venous signal. Similarly, when using the control condition of VSI and subtracting PASL control (Pc) and label, only arterial signal is obtained. Just before the 2D EPI read out a T2-preparation module was performed.The results were compared with a 3D mTE-SE-EPI readout acquired with 6 or 12 echoes (Details in figure 1 and table 1).
A single slice EPI-readout TRUST measurement was used as gold standard for the T2 measurement. The T2 was calculated with a mono-exponential fit in the voxel with the highest signal intensity at the first echo time in the superior sagittal sinus per slice to minimize partial voluming effects.
Results
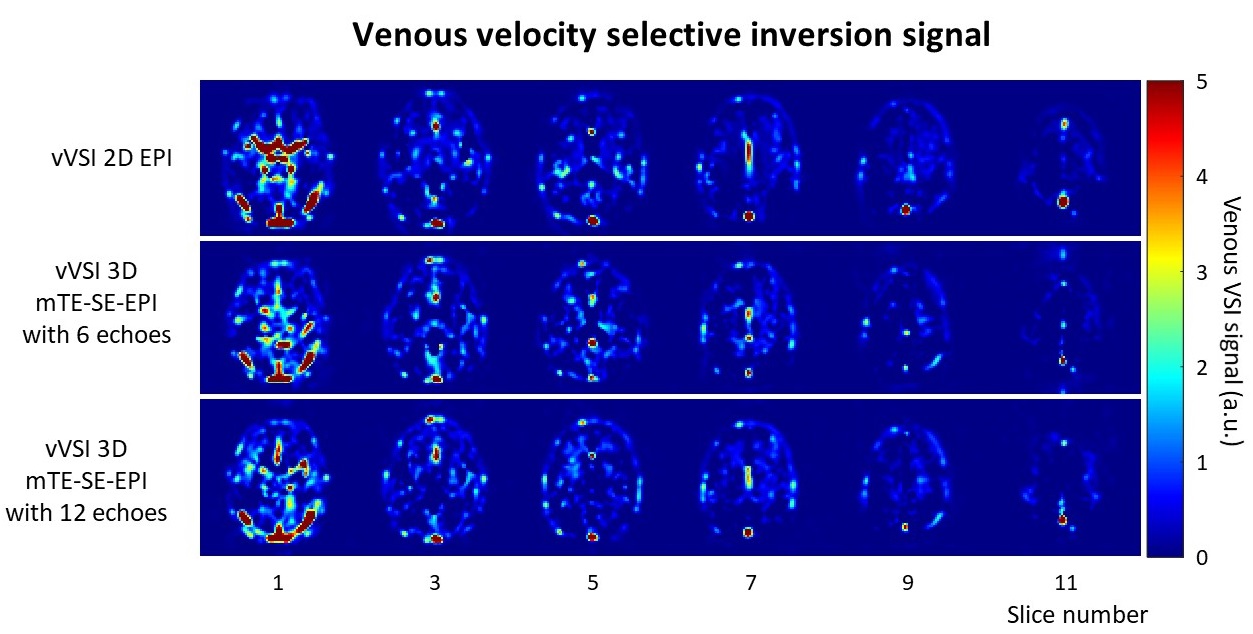
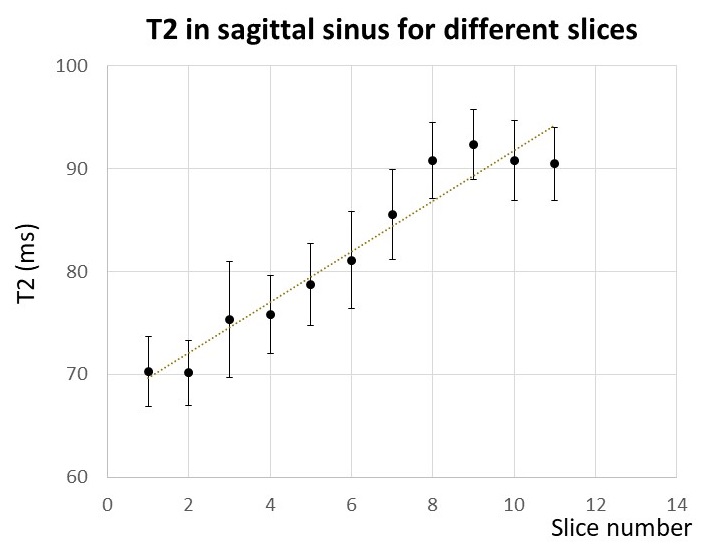
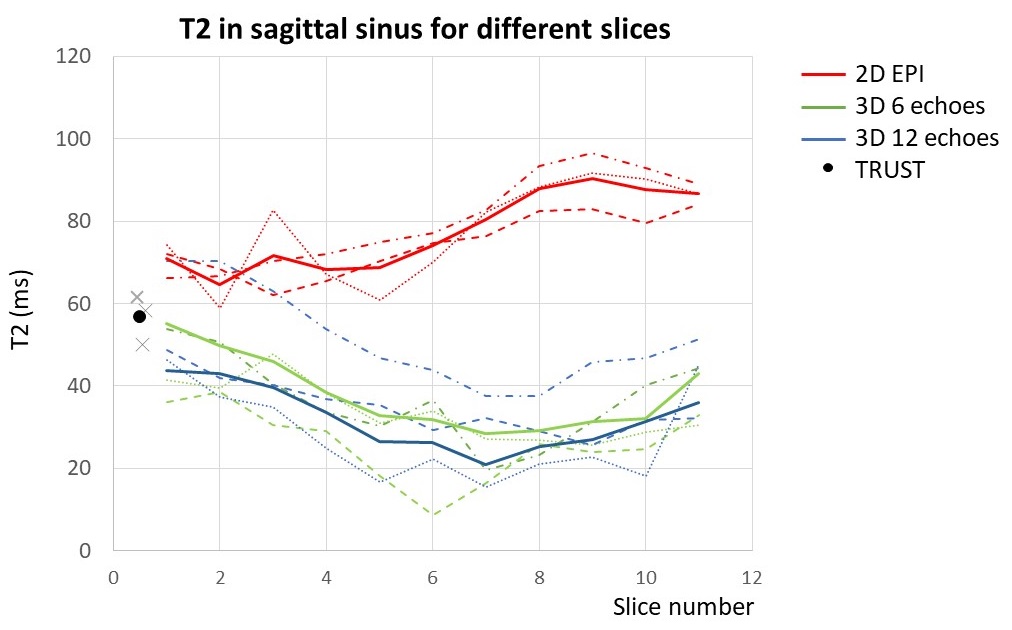
Examples of the venous VSI maps (at the first effective echo time) for the different readouts in a single volunteer are shown in figure 2, showing the venous vasculature. As can be seen in figure 3, an slice-wise increase of almost 2.5ms in T2 is measured when using the 2D EPI readout (n=8)). In figure 4 is shown what the average and individual T2-values for the subjects (n=3) is for the vVSI scans with the different readouts and TRUST scan. For both 3D readouts a slice-wise decrease in T2 was found up till slice 7 and increase for the higher slices. The T2-values of the 3D readout with the 6 eTEs was on average slightly lower than with the 12 eTEs. The positioning of the TRUST scan was located at the lowest slice of the other scans and had T2-values that were higher than acquired with the lowest slice of vVSI scan with the 3D readouts and lower than the 2D readout.Discussion and conclusion
In this study we compared vVSI with 2D and 3D readouts and evaluated the T2 over the slices. For the 2D EPI readout scans a steady slice-wise increase was found for higher slices. However, for the 3D readout scans the T2-values show a decrease in the lower slices, followed by an increase in the higher slices.A correction for the slice-wise effect on the T2 is not straightforward and requires additional scans and/or assumptions have to be made about the local M0 and T1 of venous blood. Limiting the scan to a single slice, such as TRUST, would circumvent this problem, but also limits the T2 measurements to a (few) large veins. vVSI could provide the oxygen extraction fraction at tissue level in a single scan, but to fully benefit from this, full brain coverage would be required.
Another option would be to precede a 3D readout with a separate T2-preparation module, like performed in the 2D readout. Drawback of this approach would be the four fold increase in scantime. From the current dataset it is difficult to conclude which of the 3D readouts would be preferable, due to the difference in scan duration and it can be expected the mono-exponential T2-fit with 6 eTEs is slightly less accurate than with 12 eTEs, if it is not compensated in scan duration.
In conclusion, further optimization of the vVSI readout is necessary to get more accurate T2-values, before the method can be applied to acquire reliable full brain oxygen extraction fraction measurements.
Acknowledgements
This work is part of the research programme Innovational Research Incentives Scheme Vici with project number 016.160.351, which is financed by the Netherlands Organisation for Scientific Research (NWO). This study is supported by the Out of the Box challenge 2018 from the ISMRM Benelux Chapter. We thank Qin Qin for his help on implementing the VSI sequence.References
1. S Schmid et al. Proc. Intl. Soc. Mag. Reson. Med. 27 (2019) 49682. Q Qin and PCM van Zijl. Magn Reson Med. 2016;76(4):1136-48
3. H Lu and Y Ge. Magn Reson Med. 2008;60(2):357-63
Figures
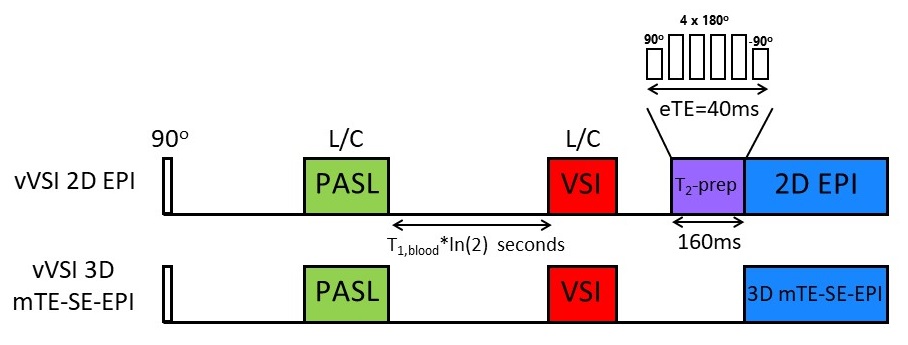
Figure 1. Schematic overview of the vVSI sequence with the 2D EPI readout sequentially after the T2-prep module performed with 4 effective echo times (eTE): 0, 40, 80 and 160 ms (containing 0, 4, 8, and 16 composite pulses for the 180o pulses with their signs arranged in an MLEV pattern) and vVSI 3D multi-echo spin-echo EPI (mTE-SE-EPI) readout with 6 or 12 echoes.
In both sequences the arterial spins were inverted by the pulsed ASL labeling module (STAR, 150mm label thickness), followed by a delay of 1150ms before the VSI-labeling module (vC=2.8cm/s), assuming T1,blood=1664ms.