3300
Free Breathing Renal Perfusion Imaging at 3T Using Velocity-Selective Inversion prepared Arterial Spin Labeling1Department of Biomedical Engineering, Johns Hopkins University School of Medicine, Baltimore, MD, United States, 2Russell H. Morgan Department of Radiology and Radiological Science, Johns Hopkins University School of Medicine, Baltimore, MD, United States, 3. F.M. Kirby Research Center for Functional Brain Imaging, Johns Hopkins University School of Medicine, Baltimore, MD, United States
Synopsis
Renal perfusion has clinical significance in diagnosis of renal diseases. Velocity-selective arterial spin labeling (VSASL) has minimal sensitivity to arterial transit time delay and velocity-selective inversion (VSI) labeling could improve SNR of perfusion signal. Here renal VSASL images were acquired using different post-labeling delay time and under different B1 shimming conditions. The feasibility of VSI based ASL for renal perfusion mapping at 3T under free breathing is demonstrated on healthy volunteers.
Introduction
Perfusion quantification is important for accessing renal tissue function of both chronic kidney disease and acute kidney injuries, as well as characterizing renal cell carcinoma1,2. Arterial spin labeling (ASL) does not require injecting contrast agents and is ideally suited for kidney perfusion measurement especially for patients with renal insufficiency3. ASL methods based on spatially selective labeling, such as FAIR and PCASL, have been demonstrated mostly at 1.5T4-9 with fewer on 3T10-12. Spatially selective ASL is known to be sensitive to extended arterial transit time, especially for patients with renal artery stenosis. Velocity-selective (VS) ASL has minimal time-delay sensitivity13 and was recently shown feasible for renal ASL at 1.5T14. Compared to conventional flow-dephasing based VS saturation (VSS) pulse train, Fourier-transform (FT) based VS inversion (VSI) pulse train was demonstrated with higher SNR for brain perfusion measurement at 3T15. Both spatially selective and velocity-selective ASL methods are susceptible to the stronger B0 and B1 field inhomogeneities in the abdomen at 3T. In this work we aim to evaluate the feasibility of VSI prepared ASL on renal perfusion mapping at 3T.Methods
The diagram for the VSI prepared renal ASL sequence is shown in Fig.1a. A pre-saturation pulse was applied with 2000ms delay allowing arterial inflow. The VSI pulse train was composed of nine 20° excitation pulses, interleaved with 16 phase-cycled composite refocusing pulses with bipolar or unipolar velocity-encoding gradients for velocity-sensitive label and velocity-compensated control modules respectively (Fig.1b). The pulse was 64ms long and the cutoff velocity (Vc) was 2cm/s. The ideal velocity-selective profile of this VSI pulse train is shown in Fig.1c. During Post labeling delay (PLD), three non-selective adiabatic inversion pulses were applied for background suppression (BGS). At the end of the PLD, a 20ms T2 preparation VSS module was applied before fat suppression and acquisition to dephase blood spins flowing above 3cm/s. The velocity-encoding gradients of both the VSI and VSS pulses were applied along the left-right direction of bilateral kidney arteries. This also avoided mistakenly labeling the foot-head motion of renal tissue during respiration.A Bloch equation simulation was conducted to assess the sensitivity of label efficiency to B0 and B1 inhomogeneities. The B1 range was 60% to 120% with B0 off-resonance set to either 0Hz or -50Hz.
Experiments were conducted among seven healthy volunteers (24-59 yo, 4 females) at a 3T Philips Ingenia scanner with a 32-channel chest array. PLD of 0.6s, 0.9s, and 1.2s were compared with the timing of BGS pulses listed in Fig.1d. We also compared the performance of fixed and vendor-provided adaptive RF shimming (dual-transmit) with local power setting. A 2D coronal slice was acquired with single-shot GRASE during free breathing: FOV=200(FH)$$$\times$$$400(LR)mm2, Resolution=2$$$\times$$$2mm2, slice thickness=8mm, TSE factor=6, EPI factor=15, SENSE=2, TE=17ms, TR=3045/3345/3645ms for each PLD, 16 dynamics of control-label pairs. M0 maps were acquired with the same acquisition except TR=5000ms. Cortex images were acquired using inversion recovery with TI=1300ms. B0 maps were obtained by a standard gradient echo sequences with two echo times. Auto B0 shim was used in all scans. Dream technique16 was used to obtain B1+ maps with STEAM flip angle = 60° and imaging flip angle =20°.
Image alignment was implemented on Advanced Normalization Toolkit libraries (ANTs)17, with non-rigid registration after an affine registration. Control and label series were registered to an individual control image and then averaged to obtain the reference for M0 registration. Renal perfusion weighted signal (PWS) were analyzed as (control-lable)/M0. Temporal SNR (tSNR) of the labeling/control difference images were calculated as the ratio of the mean to standard deviation values.
RESULTS AND DISCUSSION
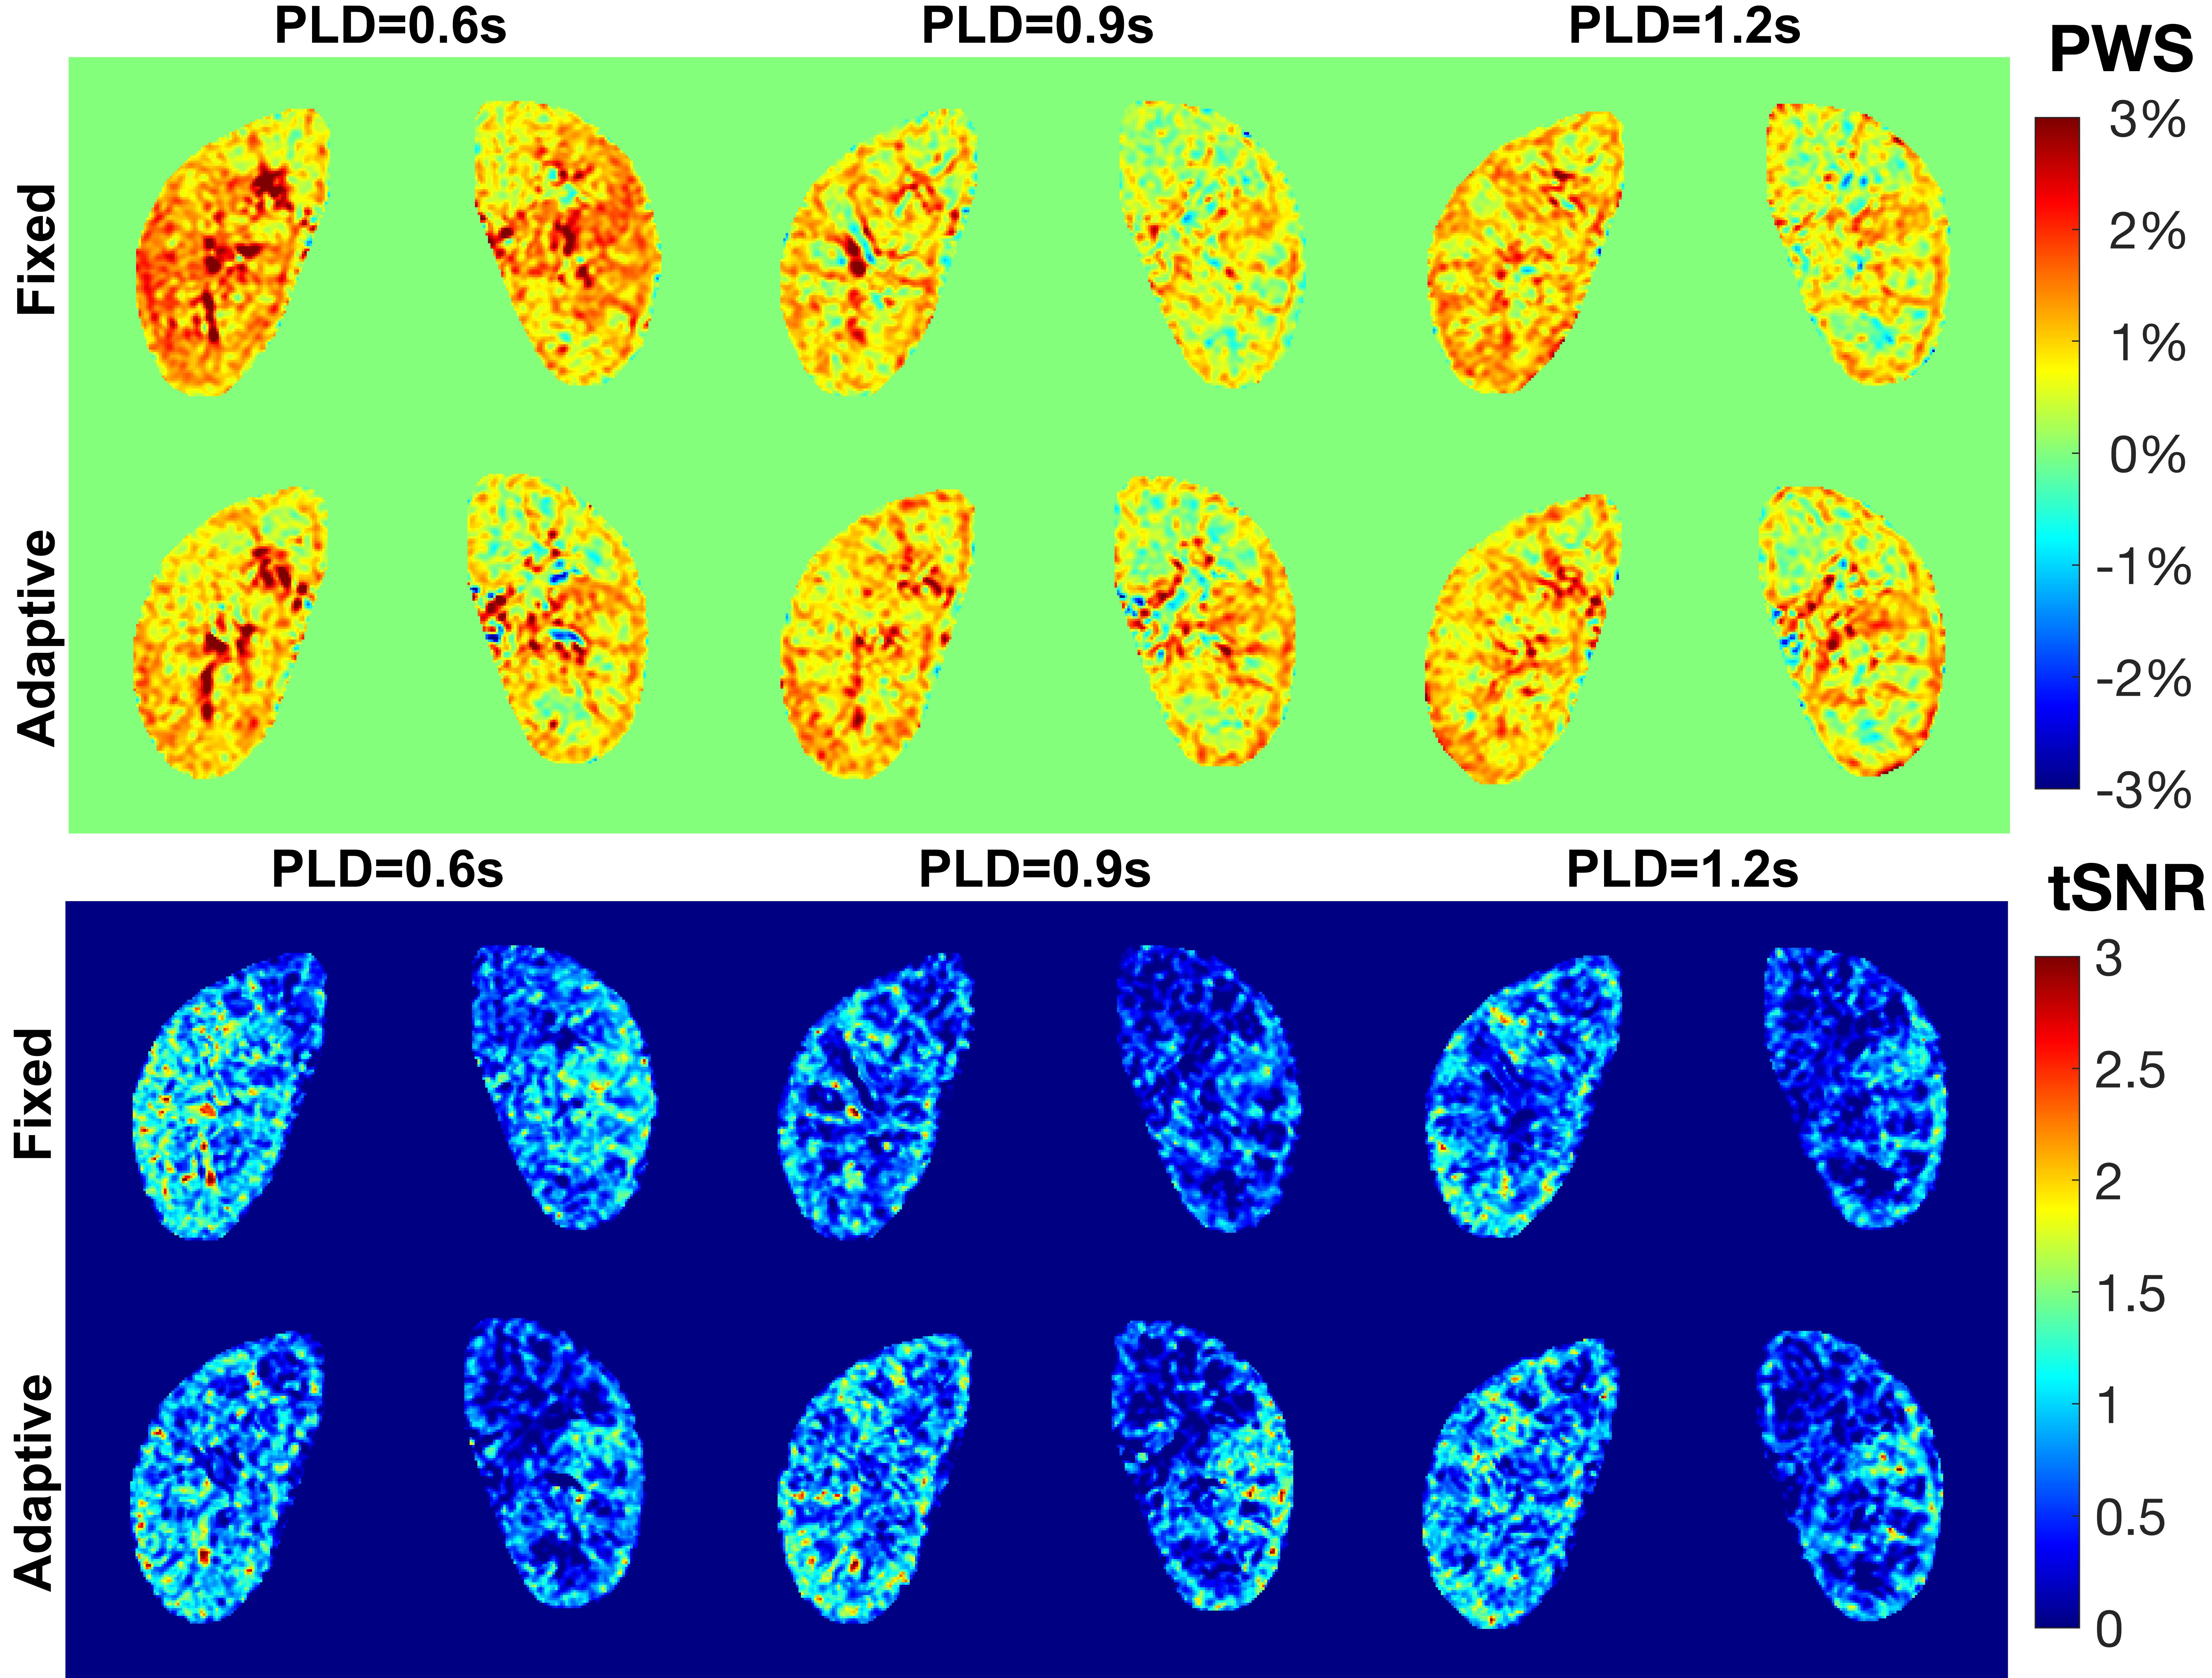
Fig.2 shows the simulated Mz-velocity responses over different B0 and B1 conditions. When B1+ scales is more than 20% lower from the correct setting, the velocity-selective profiles of the velocity-compensated control pulse train increasingly deteriorate for the spins flowing above the cutoff velocity. Even though the label module preserves the velocity-selective profiles under these poor B0/B1conditions, the subtracted signal suffers very low labeling efficiency.PWS and tSNR images of a subject with different PLDs at two B1 shimming conditions are displayed in Fig.3. Results with PLD=0.9s using adaptive shim of all seven subjects were arrayed in Fig.4, together with B0 and B1 maps, M0 and cortex images, as well as averaged control and label images normalized by M0. Good quality of renal perfusion weighted images were seen in first six cases, all with distinct cortex-medulla contrast similar to the cortex images. The last case yielded low perfusion signal in the right kidney, most likely affected by the poor B1 inhomogeneity as reflected in the corresponding B1 map.
The averaged PWS and tSNR within cortex region of interest for the six successful cases with different PLD and B1 shim conditions are compared in Fig.5. Results indicated better performance with Adaptive B1 Shim than fixed shim on both PWS and tSNR. PLD=0.9s also derived slightly higher perfusion signal and tSNR than 0.6s and 1.2s delays.
CONCLUSION
The feasibility of VSI based ASL for renal perfusion mapping at 3T under free breathing is demonstrated on healthy volunteers. Better B1 shimming will be explored in future work to improve the robustness of the method.Acknowledgements
No acknowledgement found.References
1. Selby NM, Blankestijn PJ, Boor P, et al. Magnetic resonance imaging biomarkers for chronic kidney disease: a position paper from the European Cooperation in Science and Technology Action PARENCHIMA. Nephrol Dial Transplant. 2018;33(suppl 2):ii4‐ii14.
2. Zhang JL, Lee VS. Renal perfusion imaging by MRI. J Magn Reson Imaging doi: 10.1002/jmri.26911. Published online August 27, 2019. Accessed September 20, 2019.
3. Nery F, Gordon I, Thomas DL. Non-invasive renal perfusion imaging using arterial spin labeling MRI: challenges and opportunities. Diagnostics. 2018;8(1):2
4. Martirosian P, Klose U, Mader I, Schick F. FAIR true-FISP perfusion imaging of the kidneys. Magn Reson Med 2004;51(2):353–361.
5. Robson PM, Madhuranthakam AJ, Dai W, et al. Strategies for reducing respiratory motion artifacts in renal perfusion imaging with arterial spin labeling. Magn Reson Med 2009;61(6):1374–1387
6. Lanzman RS, Robson PM, Sun MR, et al. Arterial spin-labeling MR imaging of renal masses: correlation with histopathologic findings. Radiology 2012;265(3):799–808
7. Robson PM, Madhuranthakam AJ, Smith MP, et al. Volumetric Arterial Spin-labeled Perfusion Imaging of the Kidneys with a Three-dimensional Fast Spin Echo Acquisition. Acad Radiol 2016;23(2):144-154.
8. Nery F, De Vita E, Clark CA, et al. Robust kidney perfusion mapping in pediatric chronic kidney disease using single-shot 3D-GRASE ASL with optimized retrospective motion correction. Magn Reson Med 2019;81(5):2972-2984.
9. Bones IK, Harteveld AA, Franklin SL, et al. Enabling free-breathing background suppressed renal pCASL using fat imaging and retrospective motion correction. Magn Reson Med 2019;82(1):276–288
10. Wu WC, Su MY, Chang CC, et al. Renal perfusion 3-T MR imaging: a comparative study of arterial spin labeling and dynamic contrast-enhanced techniques. Radiology. 2011;261(3):845–853.
11. Li LP, Tan H, Thacker JM et al. Evaluation of renal blood flow in chronic kidney disease using arterial spin labeling perfusion magnetic resonance imaging. Kidney Int Rep . 2017;2(1):36–43
12. Taso M, Guidon A, Alsop DC. Influence of background suppression and retrospective realignment on free‐breathing renal perfusion measurement using pseudo‐continuous ASL. Magn Reson Med. 2019;81(4):2439-2449
13. Wong EC, Cronin M, Wu WC, et al. Velocity‐selective arterial spin labeling. Magnetic Resonance in Medicine: Magn Reson Med. 2006;55(6):1334-1341.
14. Bones IK, Franklin SL, Hartveld AA, et al. Influence of labeling parameters of velocity selective arterial spin labeling for renal perfusion imaging. In Proceedings of the 26th Annual Meeting of the ISMRM, Montreal, Canada, 2019:4948.
15. Qin Q, van Zijl PC. Velocity‐selective‐inversion prepared arterial spin labeling. Magn Reson Med 2016;76(4):1136-1148.
16. Nehrke K, Bornert P. DREAM‐a novel approach for robust, ultrafast, multislice B(1) mapping. Magn Reson Med 2012;68(5):1517–1526.
17. Avants BB, Epstein CL, Grossman M, Gee JC. Symmetric diffeomorphic image registration with cross‐correlation: evaluating automated labeling of elderly and neurodegenerative brain. Med Image Anal. 2008;12(1):26–41.
Figures