3297
Estimation of cortical perfusion from arterial spin labelling data on the cortical surface1Institute of Biomedical Engineering, Department of Engineering Science, University of Oxford, Oxford, United Kingdom, 2Wellcome Centre for Integrative Neuroimaging, University of Oxford, Oxford, United Kingdom, 3Department of Psychiatry, School of Medicine, Washington University, St Louis, MO, United States
Synopsis
Surface-based analysis is a popular approach to fMRI analysis as, compared with volumetric analysis, it allows easier registration of functional regions between individuals. This work sought to move towards surface-based perfusion analysis of arterial spin labelling data. It presents a comparison of the results of a surface-based analysis pipeline with results from a conventional volumetric perfusion analysis pipeline projected onto the cortical surface. Bayesian inference of cortical surface perfusion is demonstrated here and is shown to produce substantially lower perfusion estimates than conventional voxelwise analysis. Future work will investigate to origins of these perfusion differences.
Introduction
Surface-based analysis has emerged as a promising new approach for the analysis of functional imaging data (particularly fMRI). This is because the cortex is inherently a 2D structure, and it is easier to register homologous functional regions across individuals on the 2D cortical surface than in 3D volume space. This improves region-based analysis at both the individual and group level [1]. This work makes use of a strategy developed by the Human Connectome Project for fMRI to project and analyse ASL data on the cortical surface.Methods
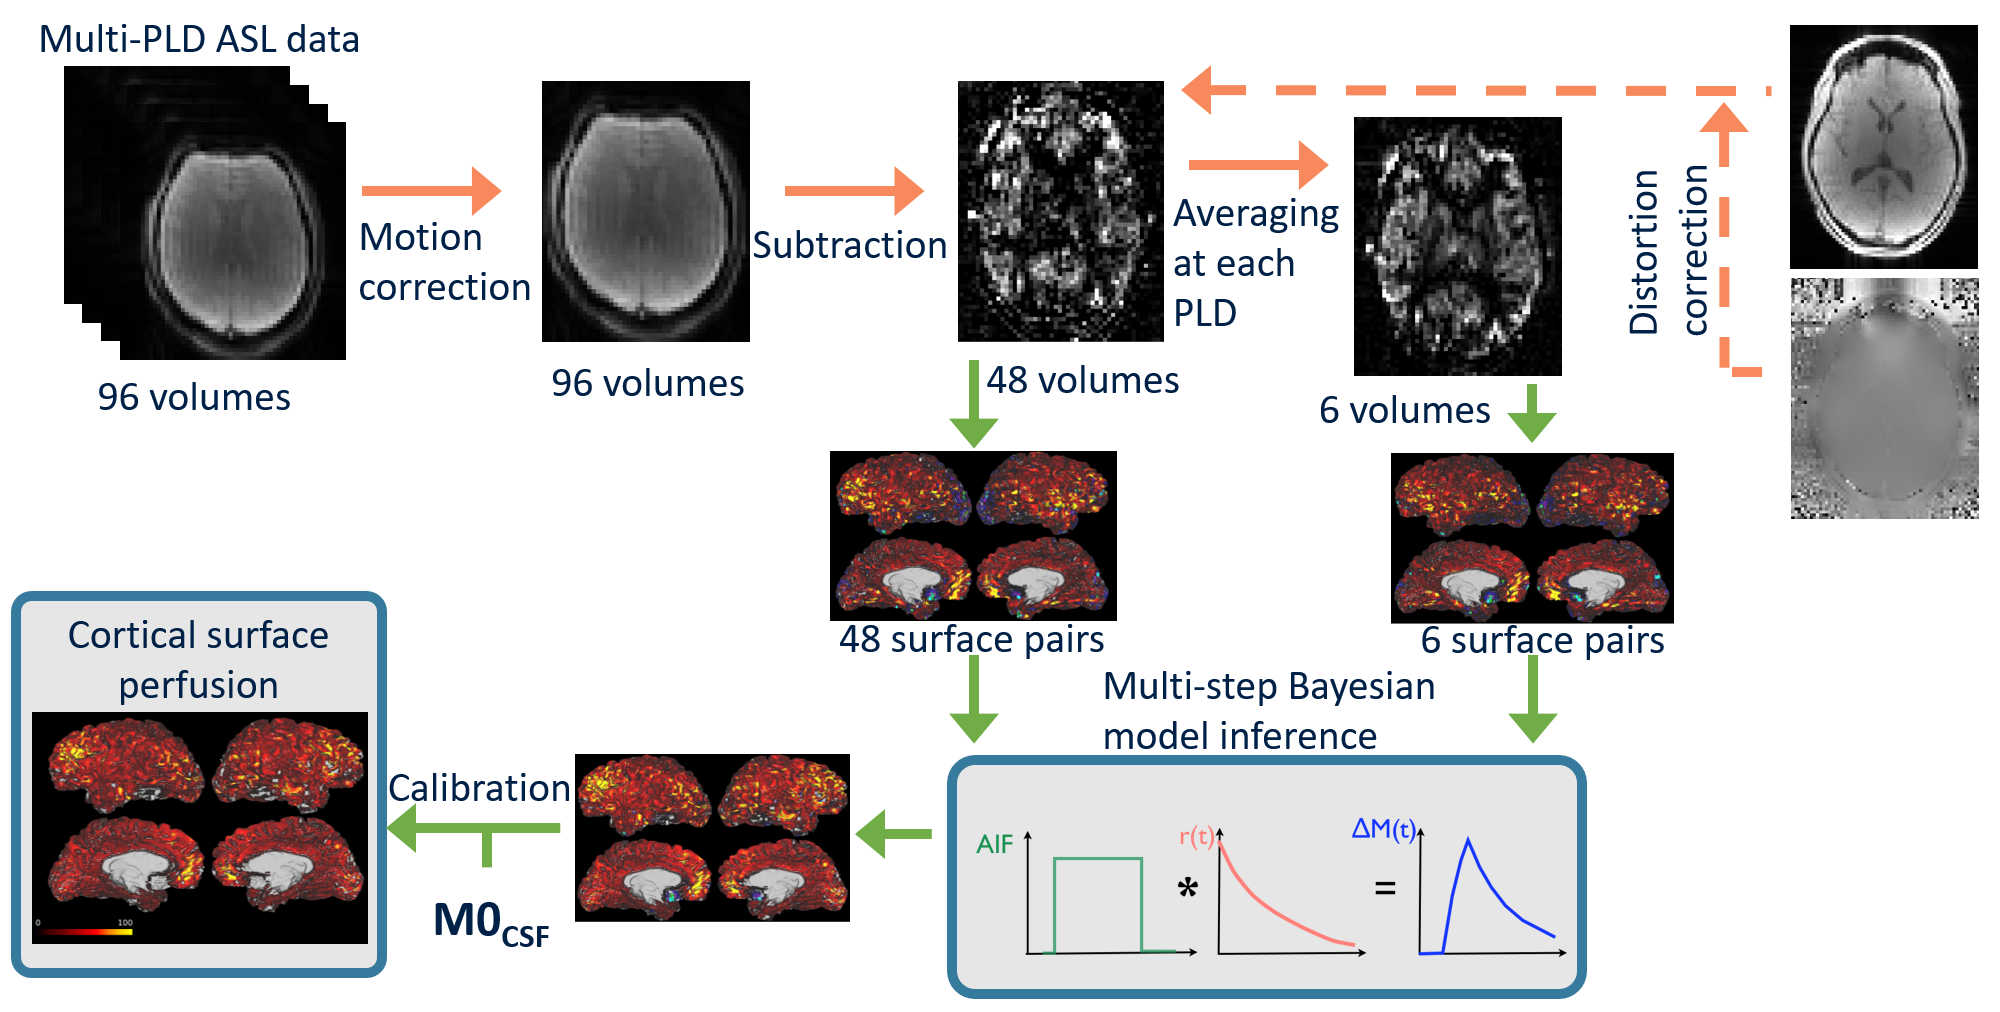
ASL data from 7 healthy volunteers, acquired by [2] were used here. The volunteers were scanned at rest using a pcASL protocol with multiple post-label delays (PLDs: 0.25, 0.50, 0.75, 1.00, 1.25, and 1.50s; labelling duration=1.40s, TR=4s, TE=13ms, 24 slices each 4.95 mm thick, in-plane resolution 3.4mm x 3.4 mm, 96 volumes were acquired with 8 repeats at each PLD, in 6.4 mins). Also acquired were a T1 structural image, head and body coil calibration images, and B0 fieldmaps. Figure 1 shows the volumetric analysis pipeline that was applied to these data. During pre-processing, using the BASIL toolbox [3], the ASL data were corrected for subject motion and EPI distortions, and label-control subtraction was performed (Figures 1 and 2). From this point the perfusion-weighted difference data were then analysed differently in the ‘conventional’ (Figure 1), and ‘surface-based’ (Figure 2) pipelines. For the ‘conventional’ pipeline perfusion estimation was performed in voxel space through multi-step Bayesian kinetic model fitting using FABBER [4]. The resulting perfusion-weighted image was registered to the T1w image using FLIRT (with 6 degrees of freedom and boundary based registration), in order to perform perfusion calibration through the use of a CSF reference region. The T1w structural image was also processed through FreeSurfer to obtain cortical surfaces, which were then transformed into alignment with the ASL data, using the linear transform acquired from FLIRT, for use in the ‘surface-based’ perfusion analysis pipeline.Both the calibrated perfusion results in ml/100g/min from the ‘conventional’ pipeline, and the corrected time series of ASL difference data, were projected onto the cortical mid-surface using the Human Connectome Project’s wb_command –volume-to-surface-mapping command, using the ribbon-constrained mapping algorithm [5]. For the ‘surface-based’ pipeline (Figure 2) the projected ASL difference data were then used in perfusion analysis performed directly on the cortical surface. This was done by fitting the kinetic model to the ASL difference data, again through multi-step Bayesian inference using the FABBER tool, but on the data at cortical surface vertices rather than in voxels. The resulting un-calibrated cortical surface perfusion data were then calibrated using the same calibration factor as the volumetric pipeline.
Results
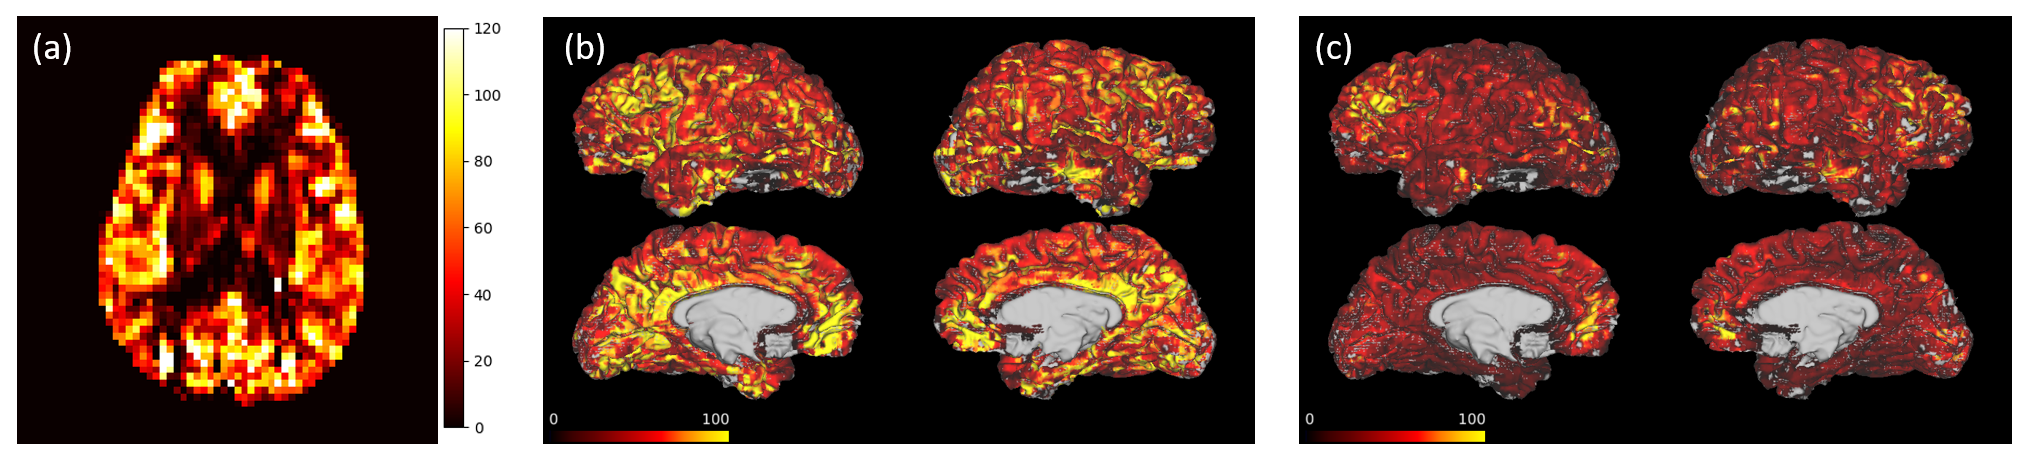
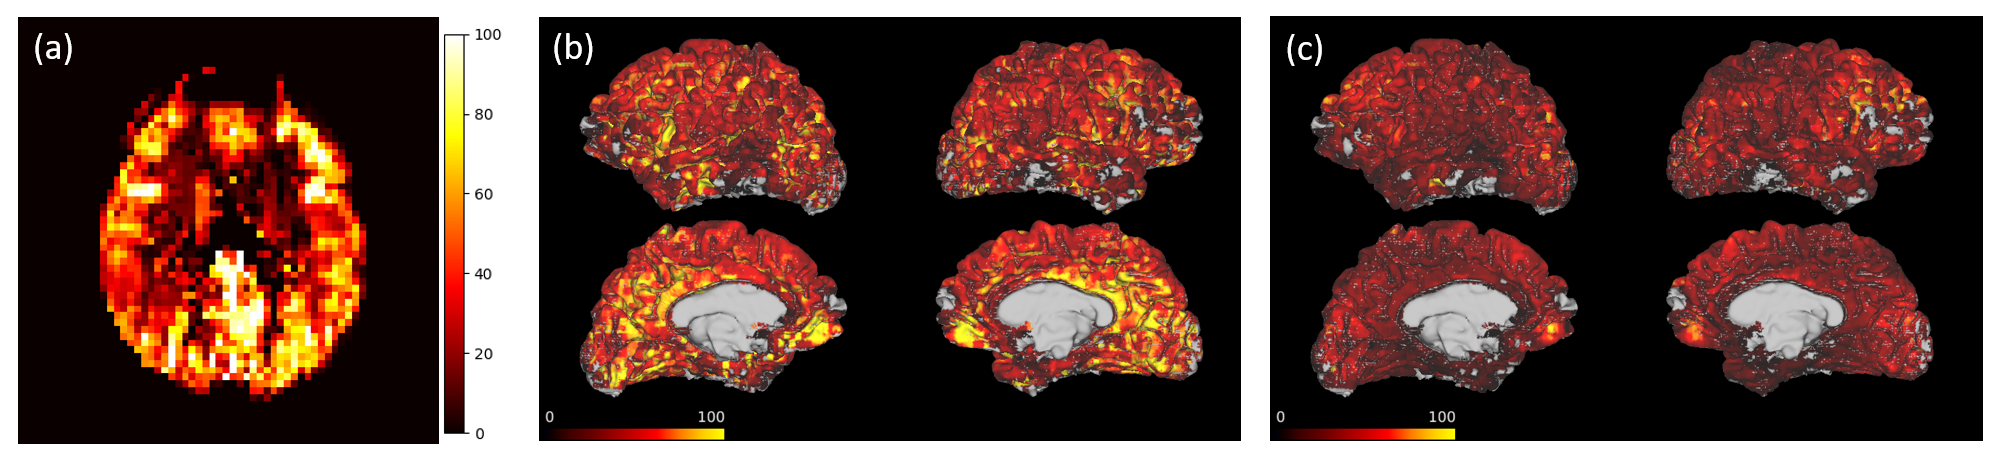
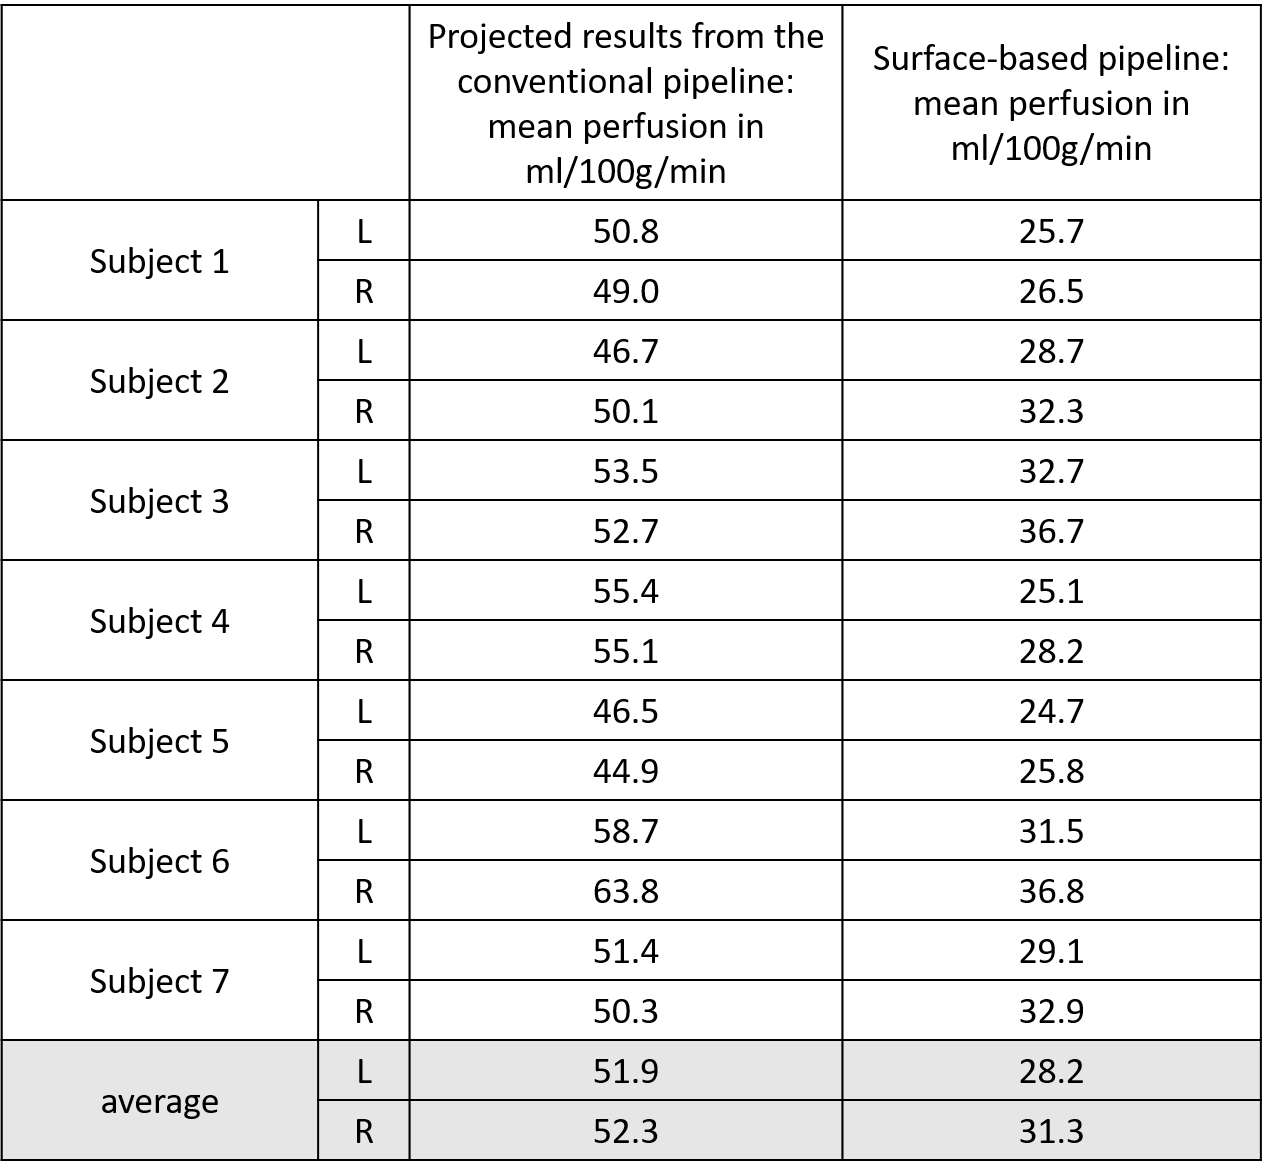
Figures 3 and 4 show calibrated perfusion results from the two analysis pipelines. Figures 3a and 4a show the typical perfusion output of the ‘conventional’ analysis pipeline, i.e., calibrated perfusion in voxel space. Figures 3b and 4b show the same calibrated perfusion data, from the ‘conventional’ analysis pipeline, projected onto the cortical surface, and Figures 3c and 4c show the output of the ‘surface-based’ perfusion analysis pipeline.Table 1 includes mean perfusion of the left and right cortical surfaces obtained, via the conventional analysis pipeline (Figures 1, 3b and 4b), and via the surface-based pipeline (Figures 2, 3c and 4c), for each of the 7 subjects. The results show that the surface-based analysis pipeline consistently produces substantially lower estimates of cortical surface perfusion than the conventional analysis pipeline (approx. 20 ml/100g/min lower).
Discussion
This work demonstrates perfusion analysis performed on the cortical surface, and presents a brief comparison to results from conventional perfusion analysis performed voxelwise with subsequent projection to the cortical surface. From the example cortical surface perfusion maps for two subjects, a difference in the magnitude of perfusion estimates can be observed, with the surface-based analysis pipeline showing globally lower perfusion than the conventional pipeline. This difference is evident in Table 1 which shows that there is a group average perfusion difference of 23.7 ml/100g/min in the left hemisphere, and 21.0 ml/100g/min in the right hemisphere. These differences are very large and warrant further investigation to understand their origins.Conclusion
Perfusion analysis on the cortical surface is in its infancy. This work demonstrates that it is possible to generate estimates of cortical perfusion through surface-based analysis. However, work remains to understand the differences in perfusion that arise from the choice of conventional versus surface-based perfusion analysis. In addition, work is ongoing to incorporate spatial priors, on both the perfusion and the arterial arrival time values, into the surface-based analysis pipeline.Acknowledgements
Please note: FKM and JT contributed equally to this work. The authors gratefully acknowledge support from an EPSRC grant: EP/P012361/1, and from grants: U01MH109589 and U01AG052564. TK is supported by the Bellhouse Scholarship at Magdalen College, Oxford. The Wellcome Centre for Integrative Neuroimaging is funded by a Centre Grant (203139/Z/16/Z).References
[1] Coalson, T. et al., "The impact of traditional neuroimaging methods on the spatial localization of cortical areas.", Proc. Natl. Acad. Sci. USA 2018 Jul 3;115(27):E6356-E6365
[2] Mezue, M., et al. "Optimization and reliability of multiple postlabeling delay pseudo-continuous arterial spin labeling during rest and stimulus-induced functional task activation." J. Cereb. Blood Flow Metab. 2014 Dec;34(12):1919-1927.
[3] https://www.fmrib.ox.ac.uk/fsl/BASIL
[4] Chappell, M., et al. "Variational Bayesian inference for a nonlinear forward model." IEEE Trans. Sig. Process. 2008;57(1):223-236.
[5] Glasser, Matthew F., et al. "The minimal preprocessing pipelines for the Human Connectome Project." Neuroimage 2013 Oct 15;80:105-124.
Figures
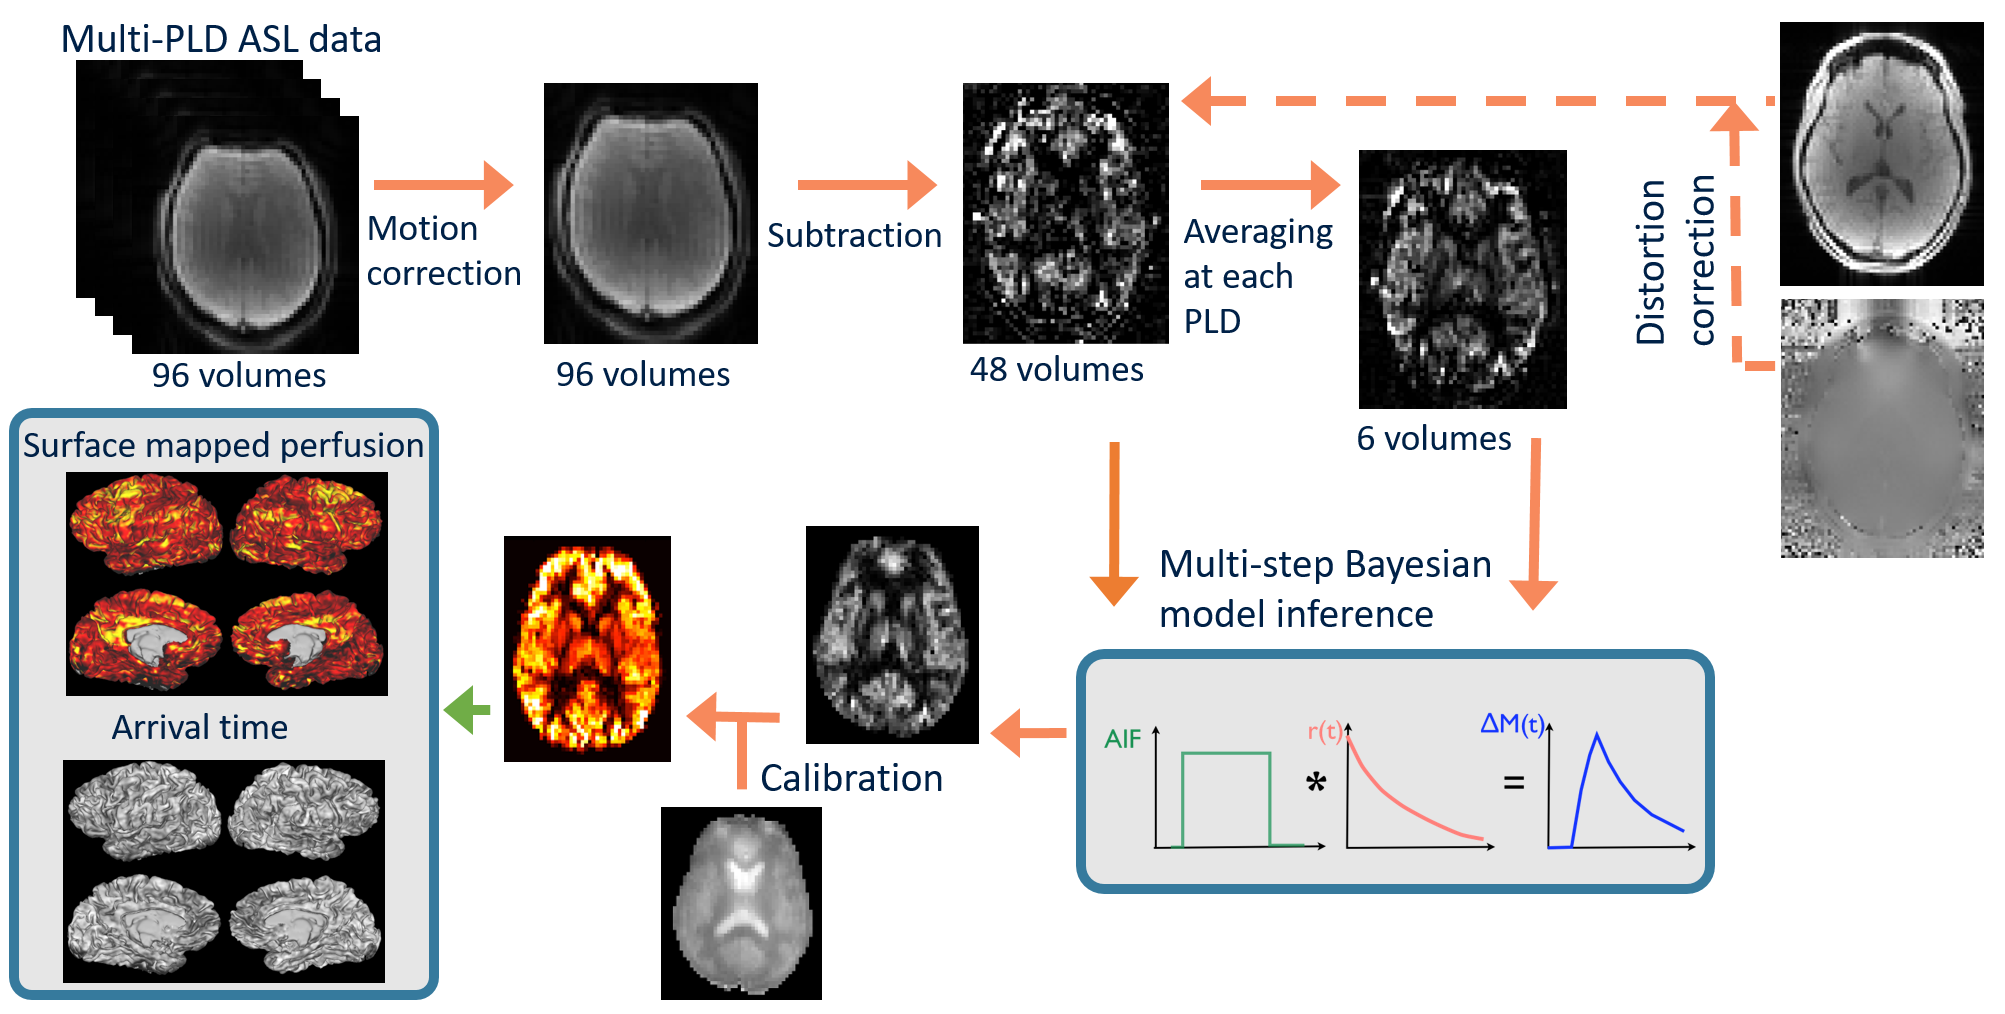
Figure 1 – Conventional voxelwise ASL perfusion analysis pipeline. This pipeline includes the additional step of mapping the volumetric perfusion estimates, in ml/100g/min, to the cortical surface.