3294
Measurement of intra- and extra-neurite perfusion by combining ASL with the NODDI DWI model
Iris Asllani1,2, Alicia Plaindoux3, Jan Petr4, Joseph G. Woods5,6, Matthias J. P. van Osch7, and Mara Cercignani1
1Neuroscience, University of Sussex, Brighton, United Kingdom, 2Biomedical Engineering, Rochester Institute of Technology, Rochester, NY, United States, 3Grenoble Institute of Technology, Grenoble, France, 4Helmholtz-Zentrum Dresden-Rossendorf, Dresden, Germany, 5University of California San Diego, San Diego, CA, United States, 6University of Oxford, Oxford, United Kingdom, 7Leiden University Medical Center, Leiden, Netherlands
1Neuroscience, University of Sussex, Brighton, United Kingdom, 2Biomedical Engineering, Rochester Institute of Technology, Rochester, NY, United States, 3Grenoble Institute of Technology, Grenoble, France, 4Helmholtz-Zentrum Dresden-Rossendorf, Dresden, Germany, 5University of California San Diego, San Diego, CA, United States, 6University of Oxford, Oxford, United Kingdom, 7Leiden University Medical Center, Leiden, Netherlands
Synopsis
Intra- and extra-neurite perfusion in gray and white matter were estimated by applying a spatial linear regression algorithm on ASL images using the micro-structural anatomical information derived from the NODDI analysis of the DWI data. Baseline ASL images were acquired with 4 post-labeling delay (PLD) values in order to test the hypothesis of redistribution of ASL signal across the micro-compartments with increasing PLD. Motor activation was used to investigate the sensitivity of the method for detecting changes in perfusion at the micro-structural level.
INTRODUCTION
One of the advantages of Arterial Spin Labeling (ASL) compared to other techniques that measure CBF is the use of RF-labeled arterial water as an endogenous tracer1. The water proton spins are labeled within the carotid arteries at the base of the brain. To allow for the labeled spins to cross the vasculature and diffuse into the tissue, a delay (PLD) is inserted between the end of labeling pulse and the start of the image acquisition. To limit the loss of labeled signal due to T1 relaxation during the delay, PLD is typically set to ~1800ms1. The rapid acquisition that follows the delay comes at the expense of the spatial resolution. Thus, the ASL signal from a given voxel reflects a weighted sum of the flow values from the different tissue and vascular compartments comprising the voxel. This mixing of the signals is known as partial volume effects. Currently, partial volume correction (PVC) algorithms that have been developed for use in ASL2,3 only differentiate between different tissue types and make no further distinction among micro-structural compartments within the same tissue. Here, we used the spatial linear regression (SLR) PVC method3 to differentiate perfusion signal into extra-neurite compartment, (e.g., soma, glial cells) and intra-neurite, (mostly of axons, dendrites) contributions, independently. Fractional volume information about these compartments was obtained from a diffusion weighted imaging (DWI) model, referred to as NODDI4. We tested the hypothesis that as PLD increases, the intra-neurite CBF in both gray (GM) and white matter (WM) will also increase. To test the sensitivity of the method for detecting changes in flow at the micro-compartmental level, ASL images were also acquired during a motor activation task.METHODS
Theory: The blood flow (f) at each voxel is modeled as:$$$f_{T}=VF_{IN}f_{IN}+VF_{EN}f_{EN}+VF_{ISO}f_{ISO}$$$ Eq.1.
where, VFIN, VFEN, VFISO represent, respectively, the intra-neurite, extra-neurite, and non-tissue volume fractions obtained from the NODDI data4; the flow in each compartment is denoted by fIN, fEN, fISO. By assuming that for each compartment (j), fj is constant over a ‘kernel’, Eq.1 can be re-written as Eq.2 below which provides the basis of the linear regression used by the PVC algorithm:
$$$f_{j}=\begin{bmatrix}VF^{T} & VF \end{bmatrix}^{-1} VF^{T}f_{T}$$$ Eq.2.
Image acquisition & analysis: T1w (MPRAGE), NODDI, and ASL MRI images were obtained on 7 healthy participants (mean age = 34.5 ± 7.4 y, 4 men) on a Siemens 3T system. To test the hypothesis that the intra-neurite flow would increase with increasing PLD, baseline ASL images were acquired with 4 PLDs: 500, 1000, 2000, and 2500ms. For PLD = 1000 and 2000ms, ASL images were also acquired during one-hand motor activation. For all acquisitions, labeling duration was 2000ms. Each ASL image reflects the average of 40 control/label pairs. To measure changes in flow due to motor-activation a motor-ROI mask was computed using a local threshold algorithm. NODDI diffusion data were acquired with b_values 800smm-2 (30 directions) and 2600smm-2 (60 directions). Paired t-test was run to detect activation induced changes in CBF.
RESULTS
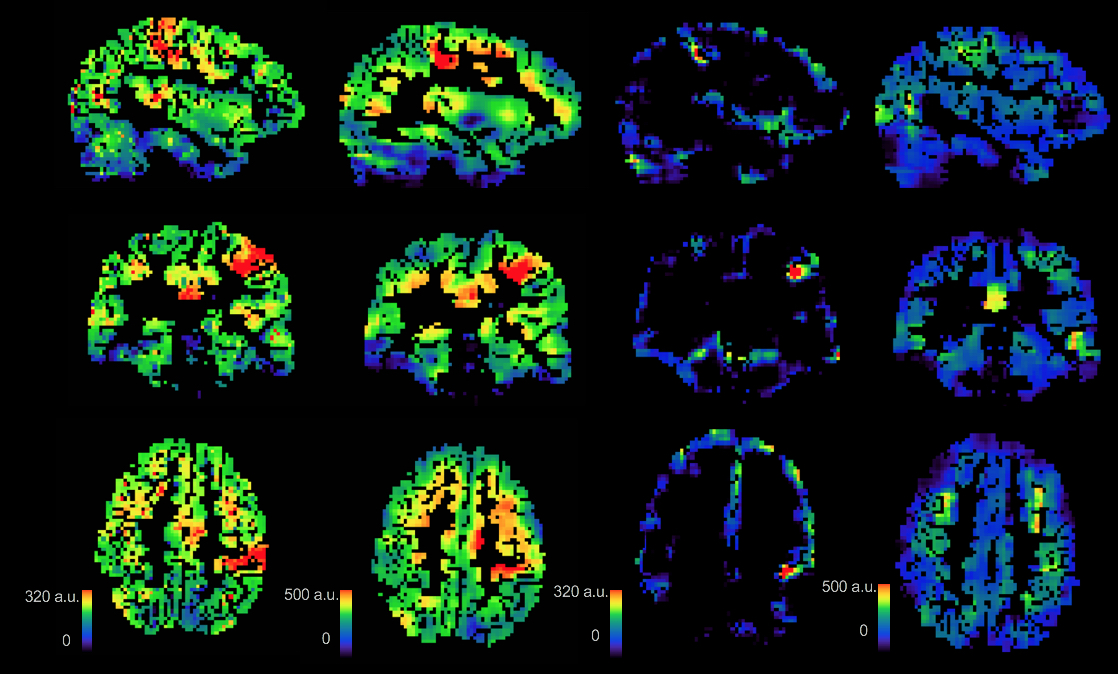
Images in the 1st and 2nd row of Fig.1 show the fractional volume maps that were used by the SLR PVC algorithm to estimate perfusion in each micro-structural compartment: intra-neurite (IN), extra-neurite (EN), and isotropic (ISO), within each tissue. Baseline micro-compartmental CBF images for PLD = 2000 ms are shown in the 3rd row. Results for the baseline CBF are summarized in Fig.2 for GM and Fig.3 for WM. Histograms in Fig.4 provide a sense of the changes in voxelwise distribution of the ASL signal with PLD for each micro-structural compartment within GM. Fig.5 shows 'raw' ASL CBF images acquired during motor activation. In the IN compartment, the subject-wise average % change in CBF during activation compared to baseline was : 68 ± 16% (PLD=1000ms) and 74 ± 21% (PLD = 2000ms); in EN, the % change in CBF was: 54 ± 12% (PLD =1000ms) and 46 ± 11% (PLD = 2000ms), (p < 0.008 for all comparisons).SUMMARY
We combined ASL with the NODDI-based anatomical information to distinguish between blood flow in the extra- and intra-neurite compartments within GM. This approach is based upon the assumption that the ASL signal is distributed across the three compartments added into the analysis. The fact that the assignment between IN and EN compartments follows the expected pattern from water diffusion in the neurovascular unit suggests that our proposed NODDI approach is functioning properly. However, considering the strong contribution of the ISO-compartment in our data, this attribution seems not be entirely correct, since low ASL signal is expected in the isotropic compartment (theorized to be mainly CSF4 where ASL should be essentially zero). We posit that this ISO-compartment in practice compensates for the presence of large arteries5. A combined vascular and IN/EN model is being implemented to further investigate this hypothesis. If successful, this method could prove invaluable in mapping blood flow with microstructural specificity.Acknowledgements
References
1Alsop DC et al. MRM, 2016; 2Asllani I et al. MRM, 2009; 3Chappell M. et al. MRM, 2011; 4Zhang H et al. NeuroImage, 2012; 5Xhang X et al., MRM 2018Figures
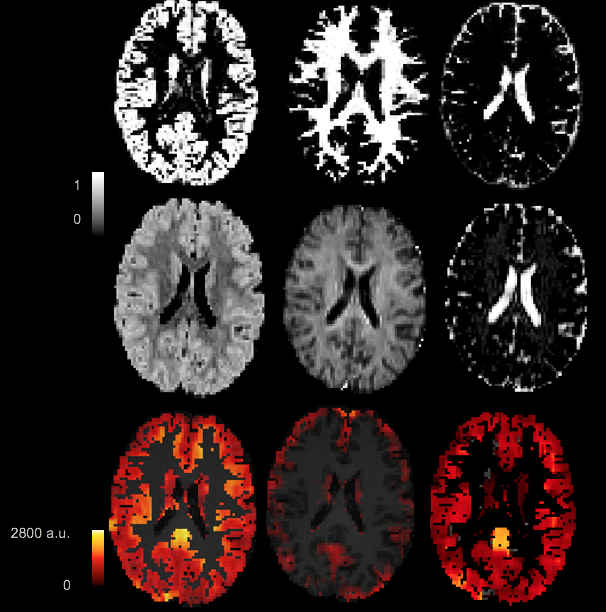
1st row: Posterior probability GM, WM, and CSF maps obtained from the segmentation of the T1w image. 2nd row: Fractional volume maps for the EN, IN, and ISO micro-compartments obtained from the NODDI analysis of the DWI data. 3rd row: Baseline micro-compartmental ASL images computed from the SLR PVC algorithm using the NODDI images.
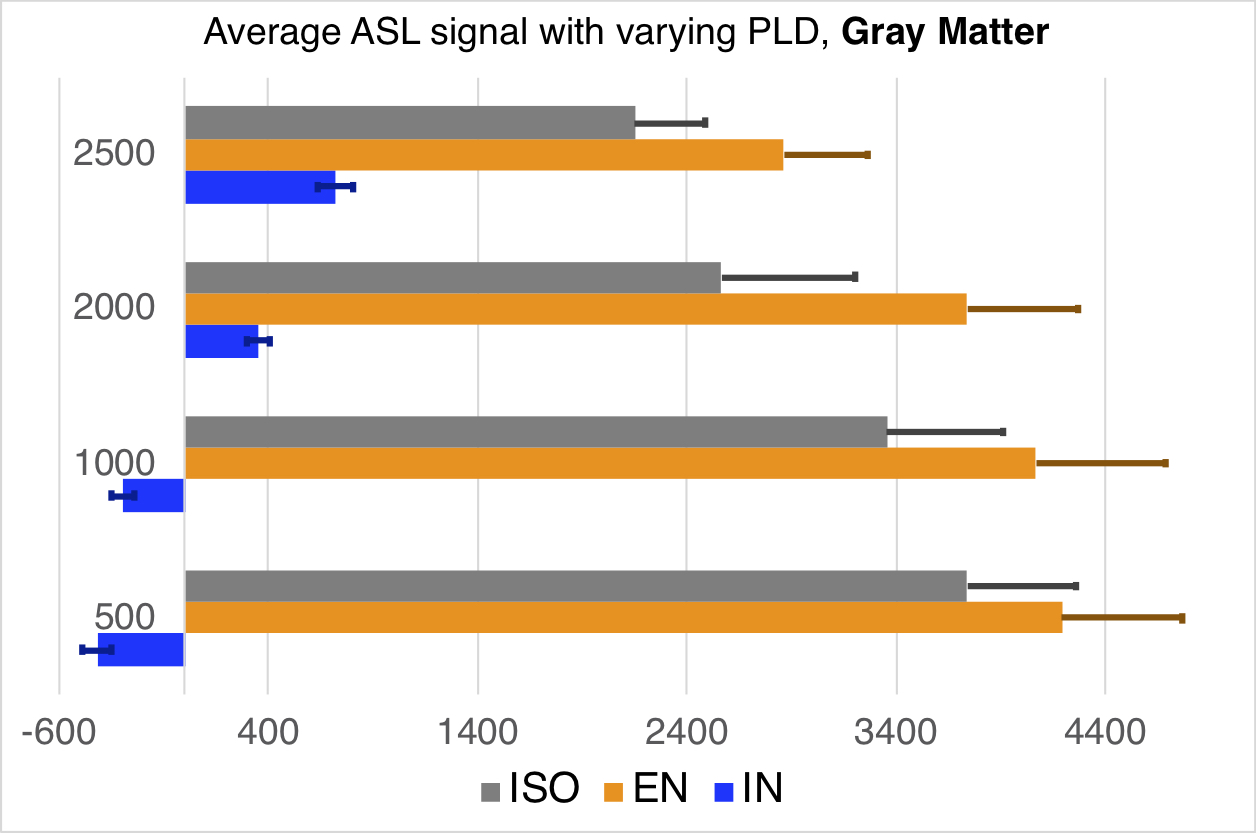
Subject-wise average of micro-compartmental GM CBF with varying PLD.
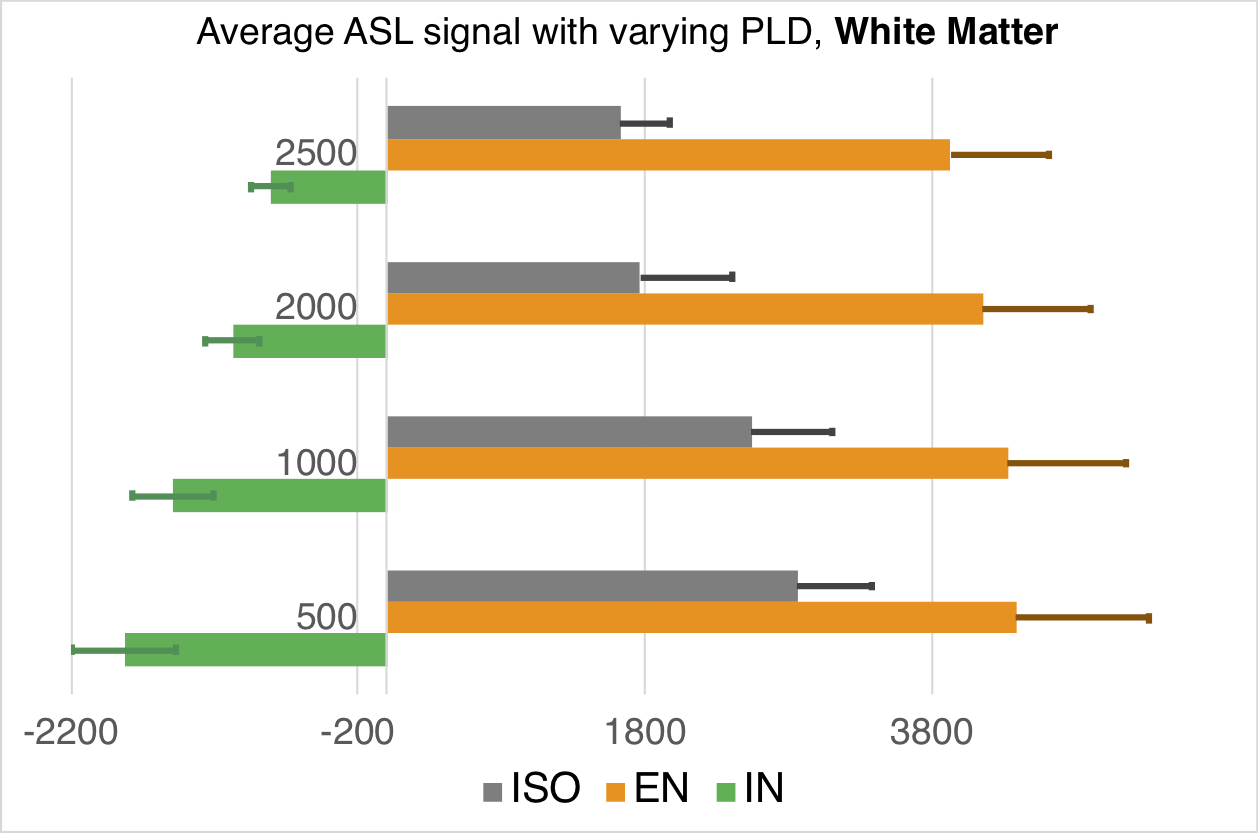
Subject-wise average of micro-compartmental WM CBF with varying PLD.
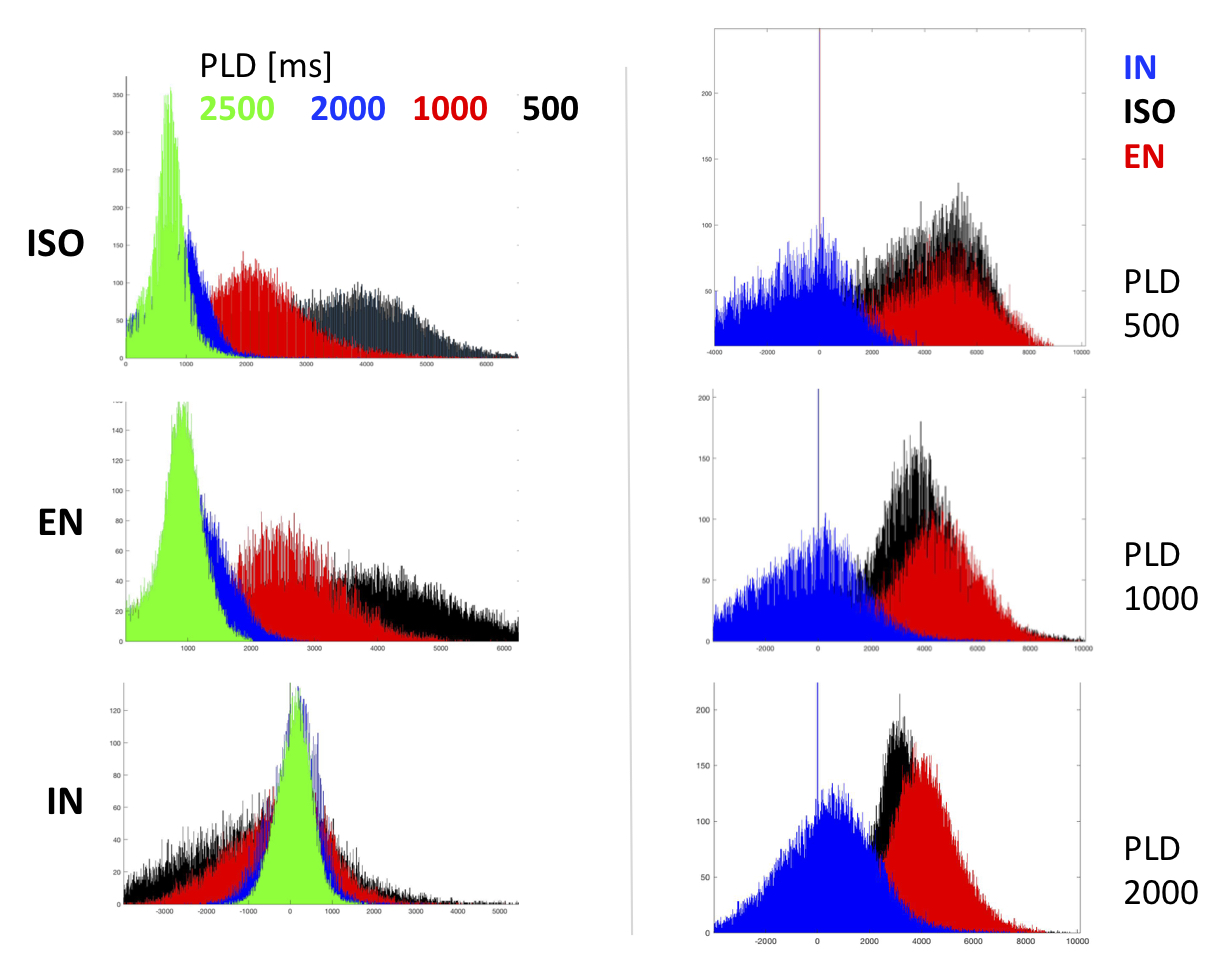
Histograms of the voxelwise distribution of the ASL signal in each micro-compartment within GM. Note that the histograms on the left were not corrected for the T1 signal decay during PLD.
"Raw" ASL images acquired during one-sided motor activation. Note that the baseline/resting ASL was not subtracted from these images.