3292
Partial volume effect correction of arterial spin labelling data using surface segmentations1Institute of Biomedical Engineering, University of Oxford, Oxford, United Kingdom, 2Wellcome Centre for Integrative Neuroimaging, University of Oxford, Oxford, United Kingdom, 3Faculty of Psychology and Neuroscience, Maastricht University, Maastricht, Netherlands
Synopsis
We have recently developed a new approach to partial volume estimation that uses surface segmentations (for example, those produced by FreeSurfer). We compare this approach to conventional volumetric PV estimation for the application of PV correction to two ASL datasets and find evidence in support of using surface-derived PV estimates.
Introduction
Partial volume effects (PVE) arise due to the low spatial resolution of ASL images in relation to the structures within the brain. The mixing of multiple tissue types (GM and WM) within voxels presents a source of confound for the analysis of ASL data. Correction for this (PVEc) requires estimates of the tissue partial volumes (PVs) present in each voxel [1], which are conventionally obtained via volumetric segmentation of a T1-weighted image. Toblerone [2] is a recently-developed alternative approach to PV estimation that uses surface segmentations (for example, via FreeSurfer [3] and FSL FIRST [4]). We evaluate this approach to PV estimation for use in the PVEc of ASL data.Research question
How does the use of surface-based PV estimates instead of volumetric PV estimates alter the results of PVEc on ASL data?Methods & datasets
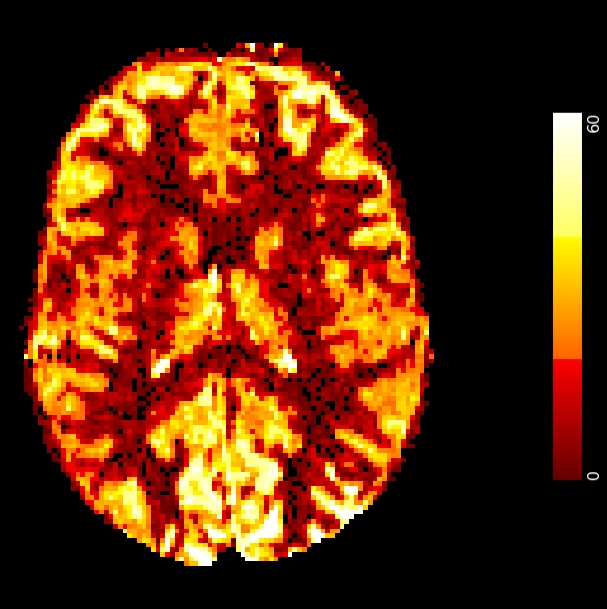
The first dataset (regarded as a silver standard) was of a single subject with 4 acquisitions, 7T pASL of 0.7s label duration and 1.8s TI with 2D EPI readout and 1.5mm isotropic voxels. Each acquisition was processed to yield a reference set of CBF estimates (fig 1). Subsequently, the acquisitions were downsampled to 3mm and 4.5mm voxel size (conventional ASL resolution) to amplify PV effects. These downsampled acquisitions were then processed with PVEc to yield corrupted CBF estimates which were finally compared with the downsampled reference estimates to assess the accuracy of PVEc in recovering the original data.The second dataset comprised 7 subjects, 34 acquisitions, pcASL with 1.4s label duration and 6 PLDs at (3.4 x 3.4 x 4.95 mm) voxel size, acquired by [5]. Each acquisition was processed (including PVEc) to yield CBF estimates.
All processing of ASL data was performed with the oxford_asl [6] pipeline, including motion correction, label-control subtraction, registration, model inversion and PVEc using a spatially-regularised variational Bayes method [7]. Surface-based PV estimates were obtained via FreeSurfer, FIRST and Toblerone; volumetric PV estimates via FAST [8]; both from structural T1 images (0.7mm iso for silver standard, 1mm iso for the multi-PLD dataset).
For both datasets, mean CBF was calculated within ROIs defined by tissue PV fraction. These were generated from the corresponding PV estimates used for the PVEc of each CBF map: voxels were sorted into histogram bins according to their GM or WM PV estimate; the same sorting was then applied to the voxels of the CBF image and the mean taken within bins and across acquisitions/subjects. The PV histograms themselves are also presented.
Results
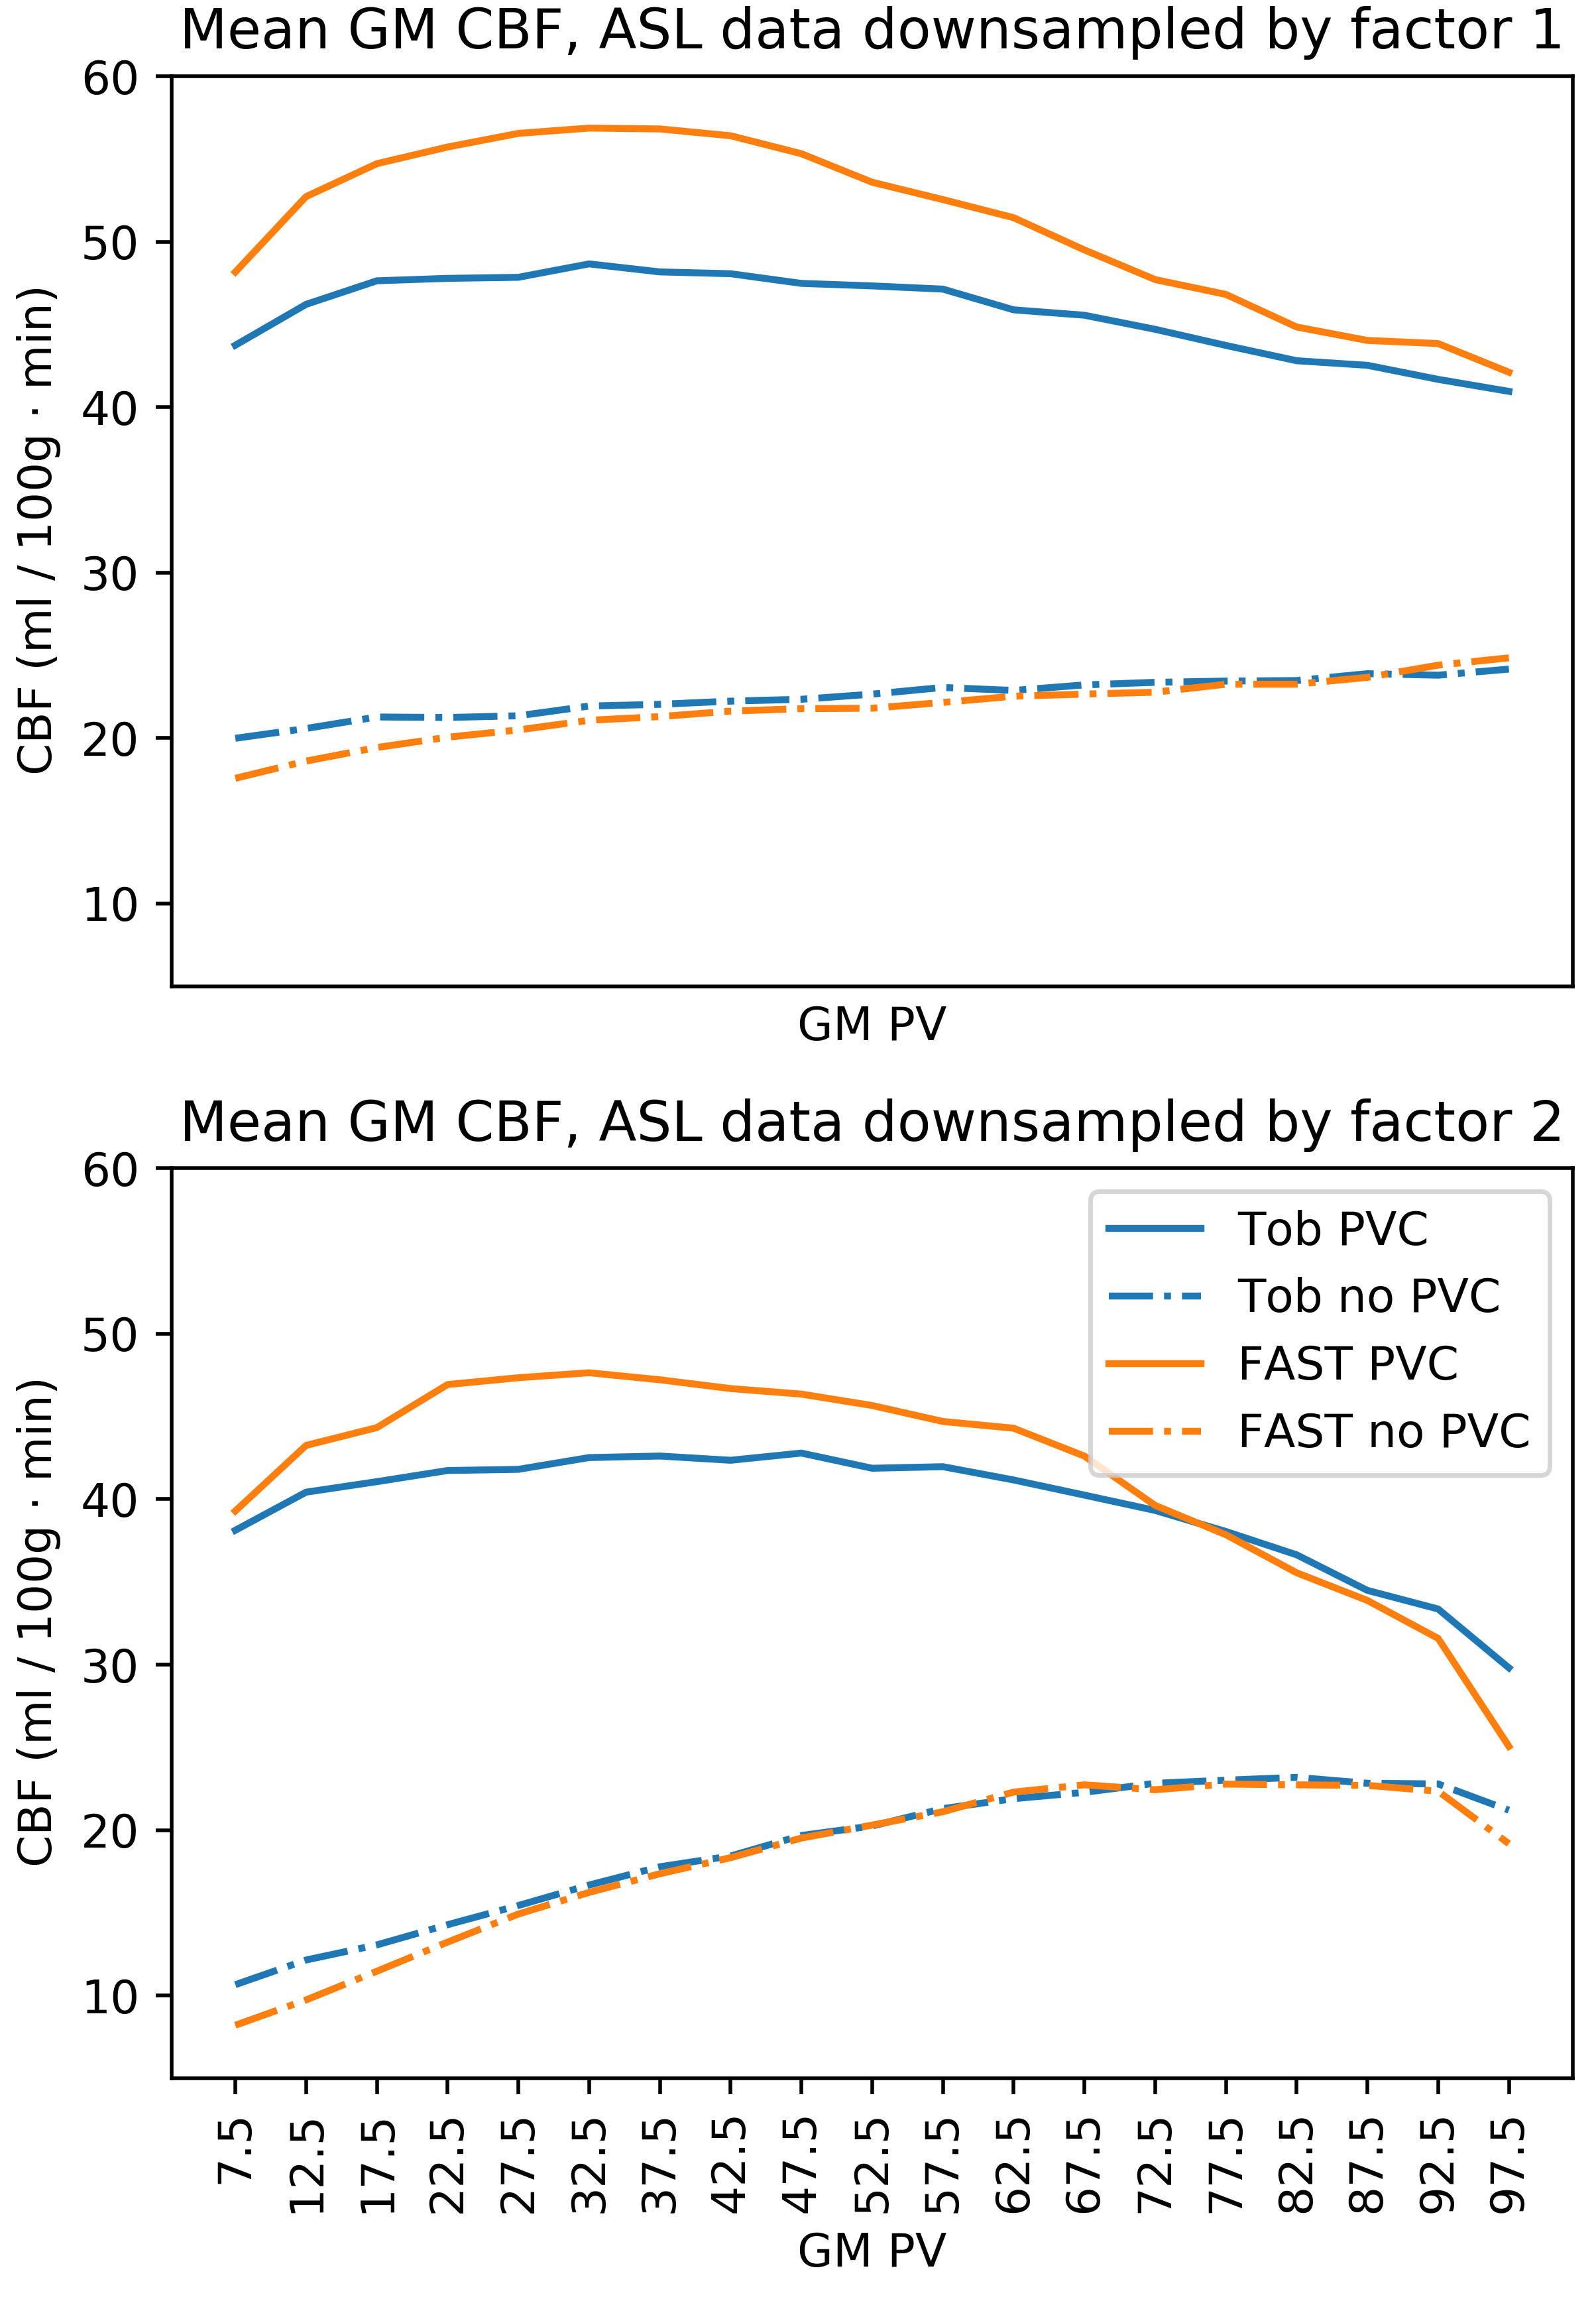
PV histograms of the silver standard dataset (fig 2) show that Toblerone identified more high GM PV voxels than FAST. This held true at the downsampled resolutions and on the multi-PLD dataset (graph not shown here).After performing PVEc on the silver standard dataset, Toblerone PV estimates led to a flatter relationship between corrected CBF estimate and tissue PV compared to FAST estimates (fig 3). This also held true at the downsampled voxel sizes.
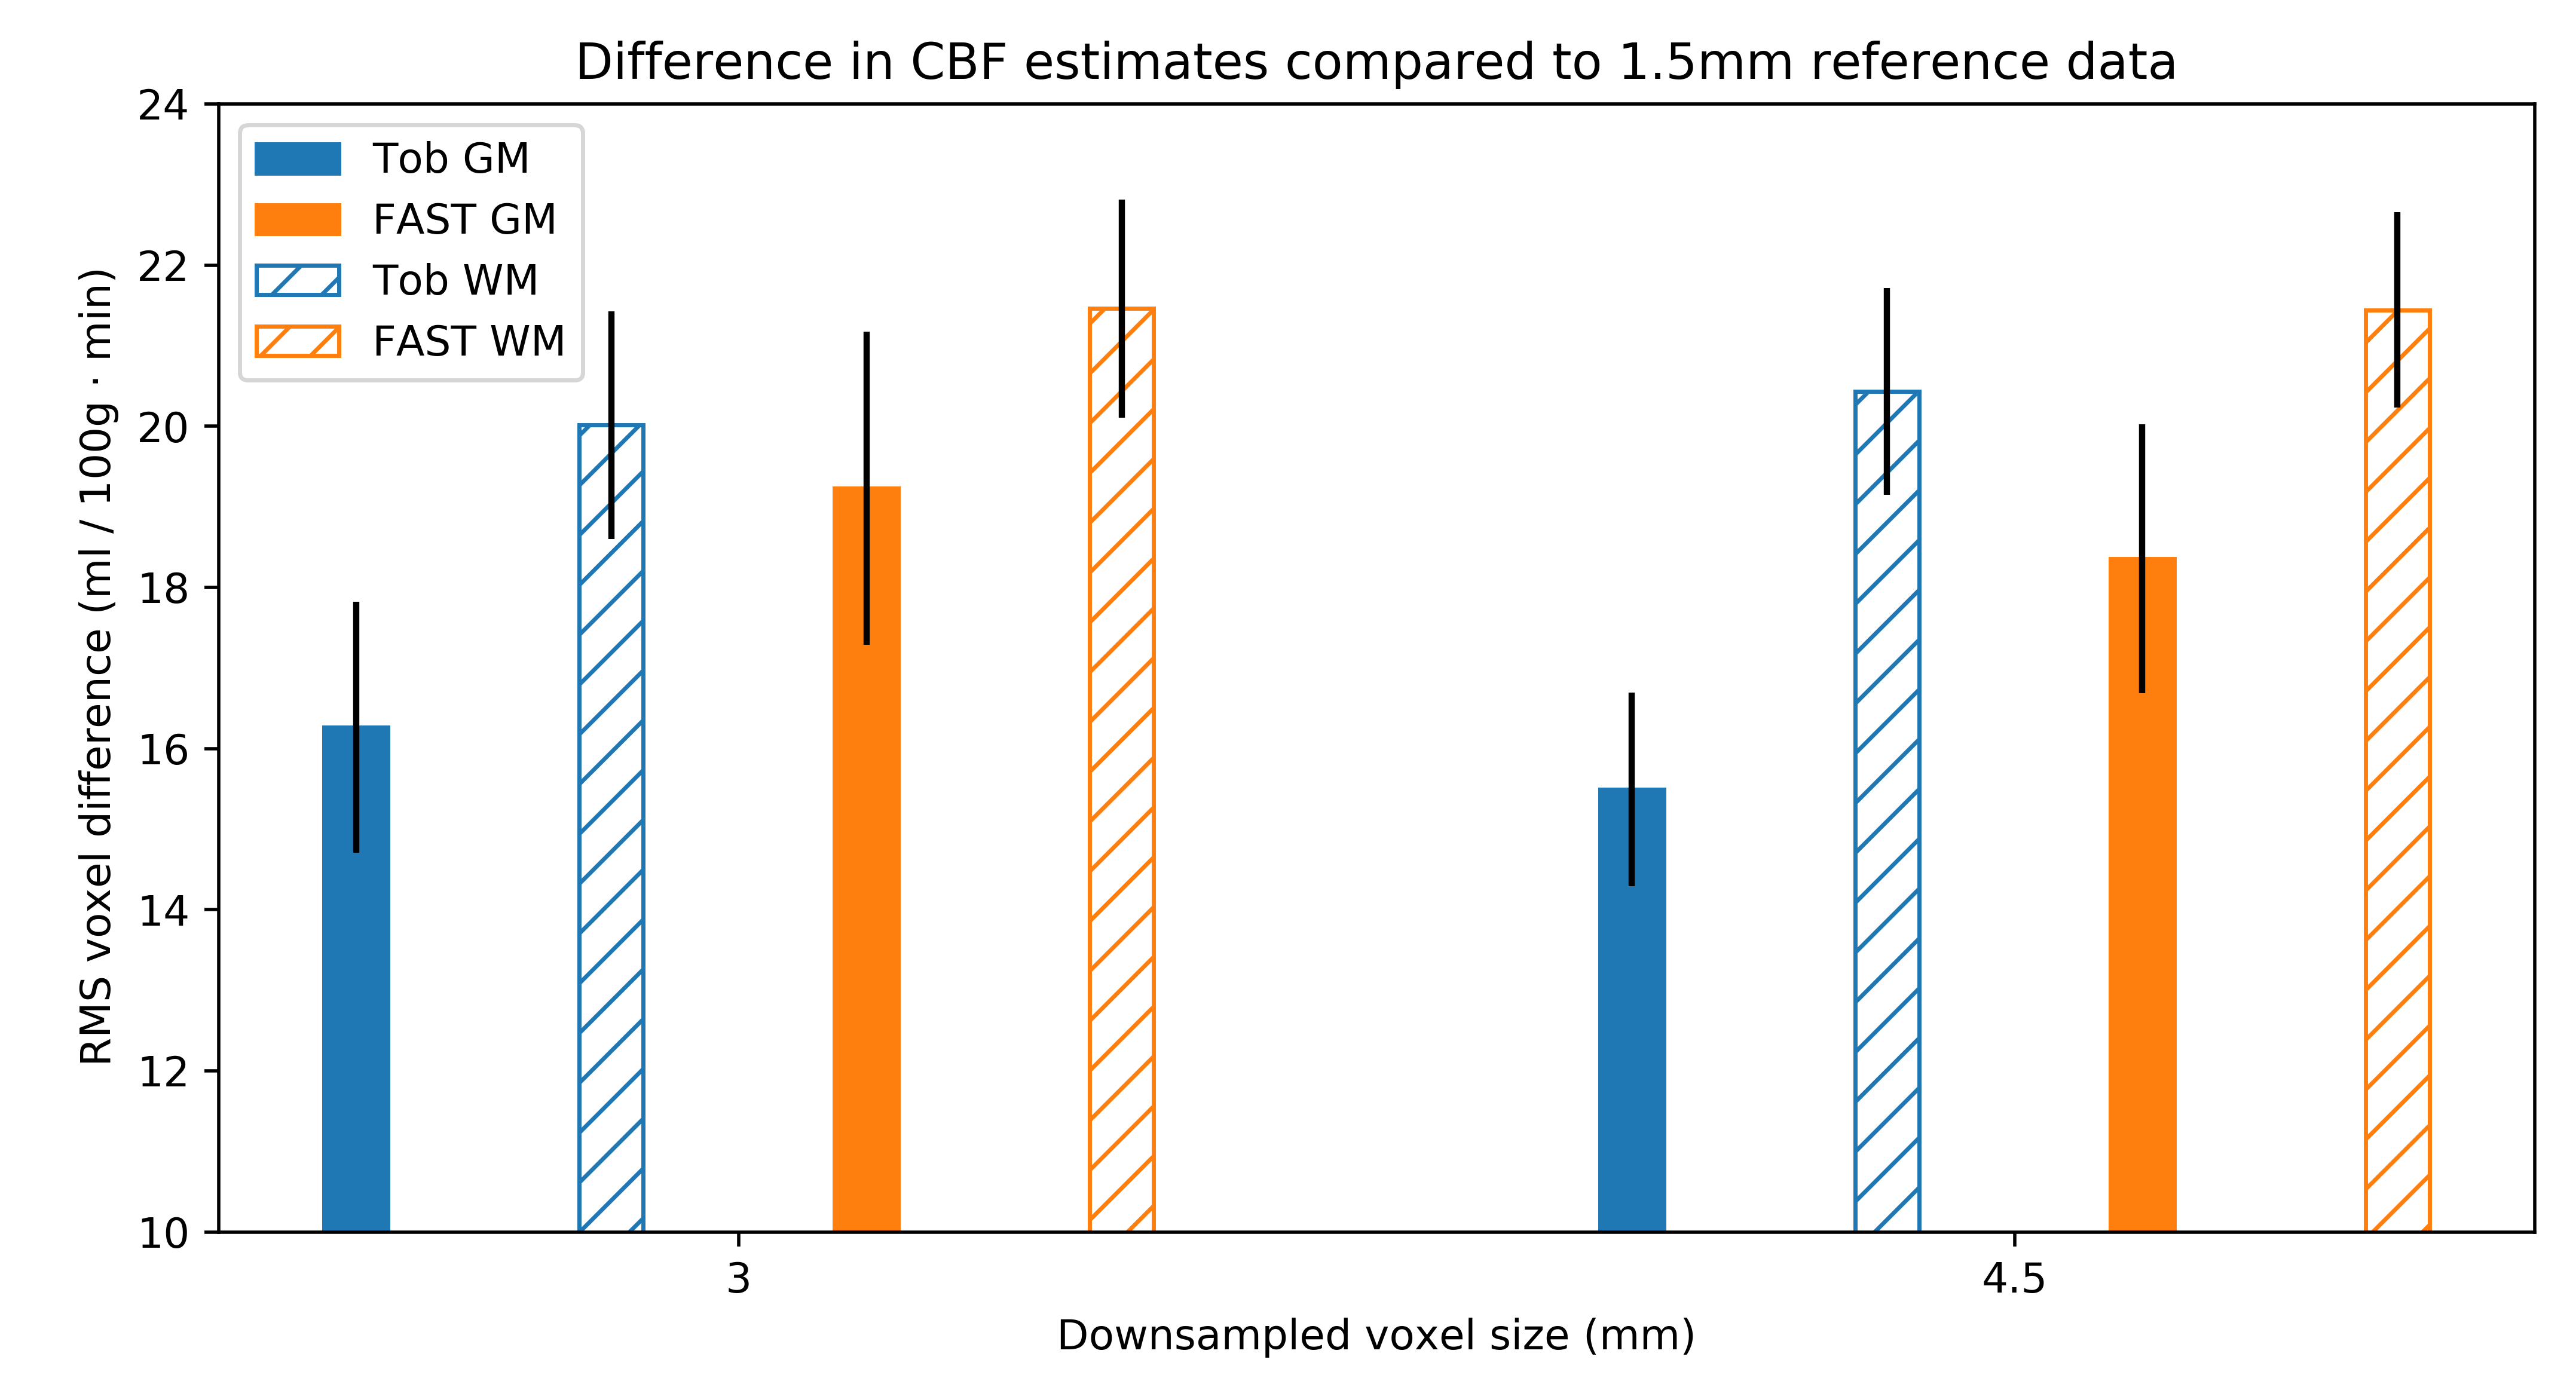
The use of Toblerone PV estimates when performing PVEc on downsampled silver standard data led to CBF estimates that were closer to the original reference values than was the case for FAST (fig 4). This was true at both levels of downsampling and in both GM and WM.
Finally, results from the multi-PLD dataset again showed a flatter relationship between corrected CBF value and GM PV with Toblerone's PV estimates (fig 5). This held true up until about 65% GM PV, beyond which the relationship broke down. Toblerone PV estimates led to lower PV-corrected GM CBF values compared to FAST and the inverse effect was seen in WM.
Discussion
On both datasets, and at all voxel sizes investigated, Toblerone identified a greater number of high GM PV voxels (fig 2). This behaviour was previously observed in [2] and may arise due to FAST being a probability-based method which could bias it away from assigning very high or very low PV estimates to voxels.Prior to PVEc, the relationship between voxel-wise CBF estimate and GM PV should be broadly linear: as GM PV increases, so should CBF. PVEc is to remove the dependency of CBF on tissue PV so that a flat relationship is obtained. This was observed, to varying extents, on both datasets (figs 3 and 5) which indicates that PVEc is functioning as desired. Toblerone PV estimates led to flatter corrected plots being obtained, particularly in GM. For larger voxel sizes, the flat relationship between corrected CBF and PV broke down at higher GM PV (particularly noticeable on fig 5 beyond 65% GM PV).
Finally, the use of the silver standard dataset to assess the accuracy of PVEc showed that Toblerone's PV estimates led to better recovery of the reference CBF estimates compared to FAST (fig 4). This was true for both GM and WM and at each resolution.
Conclusion
Surface-based PV estimates identified more high GM PV voxels, which in turn altered the results of PVEc: we observed a flatter relationship between PV-corrected CBF and GM PV which is the desired outcome of PVEc. Following the introduction of PV effects into silver-standard reference data, we found that PVEc using surface-based PV estimates was better able to recover the reference data compared to a volumetric method.Acknowledgements
The authors gratefully acknowledge Kamil Uludag, previously of Maastricht University, who secured funding for the acquisition of the 7T data; the EPSRC (funding via EP/P012361/1), the Wellcome Centre for Integrative Neuroimaging (Centre grant 203139/Z/16/Z) and the Bellhouse Scholarship at Magdalen College, Oxford (funding for T. Kirk).References
[1] Asllani, I, (2008), Regression algorithm correcting for partial volume effects in arterial spin labeling MRI, Magnetic Resonance in Medicine
[2] Kirk, T et al (2019), Toblerone: surface-based partial volume estimation, IEEE Transactions on Medical Imaging (accepted for publication Oct-2019)
[3] Fischl, B, (2012), FreeSurfer, Neuroimage
[4] Patenaude, B, (2011), A Bayesian model of shape and appearance for subcortical brain segmentation, Neuroimage
[5] Mezue, M, Segerdahl, A, (2014) Optimization and reliability of multiple postlabeling delay pseudo-continuous arterial spin labeling during rest and stimulus-induced functional task activation, Journal of cerebral blood flow and metabolism
[6] https://fsl.fmrib.ox.ac.uk/fsl/fslwiki/BASIL
[7] Chappell, M, (2009), Partial volume correction of multiple inversion time arterial spin labeling MRI data, IEEE Transactions on Signal Processing
[8] Zhang, Y, (2001), Segmentation of brain MR images through a hidden Markov random field model and the expectation-maximization algorithm, IEEE Transactions on Medical Imaging
Figures