3287
Examination of optimised PLD protocols for pCASL: accounting for dispersion and macrovascular contamination over a prolonged ATT range1Institute of Biomedical Engineering & Wellcome Centre for Integrative Neuroimaging, University of Oxford, Oxford, United Kingdom, 2Department of Radiology, University of California San Diego, La Jolla, CA, United States
Synopsis
A general framework has been proposed for optimising PLD sampling protocols in pCASL under an ideal kinetic model. In this study, the performance of CBF and ATT estimation of two optimised protocols CBF-ATTopt and CBFopt, along with a reference multi-PLD and single-PLD protocol, was investigated using simulations and in vivo when accounting for dispersion and macrovascular contamination (MVC) over a prolonged ATT range. CBFopt showed the least sensitivity among all protocols for CBF estimation when ATT was prolonged and when MVC was present. Future work can optimise for both macrovascular component and tissue component with a prolonged ATT range.
Introduction
In pseudo-continuous arterial spin labelling (pCASL), one or multiple post-labelling delays (PLD) are used before image readout to allow inverted spins to perfuse into the target tissue. Recently, a general framework was proposed for optimising PLD sampling protocols for pCASL using the Cramer-Rao Lower Bound 1. Two optimised protocols from this study, CBF-ATTopt and CBFopt, showed lower error in their respective parameter estimation. However, the assumption of an ideal kinetic model used in this framework may not hold true due to physiological effects such as dispersion and macrovascular signal contamination (MVC). Prolonged arterial transit times (ATT) seen in cerebrovascular disease and deep white matter could also lead to large estimation errors. This work examines the two optimised protocols, along with a reference multi-PLD protocol and a single-PLD protocol, under the effects of dispersion and MVC over a prolonged ATT range. We demonstrate how the resulting error in estimation would change if the artefacts were prominent (i.e. the ‘sensitivity’) using simulations and in vivo data.Methods
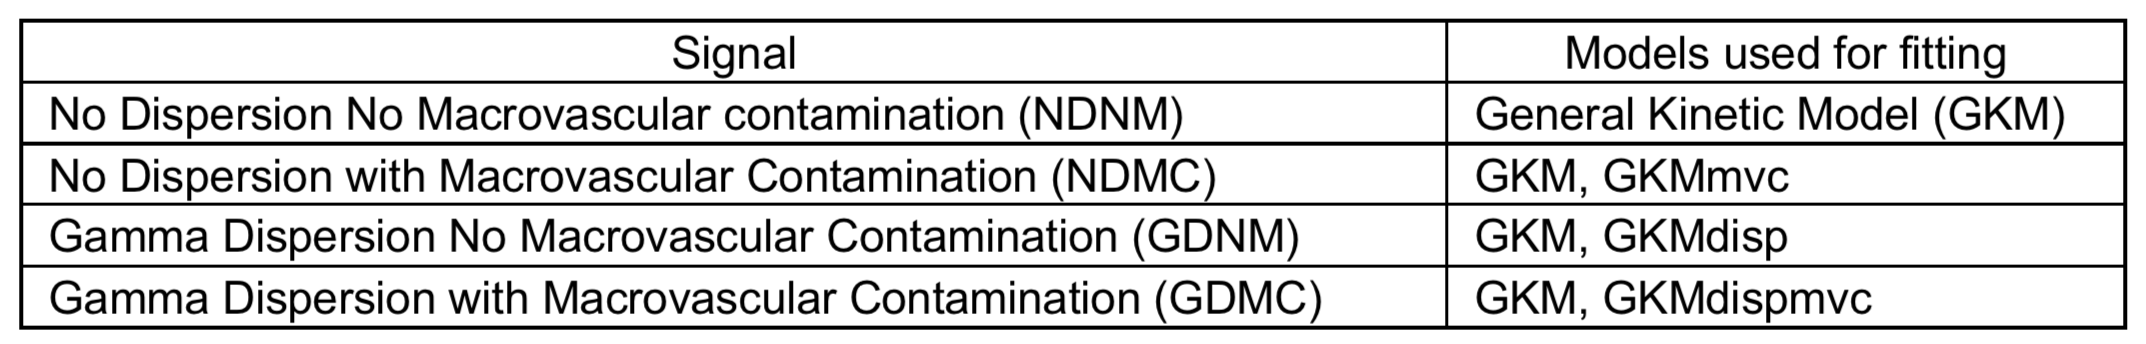
Simulation experimentsFor each PLD protocol, four types of pCASL signals were simulated using MATLAB from the general kinetic model 2 with/without a Gamma dispersion kernel 3 and macrovascular signal component 4: NDNM, NDMC, GDNM, GDMC. Gaussian white noise was added to the signal to give an SNR of 10 5. Depending upon whether or not dispersion and MVC were individually accounted for, four fitting models were used in the BASIL toolkit of FSL: GKM, GKMmvc, GKMdisp, GKMdispmvc (see definition in Table 1). Noisy signals were fitted with these models, and then averaged over 2000 simulations for a range of simulated ATT and arterial blood volume (aBV%).
In vivo experiments
In vivo data of seven healthy volunteers were retrospectively analysed from [1]. The pCASL imaging parameters were: 2D-EPI, 5 slices, voxel size = 3.4 x 3.4 x 5 mm3, 20° pCASL flip angle, 1.4s label duration, and flow crusher vthres = 4cm/s. Cerebral blood flow (CBF) and ATT estimates were obtained by fitting the data of each protocol with the four models. The estimates were then binned and averaged with 0.025s ATT or 0.04 aBV% interval across all subjects. Ground truth CBF and ATT estimates were obtained by fitting the combined data from all four protocols. Voxel selection conditions were the same as in [1] and were restricted by the parameter range of interest (0.5s < ATT < 3.0s, 0.0 < aBV% < 2.0).
Results and Discussion
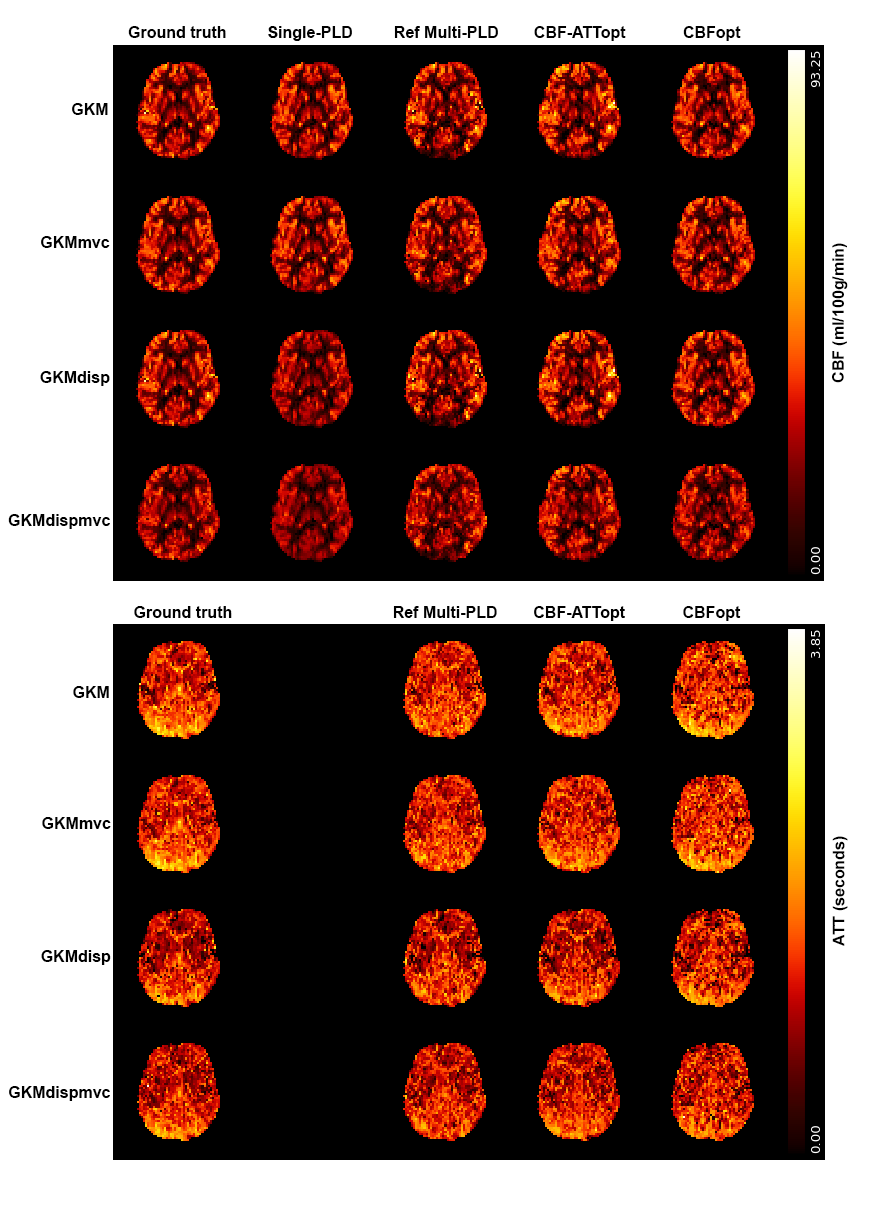
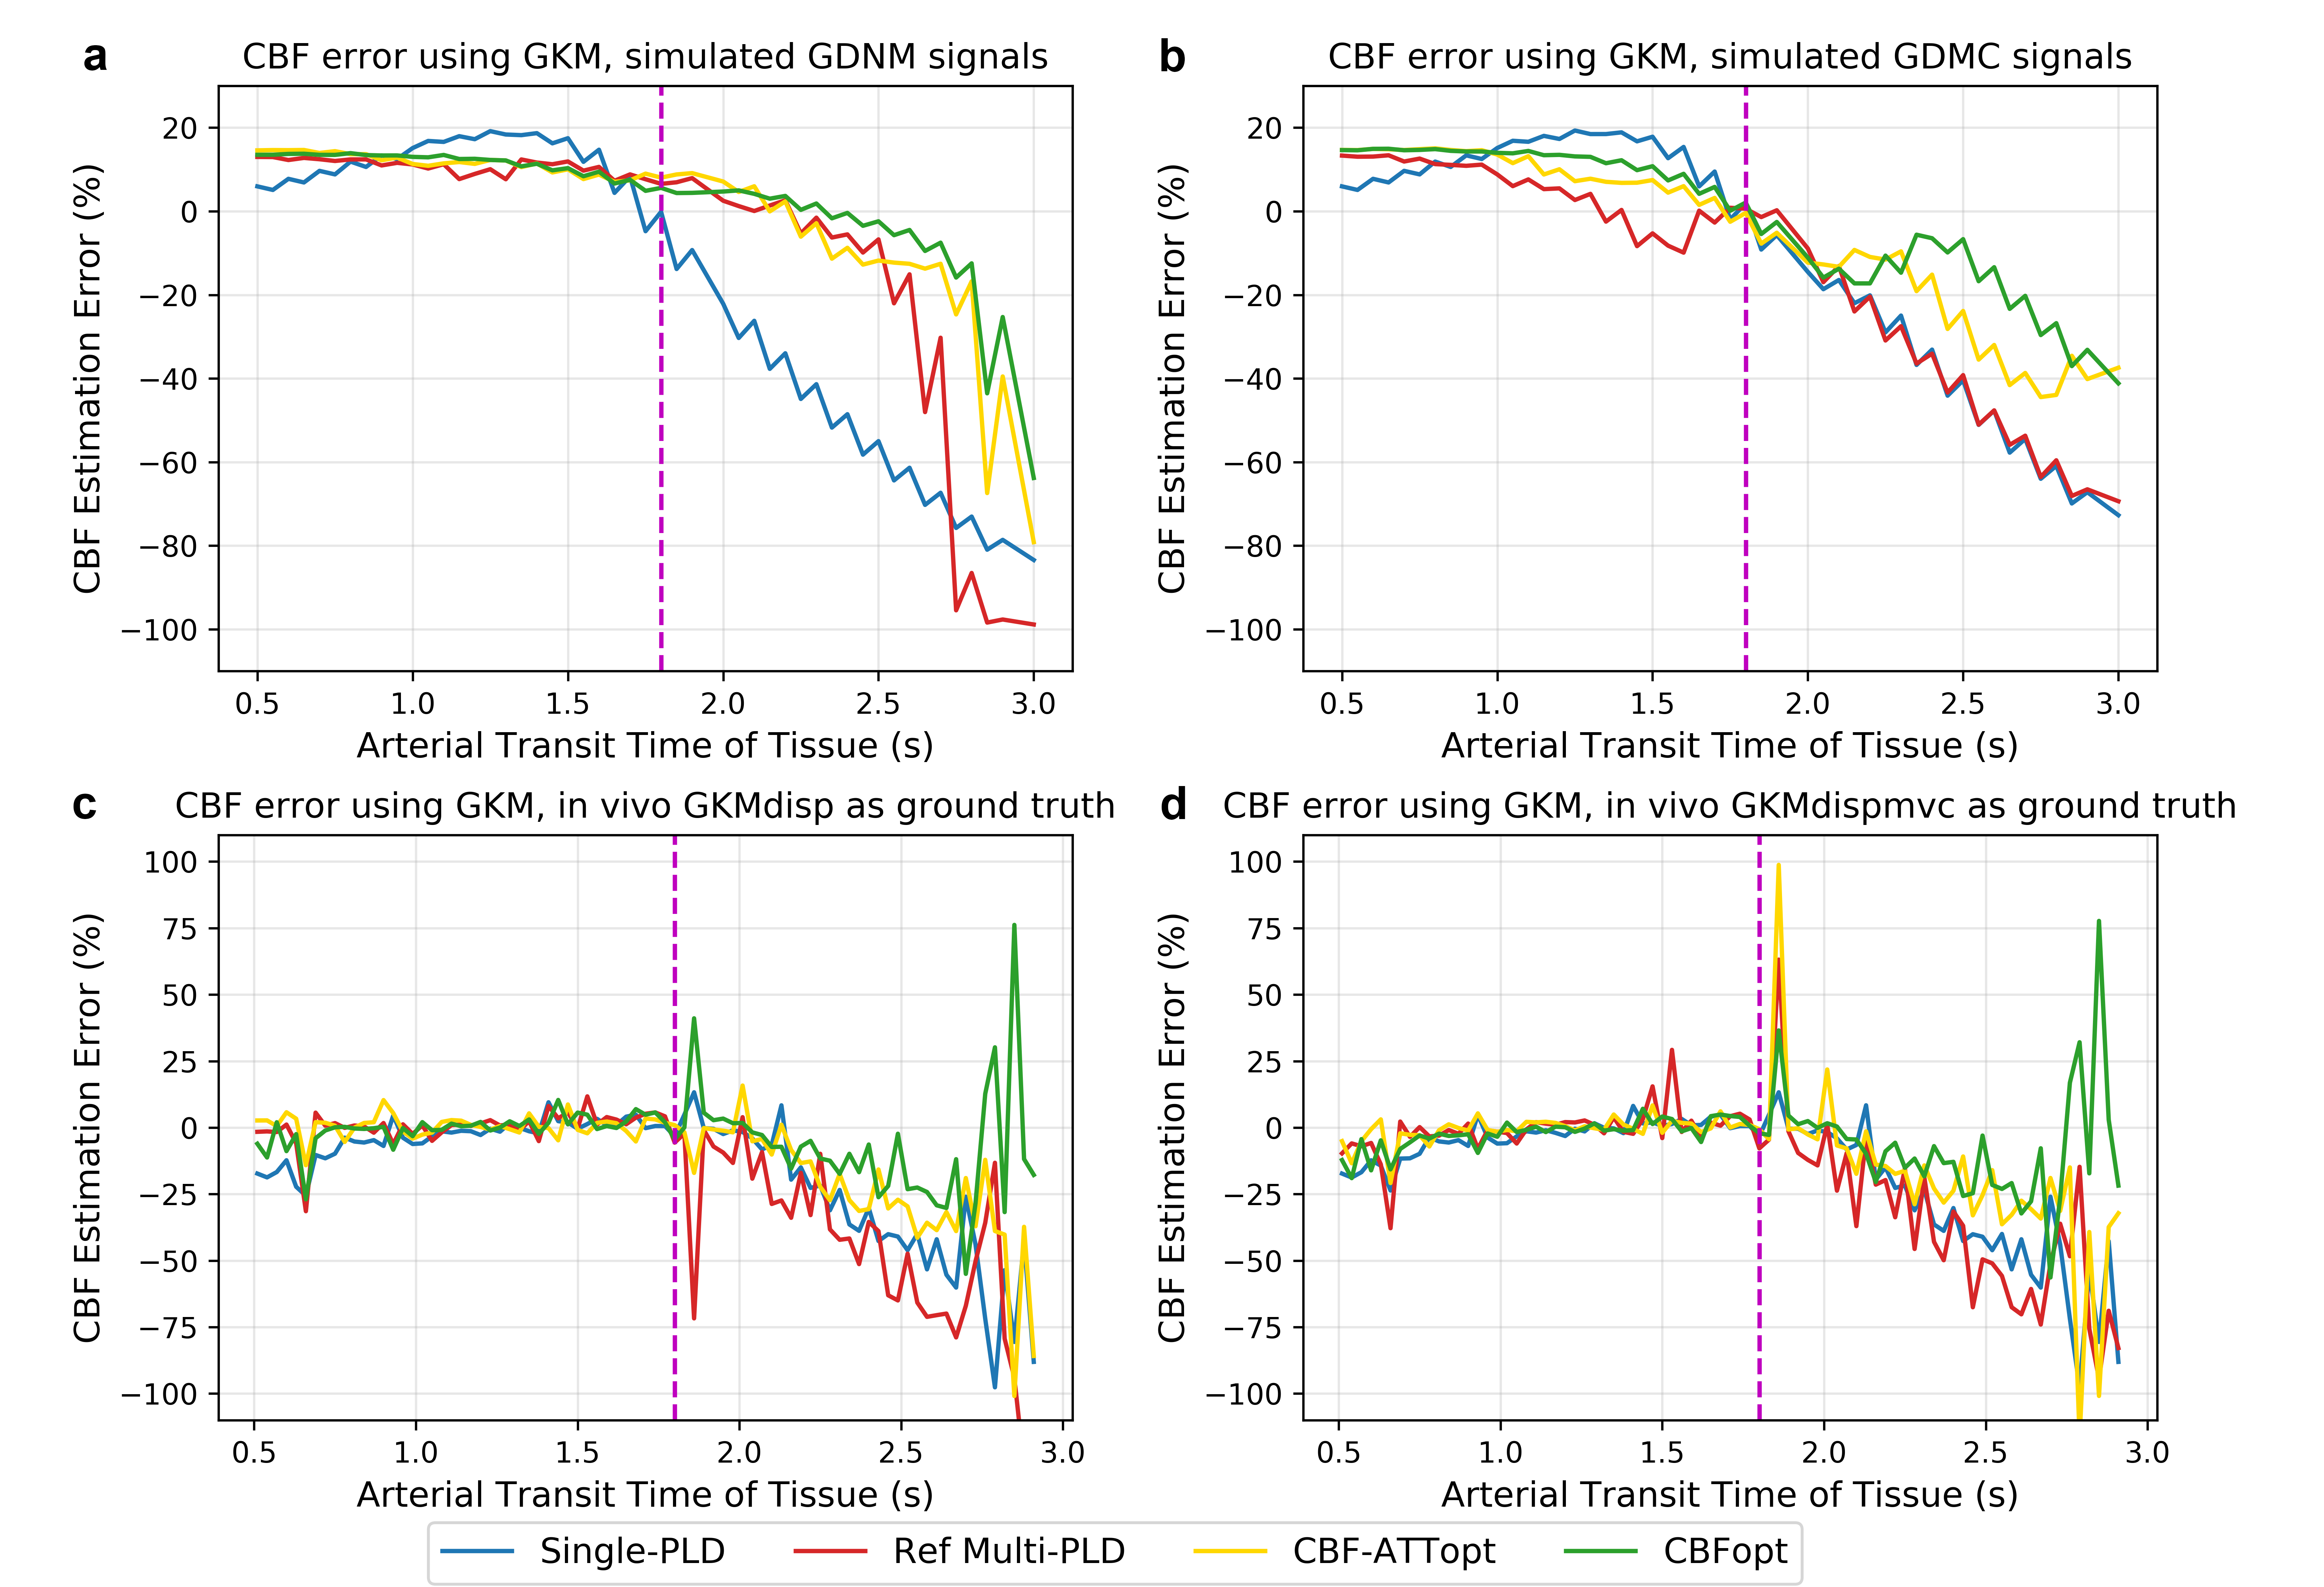
For simulation experiments, mean CBF and ATT estimates and associated errors were obtained for each condition. For in vivo experiments, 1216 voxels have been identified as having prolonged ATT (6.17% of all GM voxels) and 1268 voxels as having prominent macrovascular signals (13.32% of all GM voxels) across all subjects. Representative CBF and ATT estimation maps from one subject are shown in Figure 1. Reasonably good agreement can be found between different protocols and fitting models. Although much of the macrovascular signal had been saturated by the crusher gradients, evidence of MVC can still be seen in some cortical voxels in reference multi-PLD and CBF-ATTopt, which appeared as higher CBF estimation. CBFopt appeared to be in best agreement with the ground truth estimates.Figure 2 shows CBF errors for different protocols over a prolonged ATT range in simulation and in vivo using GKM as the fitting model. With dispersion present, all protocols overestimated CBF at shorter ATT and underestimated CBF at prolonged ATT in simulated data. CBFopt had the smallest estimation error at prolonged ATT with/without macrovascular contamination, as shown by both simulations and in vivo.
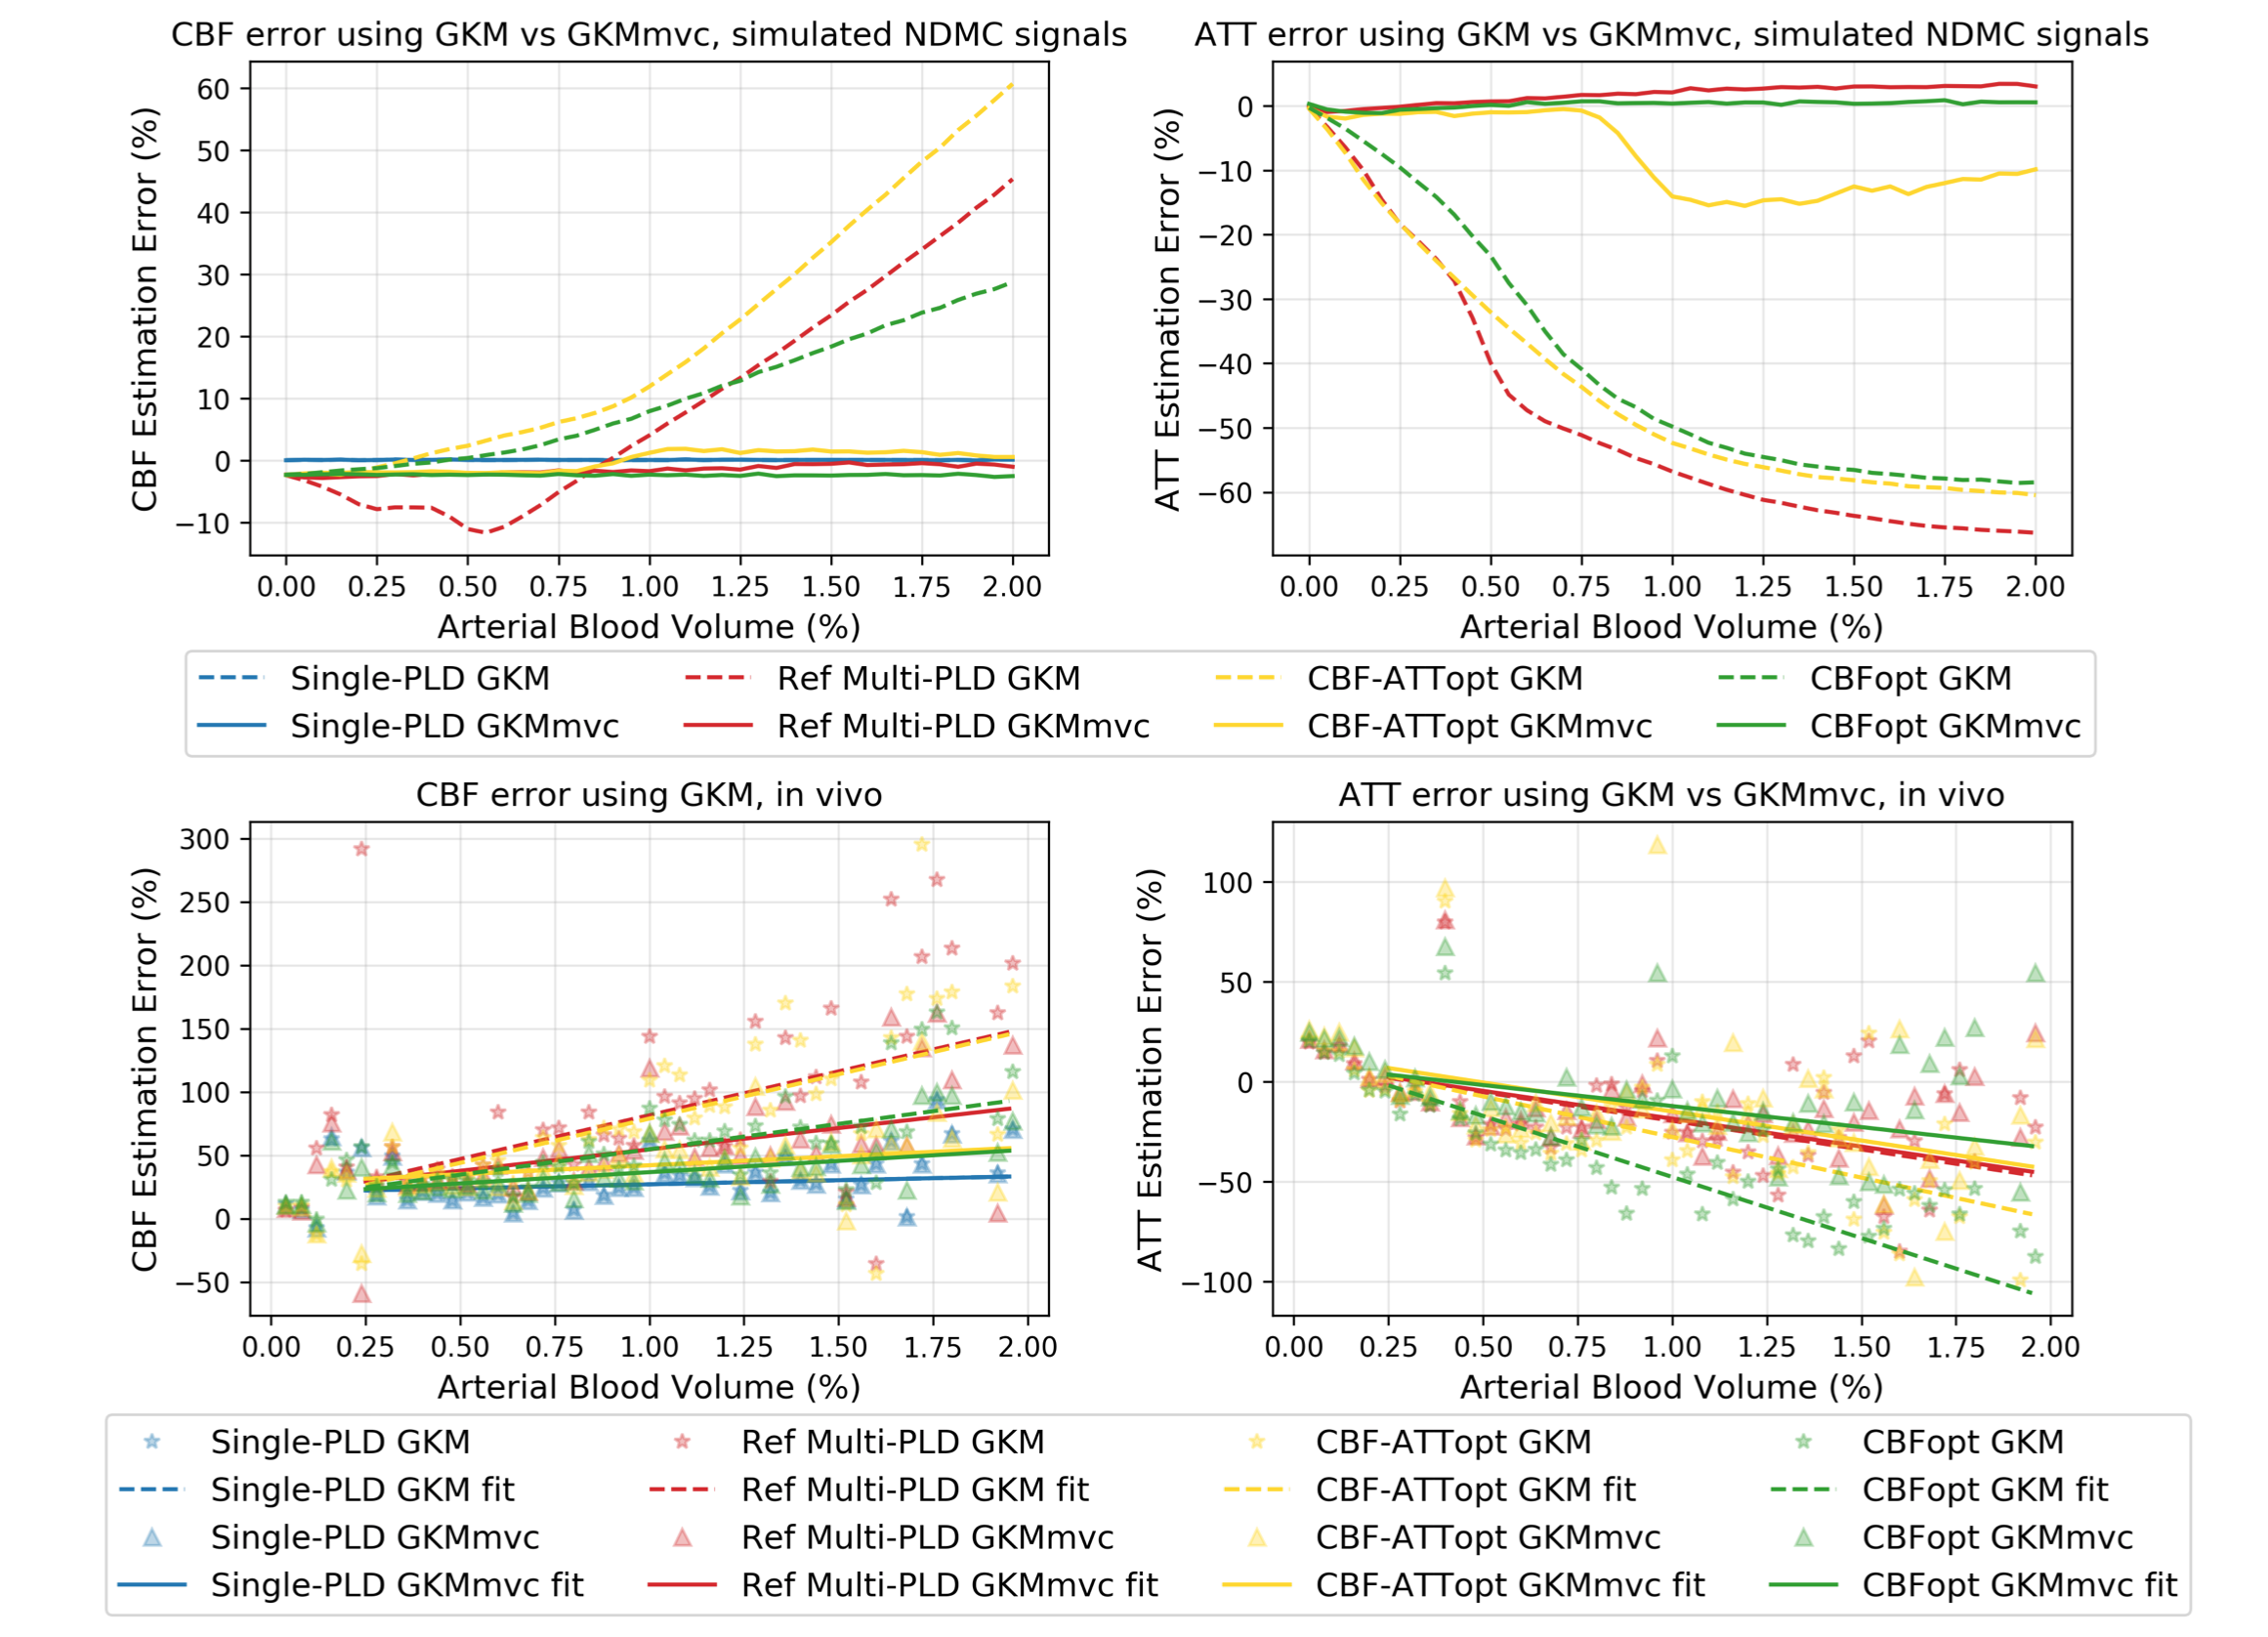
When aBV% increased, CBF was found to be overestimated whilst ATT underestimated when using GKM as the fitting model (Figure 3). We calculated the slope of the near-linear part of the curve in simulation experiments as a measure of CBF estimation ‘sensitivity’ to aBV%. CBFopt had the sensitivity of 12.65 (unit: error%/aBV%, same below), approximately half of reference multi-PLD (24.68) and CBF-ATTopt (29.72). Despite having different ground truth CBF values, similar relations can also be seen using in vivo data, where the sensitivity of CBFopt (40.08) was much smaller than reference multi-PLD (69.17) and CBF-ATTopt (69.95). CBF and ATT errors were reduced when including an MV component in the kinetic model (GKMmvc), which can be seen both in simulations and in vivo.
We have demonstrated that among the four protocols examined, CBFopt showed the smallest CBF estimation error when ATT is prolonged. When macrovascular contamination is present, CBFopt remained the least sensitive to higher aBV% in estimating CBF while maintaining reasonably good performance in estimating ATT. While one may argue that these optimised protocols are not designed for estimation under abnormal conditions, the results shed light on how much error these protocols could generate should the additional physiological effects be present in vivo. The similar pattern found between simulations and in vivo data also indicates there might be incomplete elimination of MV signals using crusher gradients, as previously shown in [4]. The original framework could also be modified to design other protocols that are optimised for these conditions, such as including aBV% and macrovascular bolus arrival time in optimisation over a prolonged range of tissue ATT.
Acknowledgements
This work received funding from the Engineering and Physical Sciences Research Council (EP/P012361/1). The Wellcome Centre for Integrative Neuroimaging is supported by core funding from the Wellcome Trust (203139/Z/16/Z).References
1. Woods, Joseph G., Michael A. Chappell, and Thomas W. Okell. "A general framework for optimizing arterial spin labeling MRI experiments." Magnetic resonance in medicine81.4 (2019): 2474-2488.
2. Buxton, Richard B., et al. "A general kinetic model for quantitative perfusion imaging with arterial spin labeling." Magnetic resonance in medicine 40.3 (1998): 383-396.
3. Chappell, Michael A., et al. "Modeling dispersion in arterial spin labeling: validation using dynamic angiographic measurements." Magnetic resonance in medicine 69.2 (2013): 563-570.
4. Chappell, Michael A., et al. "Separation of macrovascular signal in multi‐inversion time arterial spin labelling MRI." Magnetic resonance in medicine 63.5 (2010): 1357-1365.
5. Mehta, Rutej R., and Michael A. Chappell. "Quantification of errors in cerebral blood flow measurements due to dispersion in arterial spin labelling." 2015 37th Annual International Conference of the IEEE Engineering in Medicine and Biology Society (EMBC). IEEE, 2015.
Figures