3284
Mitigating spurious transit time artifacts in background-suppressed multi-delay 3D pseudo-continuous ASL using inflow suppression1Chinese Academy of Medical Sciences, Peking Union Medical College, PUMCH, Beijing, China, 2University of Pennsylvania, Perelman School of Medicine, Philadelphia, PA, United States
Synopsis
The purpose of our study was to demonstrate that the inflow of arterial blood in post-labeling delay can cause intravascular high signal in multi-PLD ASL that resembles arterial transit artifact and potentially interfere with clinical interpretation. An optimized inflow-saturation method was used to suppress this artifact and improve the image quality of Hadamard-encoded and sequential multi-PLD ASL.
Introduction
Single post-labeling delay (PLD) ASL shows increased intravascular signal, known as arterial transit artifact (ATA), and underestimates cerebral blood flow(CBF) in regions with prolonged transit. Multi-PLD ASL can address this limitation by estimating CBF along with arterial transit time(ATT) 1,2. Multi-PLD ASL can be acquired by either sequential acquisitions or using a more time-efficient encoding strategy—Hadamard-encoding. In this work, we demonstrate that inflow fluctuations of arterial blood can cause artifactual ATA in multi-PLD ASL.Methods
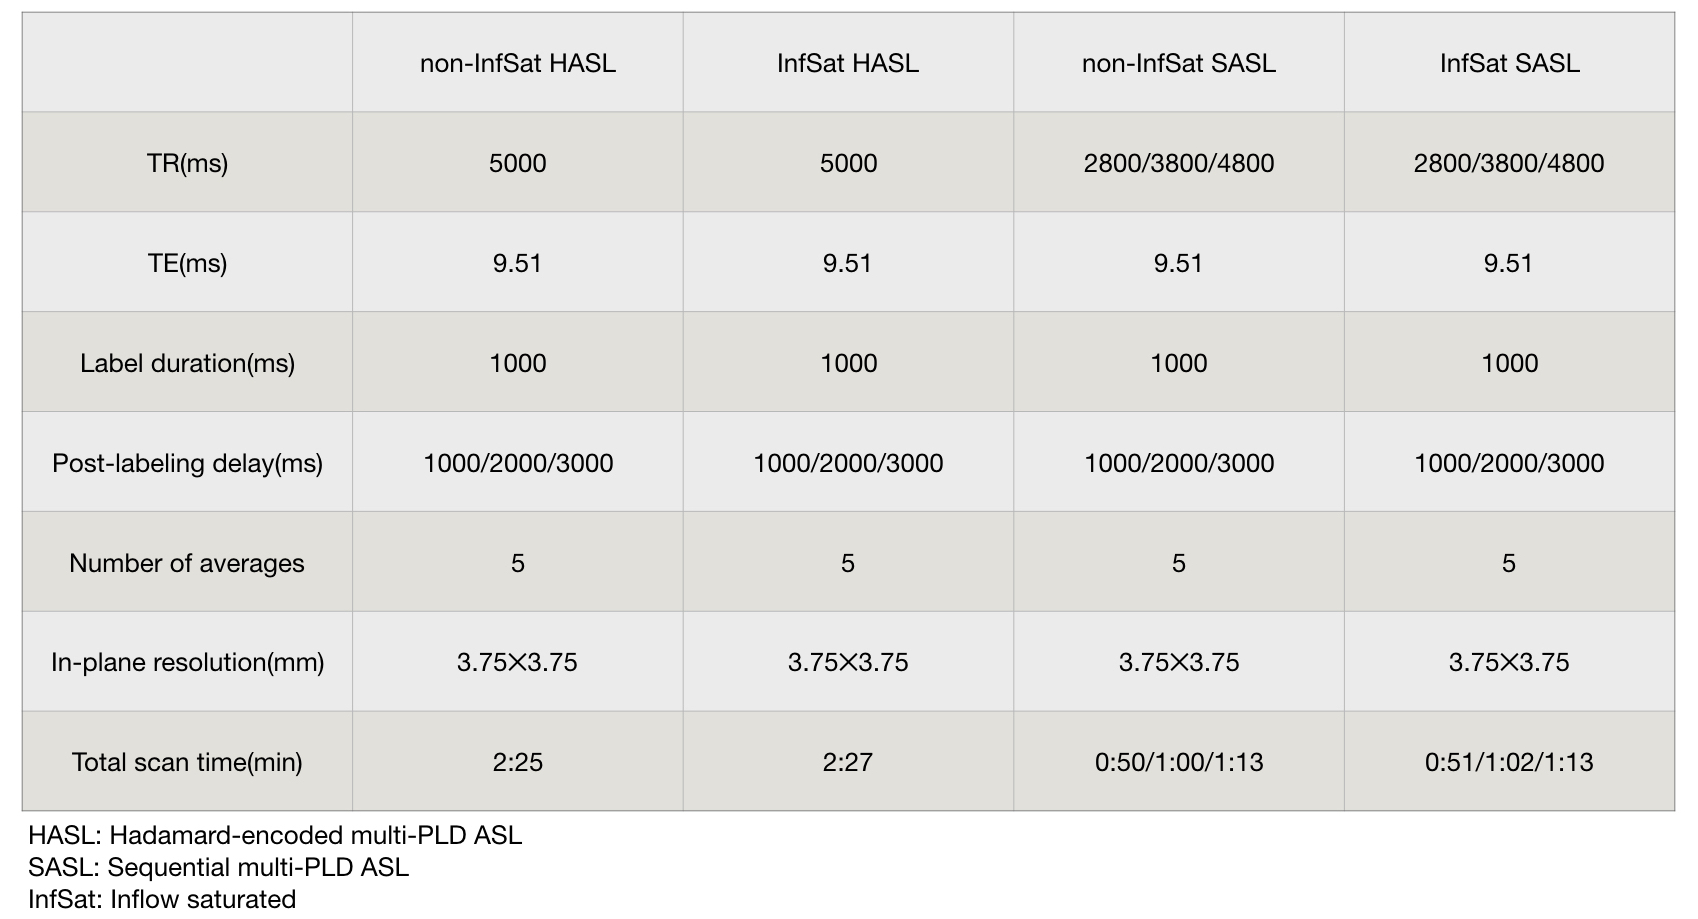
Three healthy subjects(age 40.3±17.1yr) were scanned on a 3T scanner (Siemens Prisma) using a 32-channel head coil. The MRI protocol included a TOF MR angiography used to position the labeling plane, T1-weighted anatomical images, and both sequential 3-delay ASL (SASL) and Hadamard-encoded 3-delay ASL (HASL) acquired without inflow saturation or with an optimized serial saturation method consisting of multiple saturation bands so as to null inflow at the acquisition time, see schematic diagram in Figure 1 and ASL parameters in Table 1. Pseudo-continuous ASL (pCASL) was acquired using a single-shot accelerated stack of spiral 3D fast spin echo readout and two background-suppression pulses achieving a suppression efficiency of 90%. Transit time was calculated through a signal-weighted delay method1. Perfusion weighted images (control-label) of every single acquisition at different PLDs and transit time maps with and without optimized inflow saturation were compared visually.Results and Discussion
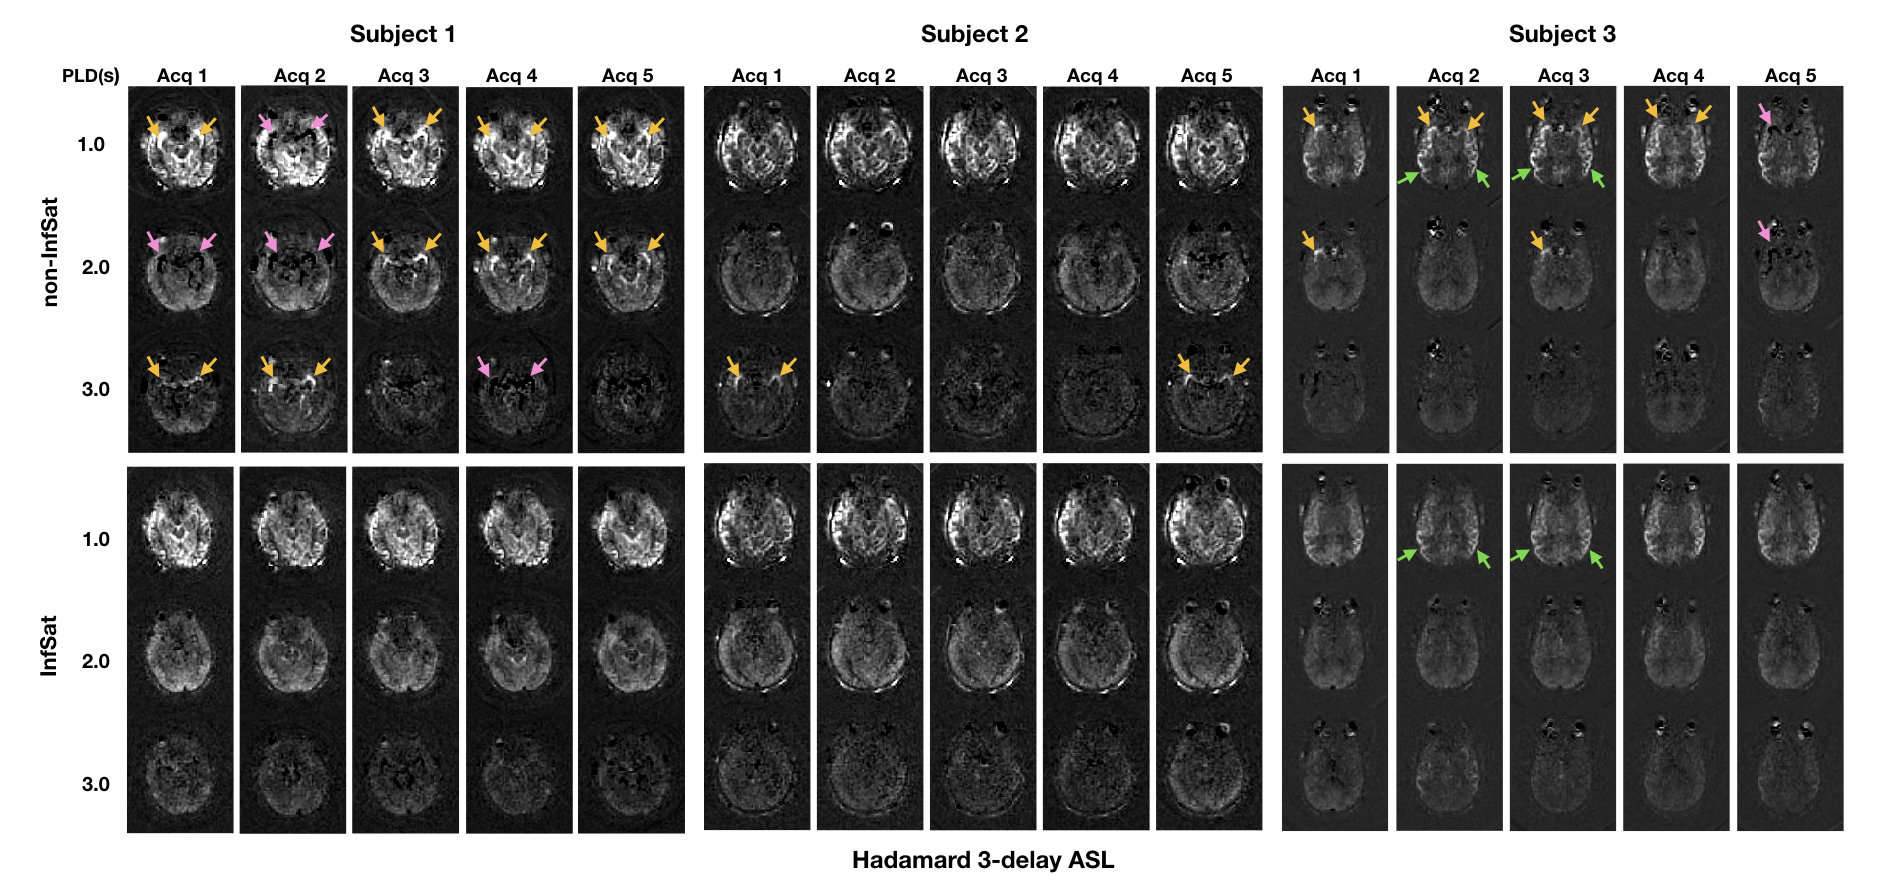
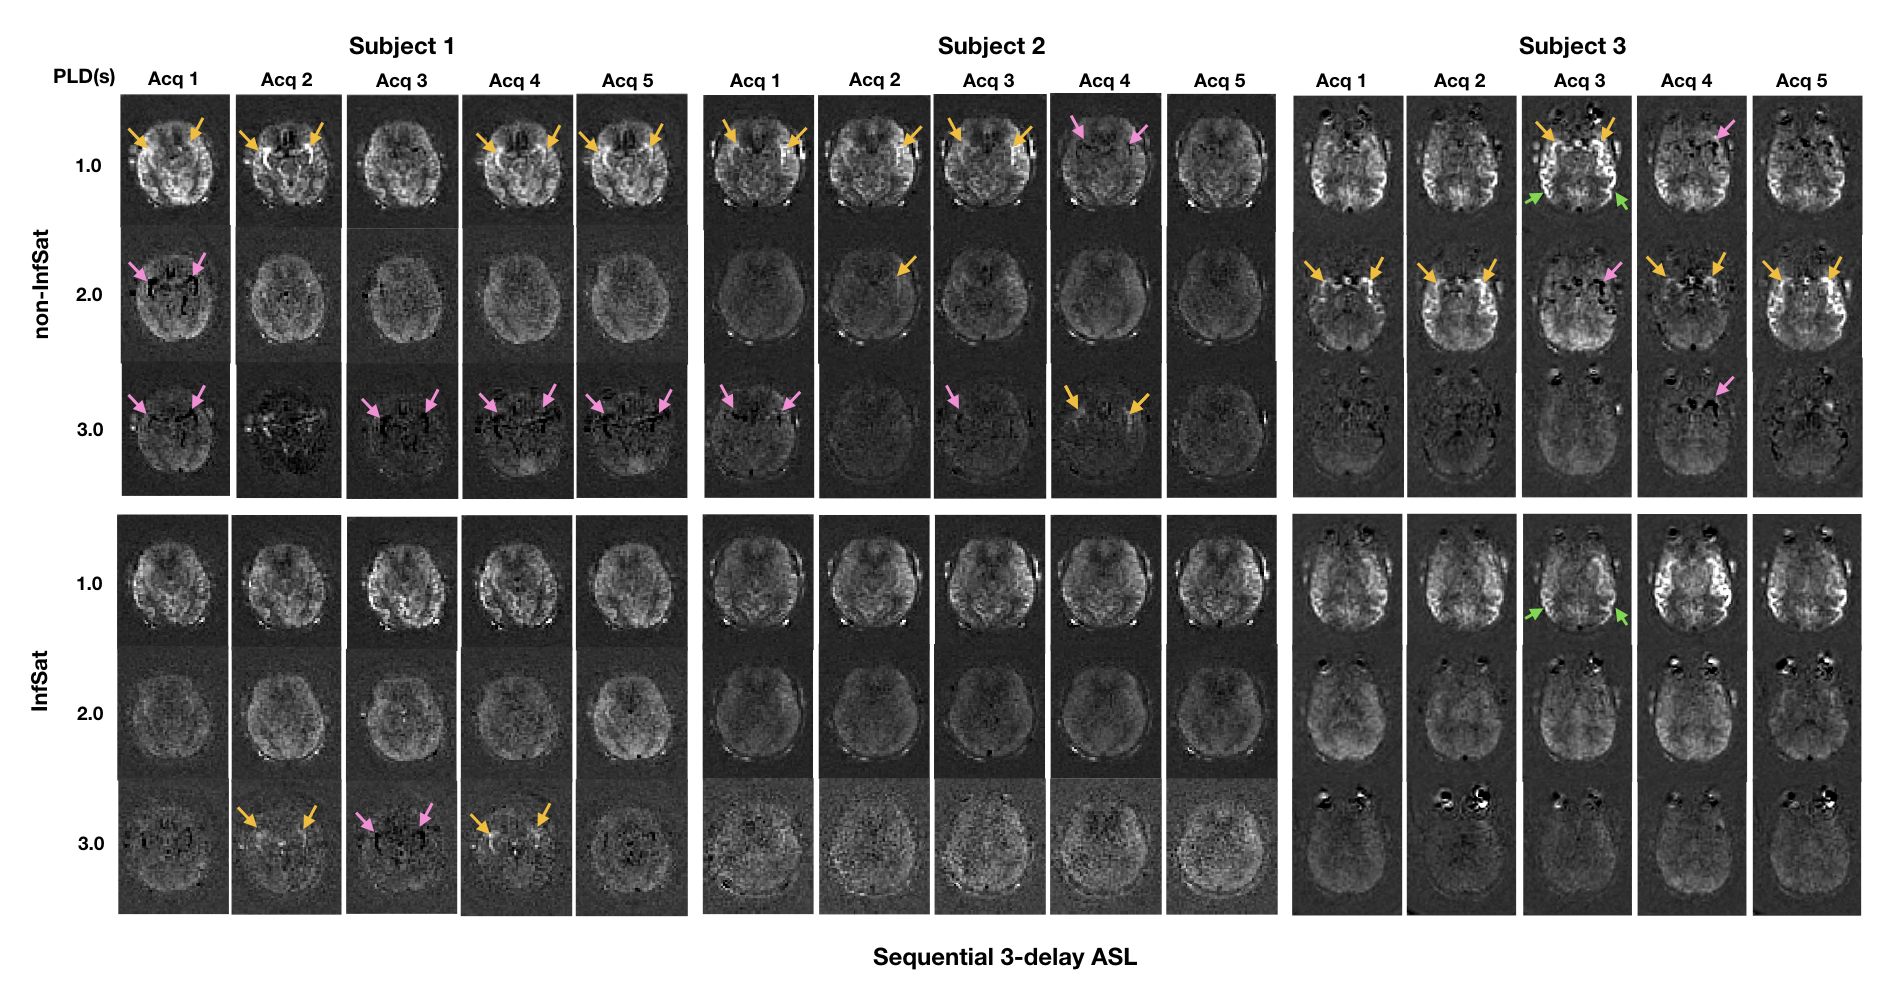
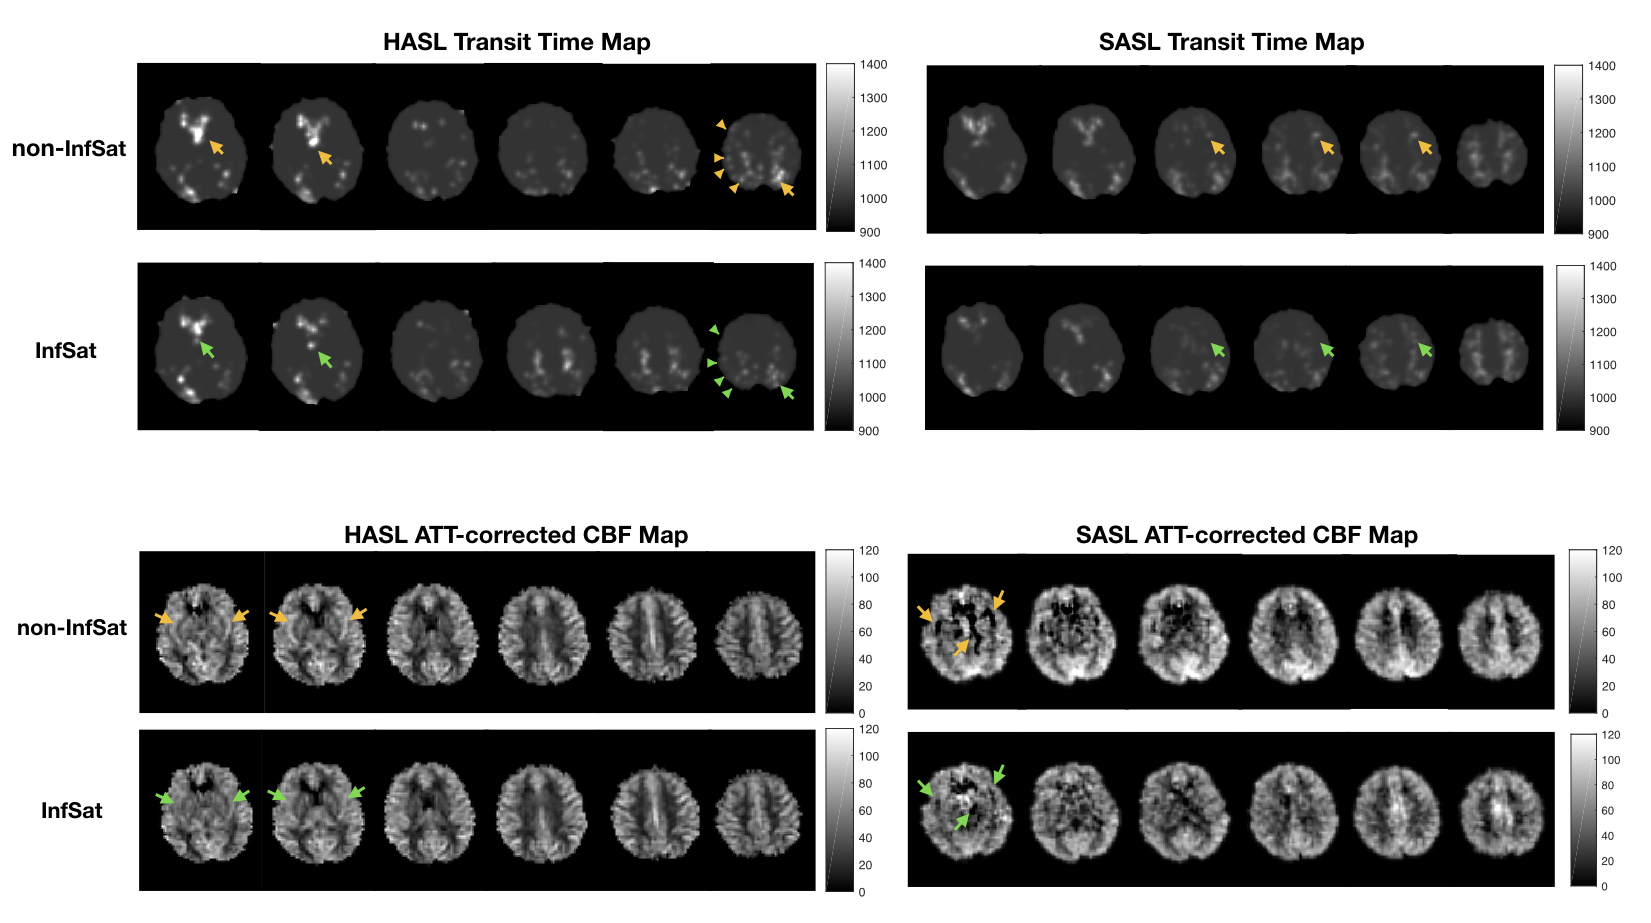
Perfusion weighted images of the three subjects, one slice for each acquisition at three PLDs, are shown in Figure 2 and Figure 3. Intravascular high signal (yellow arrows) and intravascular low signal (pink arrows) were observed in 12 out of 15(80%) single acquisitions of non-inflow-saturated HASL (Figure 2 top row). The same artifacts were observed in 14 out of 15(93.3%) acquisitions of non-inflow-saturated SASL (Figure 3 top row). Most of these artifacts were reduced after using inflow saturation (bottom rows in Figure 2 and Figure 3). However, some high signal in distal middle cerebral artery regions in subject 3 were not suppressed by inflow saturation (green arrows). The artifacts that were successfully suppressed by the inflow saturation were visible in all PLD measurements and were of variable intensity, consistent with the fluctuated inflow of unlabeled blood during PLD in different cardiac phases3. In contrast, the unsuppressed high signal appeared only in the shortest PLD, consistent with true ATA. True ATA has diagnostic value, indicating compromised hemodynamic status, while it is diagnostically undesirable to misinterpret inflow artifacts as ATAs.Figure 4 shows the transit time maps and ATT-corrected CBF maps of HASL and SASL from subject 1. In transit time maps, regions of apparent prolonged transit time are reduced with inflow saturation. In ATT-corrected CBF maps, the intravascular artifacts with variable intensity were suppressed by inflow saturation. When calculating ATT and ATT-corrected CBF from combined multi-PLD acquisitions, artifacts in a subset of the data can corrupt the final ATT and CBF maps.
Conclusion
Inflow saturation can reduce or eliminate artifacts resembling ATA in both Hadamard-encoded and sequential multi-PLD ASL, and can be expected to improve clinical interpretation of multi-PLD ASL data. In instances where inflow-suppressed ASL is not available, examination of individual PLD data can help distinguish true ATA from inflow artifacts.Acknowledgements
This work was supported by NIH grant P41 EB015893.References
[1] Dai WY, Robson PM, Shankaranarayanan A, Alsop DC. Reduced resolution transit delay prescan for quantitative continuous arterial spin labeling perfusion imaging. Magn Reson Med 2012;67:1252–1265.
[2] Dai WY, Shankaranarayanan A, Alsop DC. Volumetric measurement of perfusion and arterial transit delay using Hadamard encoded continuous arterial spin labeling. Magn Reson Med 2013;69:1014–1022.
[3] Yang Li, Dend Mao, and etc. Cardiac-Triggered Pseudo-Continuous Arterial-Spin-Labeling: A Cost-Effective Scheme to Further Enhance the Reliability of Arterial-Spin-Labeling MRI, Magn Reson Med, 2018 Sep;80(3):969-975.
Figures
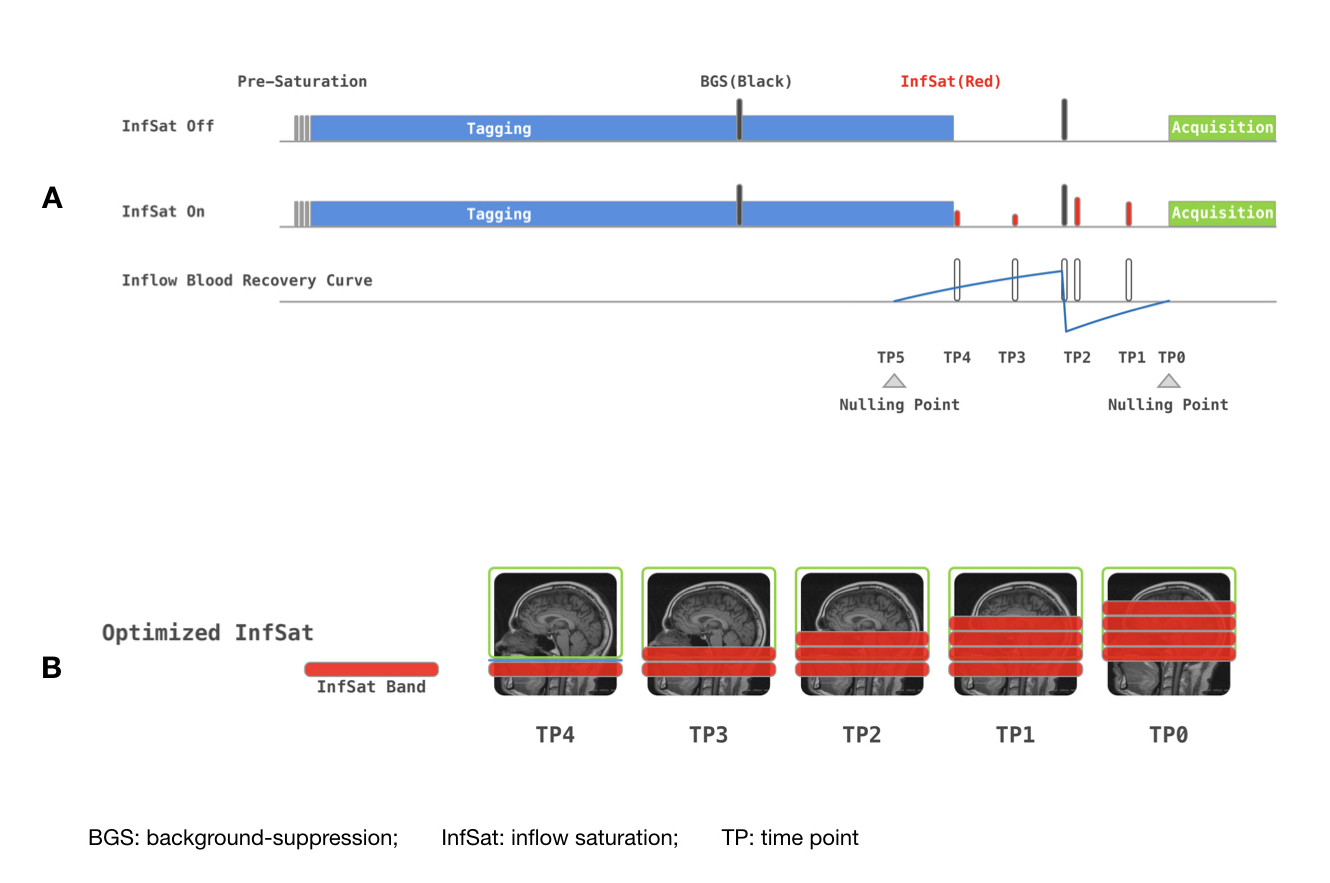
Figure 1. (A) Schematic diagram of background-suppressed pCASL sequence with and without optimized inflow saturation. (B) Schematic of saturated blood by using optimized inflow saturation pCASL.