3283
Subject-specific background suppression in 3D pseudo-continuous arterial spin labeling perfusion imaging1Fraunhofer MEVIS, Bremen, Germany, 2University of Bremen, Bremen, Germany
Synopsis
This study introduces a subject-specific automated approach for optimization of background suppression (BS) in 3D pseudo-continuous arterial spin labeling perfusion imaging. Optimised timing of BS related FOCI pulses is calculated from the T1 spectrum, obtained from a M0 scan of the organ of interest. Results show strong suppression of brain tissue, when magnetization is nulled at the time of excitation as well as high quality perfusion images, when a slight delay between nullpoint and excitation is introduced for different numbers of FOCI pulses.
Introduction
Pseudo-continuous arterial spin labeling (pCASL) MRI allows to visualize and quantify tissue perfusion without exogenous contrast agents by using labeled blood as an endogenous tracer. Unfortunately, the change in signal between label and control images due to the labeled blood bolus is only about 1%, leading to artifacts in perfusion images resulting from signal fluctuations [1]. Background suppression (BS) reduces these effects by nulling static tissue signal with distinct T1 values at the time of excitation [2]. Thus, in clinical practice, a major task is to make a good guess on expected T1 values based on the organ of interest, which might be difficult e.g. due to a wide range of reported values in abdominal organs like the liver [3][4], potentially leading to low quality perfusion images especially in 3D imaging.To this aim, we demonstrate a technique which automatically adjusts the timing of BS related inversion pulses in a 3D pCASL experiment, based on the subject specific distribution of T1 values in the region of interest.
Methods
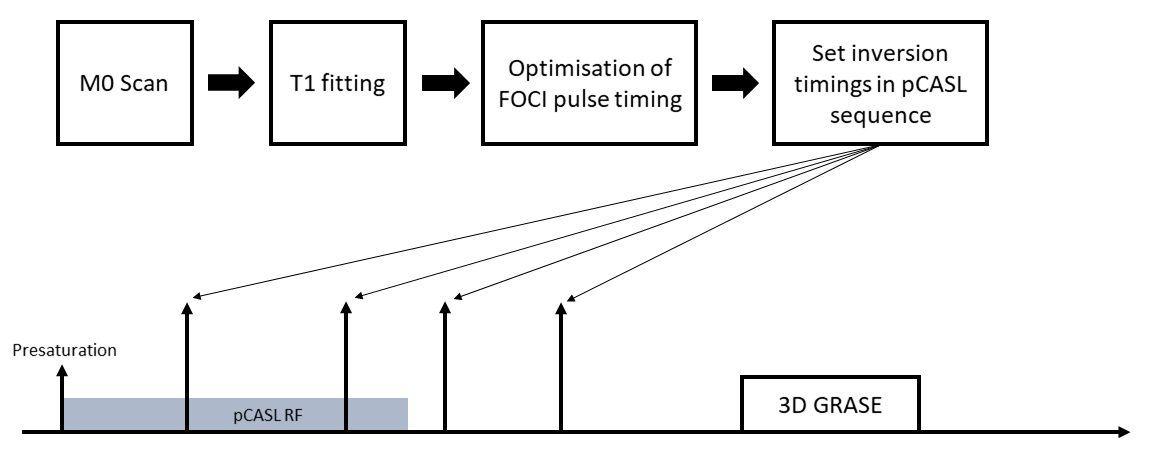
A pCASL sequence with 3D GRASE readout is implemented on a 3T MRI Scanner (Magnetom Skyra, Siemens Healthineers). BS is accomplished by four 90° saturation pulses, followed by up to 4 180° FOCI pulses [5]. The optimal FOCI timing is calculated from a M0 scan, which uses the same 3D GRASE readout to measure the recovery of longitudinal magnetization after a saturation pulse at different timepoints TS. T1 values for each voxel are fitted using the following model [4]:$$M_z(TS) = a + b \cdot e^{-TS/T1}$$
A histogram is calculated from fitted T1 values. Frequent values get a higher weighting in the following optimization procedure, because corresponding tissue covers a larger part of the region of interest. The basic equation, describing the behavior of longitudinal magnetization after a saturation and n inversion pulses, is described in [2]. A modification using the weighting factor w(j) yields the equations:
$$ w(j) \cdot [1 + (-1)^{n+1} e^{-TI/T1_j} + 2 \sum_{i=1}^n (-1)^i e^{- t_f / T1_j}] \overset{!}{=} 0,$$
with TI the total time from initial saturation to the excitation pulse, w(j) the count of bin j of the histogram, T1j the according T1 value and tf the FOCI timings, for which the system of equations must be minimized. A summary is shown in Fig. 1. The optimization process is implemented in c++ using the Gadgetron framework [6]. Images were reconstructed online at the scanner and offline using a custom Gadgetron pipeline.
Sequence parameters for M0 and pCASL scans are as follows: Matrix size = 64x64x8, Bandwidth = 3004 Hz/Pixel, Resolution = (3.9x3.9x4) mm3, TR/TE = (4000/31.1) ms. For the M0 scan, TS = (160, 660, 1160, 1660, 2160) ms were measured in a total time of 20 seconds. For the pCASl scan, label duration = 1800 ms, post-labeling delay = 1800 ms and 15 averages were selected, resulting in an acquisition time of 2 minutes. M0 scans are performed for three healthy volunteers and the calculated timing of FOCI pulses is compared. In addtion, perfusion images are acquired for one of the volunteers with FOCI timings that null static tissue at excitation. These perfusion measurements were repeated, nulling static tissue 60 ms prior to excitation, which yields increased robustness in the ASL subtraction. The quality of static tissue suppression as well as perfusion images using our proposed approach is analyzed.
Results/Discussion
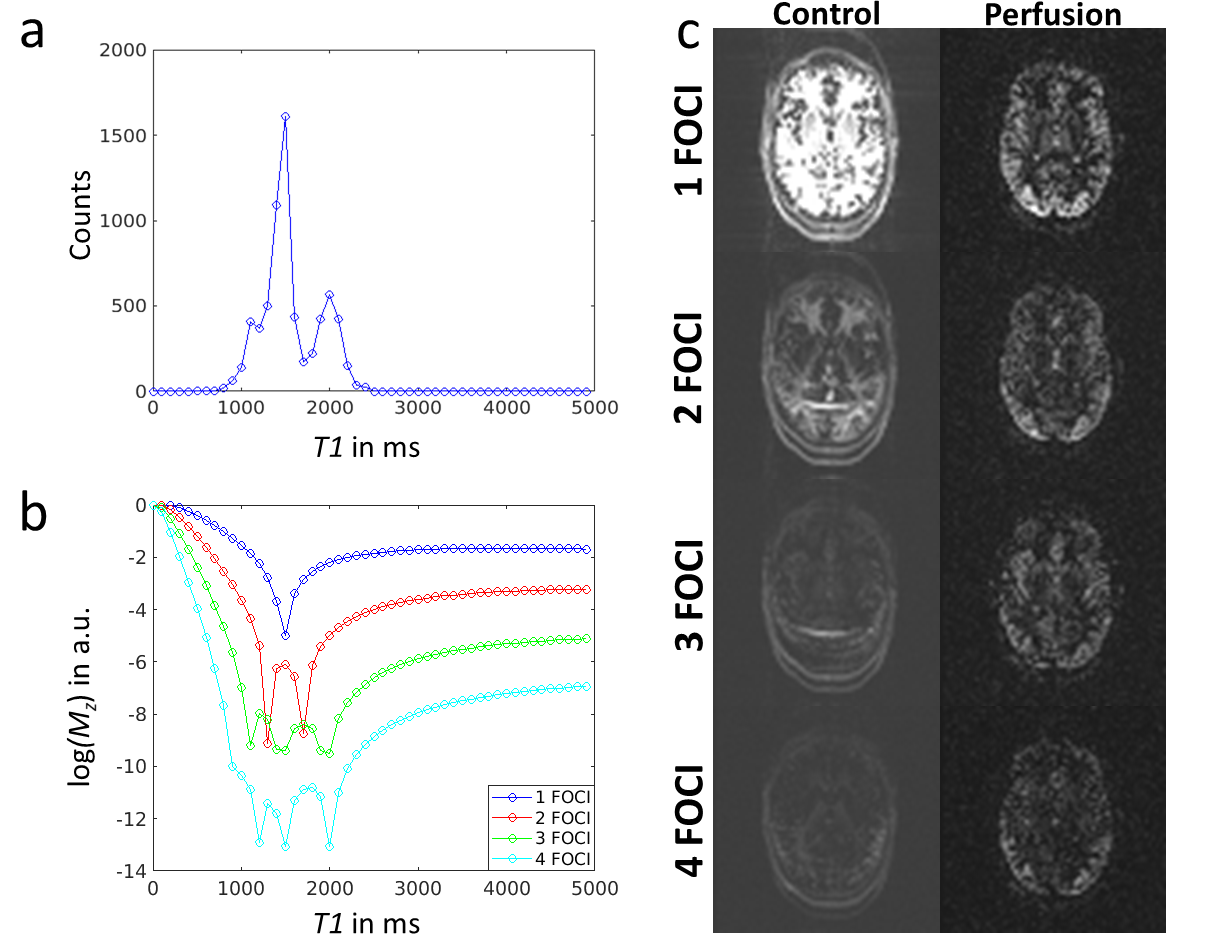
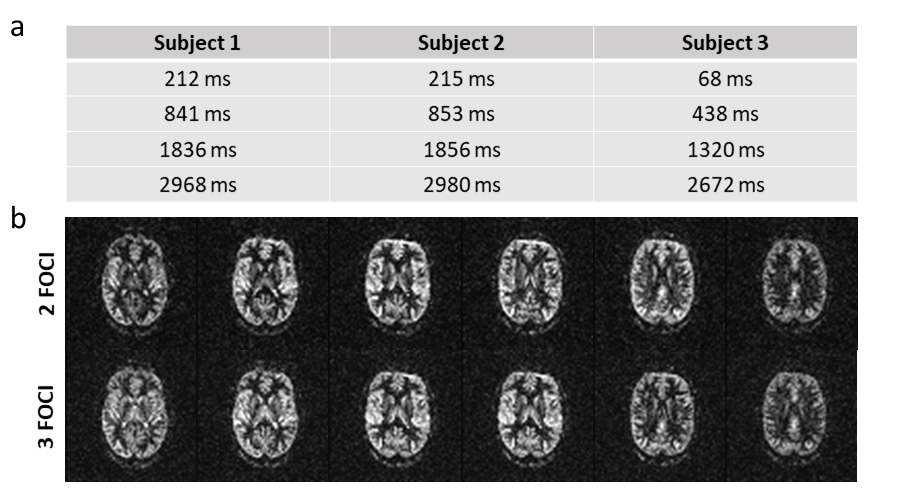
Suppression of static tissue signal using different numbers of FOCI pulses is shown in Fig. 2. Using a single FOCI pulse, timing is optimized such that the most frequent value from the calculated histogram (T1 = 1500ms) is suppressed at time of excitation (cf. Fig. 2b). The corresponding images show successful suppression of gray matter signal (cf. 2c top). Note that the number of counts is increased by residual ghosting artifacts in the M0 scan, which could be avoided by a more sophisticated fitting algorithm. Theoretical calculations in Fig. 2b further show that an increased number of FOCI pulses suppresses a broader region of the T1 spectrum, while best suppression is always achieved in the range of actual measured values, which corresponds with the reconstructed images. Low quality of perfusion images likely results from errors in the ASL subtraction due to sign alternations of residual static tissue at the zero-crossing.Calculated timings for four FOCI pulses are shown in Fig. 3a. Pulse timings for subject one and two are almost equal while timings for the third subject slightly differ from these values. This is explained by an increased count of white matter T1 in the respective histogram, leading to earlier pulse timings. Finally, Fig. 3b shows, that high quality perfusion images can be obtained, using the proposed automated timing of FOCI pulses and the additional delay of 60 ms.
Conclusion
We have shown, that the timing of BS related inversion pulses can be automatically optimized by using the T1 spectrum, obtained from a preceding M0 scan. Therefore, our proposed technique may be an important step to pave the way for ASL into clinical practice, removing the need for manual BS adjustments, which will be especially helpful in abdominal imaging where distribution of T1 values is less distinct.Acknowledgements
This work was supported by the FhG Internal Programs (Grant No. Attract 142-600172).References
[1] D. Alsop et. al, Recommended Implementation of Arterial Spin Labeled Perfusion MRI for Clinical Applications: A consensus of the ISMRM Perfusion Study Group and the European Consortium for ASL in Dementia, MRM 1997; 37: 896-905
[2] S. Mani et. al, Background Suppression with Multiple Inversion Recovery Nulling: Applications to Projective Angiography, MRM 1997; 37: 898-905
[3] C. Chhor et. al, Quantitative Measurements of T1 and T2 for the Abdomen in a 3 Tesla Whole-Body Imager, Proc. Intl. Soc. Mag. Reson. Med. 2003
[4] Y. Chen et. al, Rapid Volumetric T1 Mapping of the Abdomen Using 3D Through-Time Spiral GRAPPA, MRM 2016; 75: 1457–1465
[5] M. Yongbi et. al, Perfusion Imaging Using FOCI RF Pulses, MRM 1998; 40: 938-943
[6] M. Hansen, Gadgetron: an open source framework for medical image reconstruction, MRM 2013; 69: 1768-1776
Figures