3282
Optimal subject-specific pCASL settings by automated inner-scan timing adaption1MR Physics, Fraunhofer MEVIS, Bremen, Germany, 2MR-Imaging and Spectroscopy, Faculty 01 (Physics/Electrical Engineering, University of Bremen, Bremen, Germany
Synopsis
The presented automated inner-scan timing adjustment for subject-specific pCASL measurements can reduce uncertainties in perfusion quantification. The high variability of arterial transit times often leads to undesired arterial transit delay (ATD) artifacts. The method evaluated here allows the optimal FL-bolus duration to be individually adjusted by analyzing intermediate decoded perfusion-weighted images and directly adjusting the sub-bolus durations without increasing the measurement time. The aim is to reduce the FL-bolus duration as much as necessary, but to keep it as long as possible in order to obtain a maximum signal.
Introduction
One of the key challenges in clinical arterial spin labeling (ASL) is the high variability of arterial transit times (ATT), which cause the associated arterial transit delay artifacts (ATD)1. Especially, in patients with pathological changes these artifacts occur when post-labeling delay (PLD) and bolus duration (BD) are not optimally adapted to the subject, leading to a difficult quantification of cerebral blood flow (CBF)2. This also applies to the Free Lunch (FL) approach3 in Hadamard pseudo-continuous ASL (H-pCASL). It was shown that a dynamic feedback algorithm in combination with Walsh-sorted time-encoded pCASL (WH-pCASL) enables the use of intermediate perfusion weighted images to adjust the sub-bolus durations (SBD) during measurement4. The goal is to keep the FL-bolus long enough to maximize the signal, but short enough to avoid ATD artifacts. To this end, the time at which all tissue voxels are filled with labeled blood is determined. The full integration of the technique into the WH-pCASL sequence using a feedback cycle between image reconstruction and MRI sequence during the scan was previously described in abstract form5.This abstract evaluates the robustness of the adaptive feedback algorithm in five healthy subjects and compares the uncertainty in quantifying CBF and determining bolus arrival times (BAT) between appropriate SBDs for healthy individuals3,6 and deliberately inappropriate timings.
Methods
Imaging:Five healthy volunteers (25-52 years, 2 male) were examined at 3T (MAGNETOM Skyra, SIEMENS Healthineers AG). An inhouse developed WH-pCASL sequence with following parameters for the 3D GRASE readout were used for all ASL measurements7: TR = 5 s, TE = 29.5 ms, FOV = 256x192x64 mm3, matrix size = 64x48x16 (interpolated), voxel size = 2.0x2.0x4.0 mm, 8 encoding cycles, TA = 0:50 min. Two FOCI pulses (2*T1) were used for background suppression. All experiments had a maximum inflow time (TI) of 3.6 s and an initial PLD of 100 ms. In addition, the minimum allowable SBD in the feedback algorithm was 200 ms. Three repetitions of the adaptive feedback cycle were acquired to determine the robustness of the adaptation. The initial SBDs for the adaptive feedback were: 695, 695, 695, 695, 695, 240, 240, 240 [ms]. Additionally, three measurements were performed for comparison: one of them with the “White-Paper timing” recommended for healthy people under 70 years3,6 (FL-Bolus 1800 ms, PLD = 1800 ms), one with a short FL-Bolus (1000 ms) and long PLD (2600 ms), and one with a long FL-bolus (2600 ms) and short PLD (1000 ms) (see SBDs in Fig. 1). In addition, a T1-weighted anatomical MPRAGE image was acquired for segmentation of grey and white matter (GM, WM).
Analysis:
Decoded perfusion images were processed using FMRIB Software Library v6.0.1 with BASIL8. Calculated mean CBF and BAT values with their corresponding variances where analysed for GM and WM respectively by using the tissue masks generated with the structural MPRAGE image.
Results
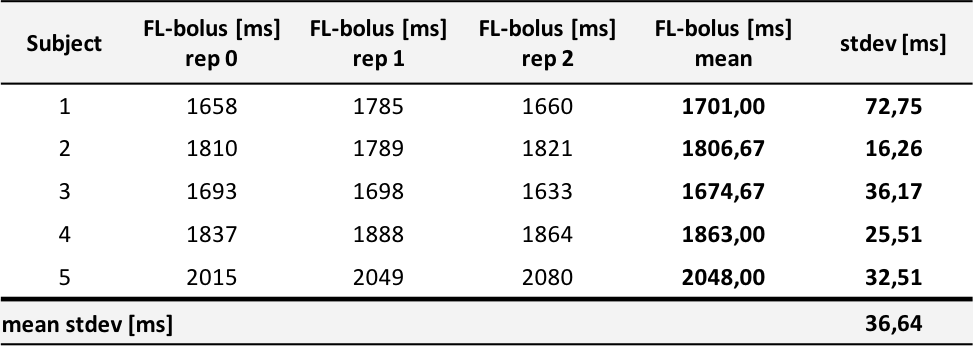
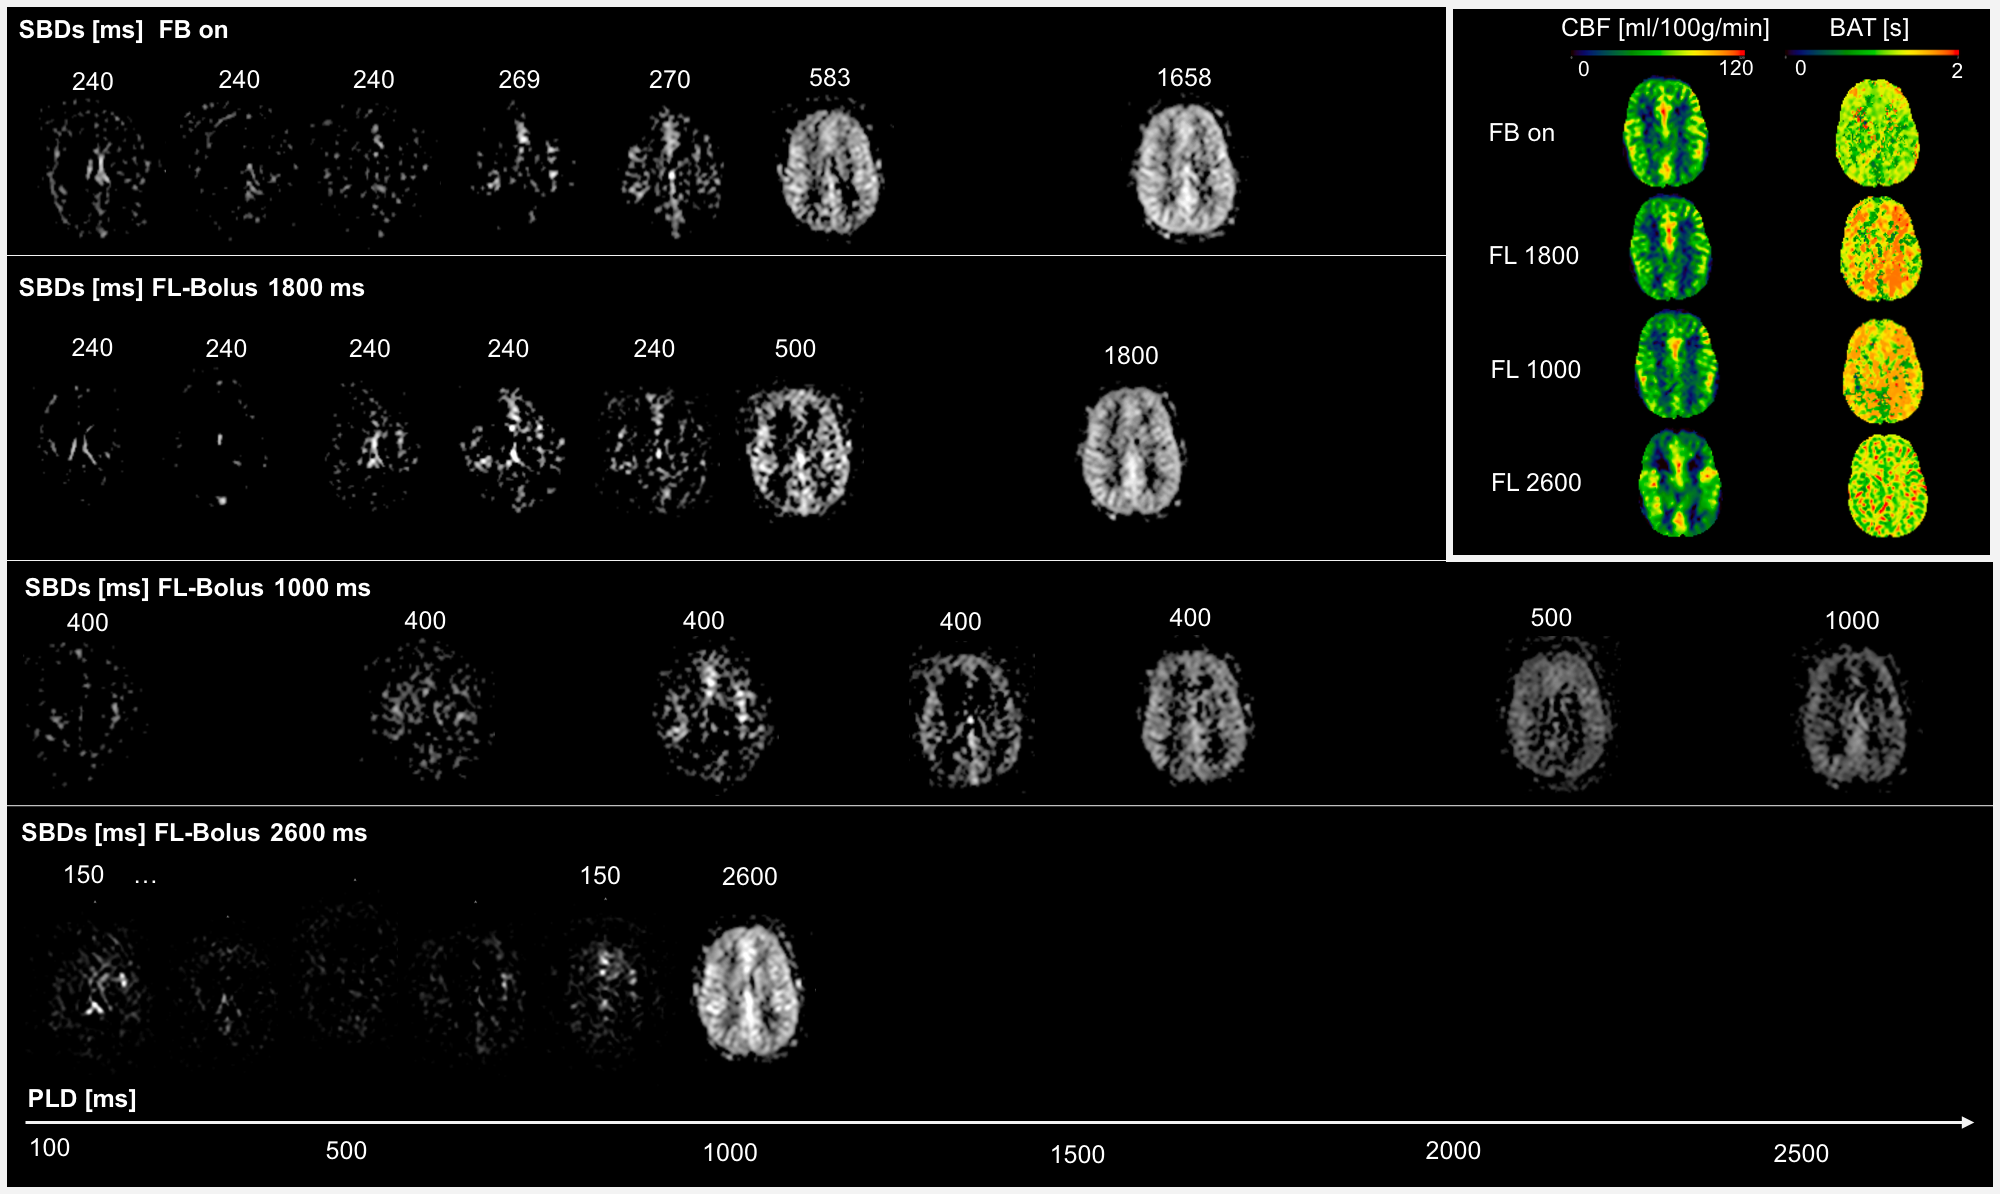
Table 1 shows the resulting SBDs for all five volunteers and three repetitions of the feedback. The mean standard deviation of the final FL-boli is 36.64 ms.Figure 1 compares the first feedback result with the other measured timings for a single subject (subject 1). The corresponding CBF and BAT maps can be compared at the top right. The timing options with FL-bolus 1000 ms and 2600 ms do not show optimal sampling behavior. On visual inspection, it can be observed that the 1000 ms FL-bolus has low signal and the brain is already completely supplied with blood in early SBs. The timing with the 2600 ms FL-bolus shows almost no signal in the SBDs.
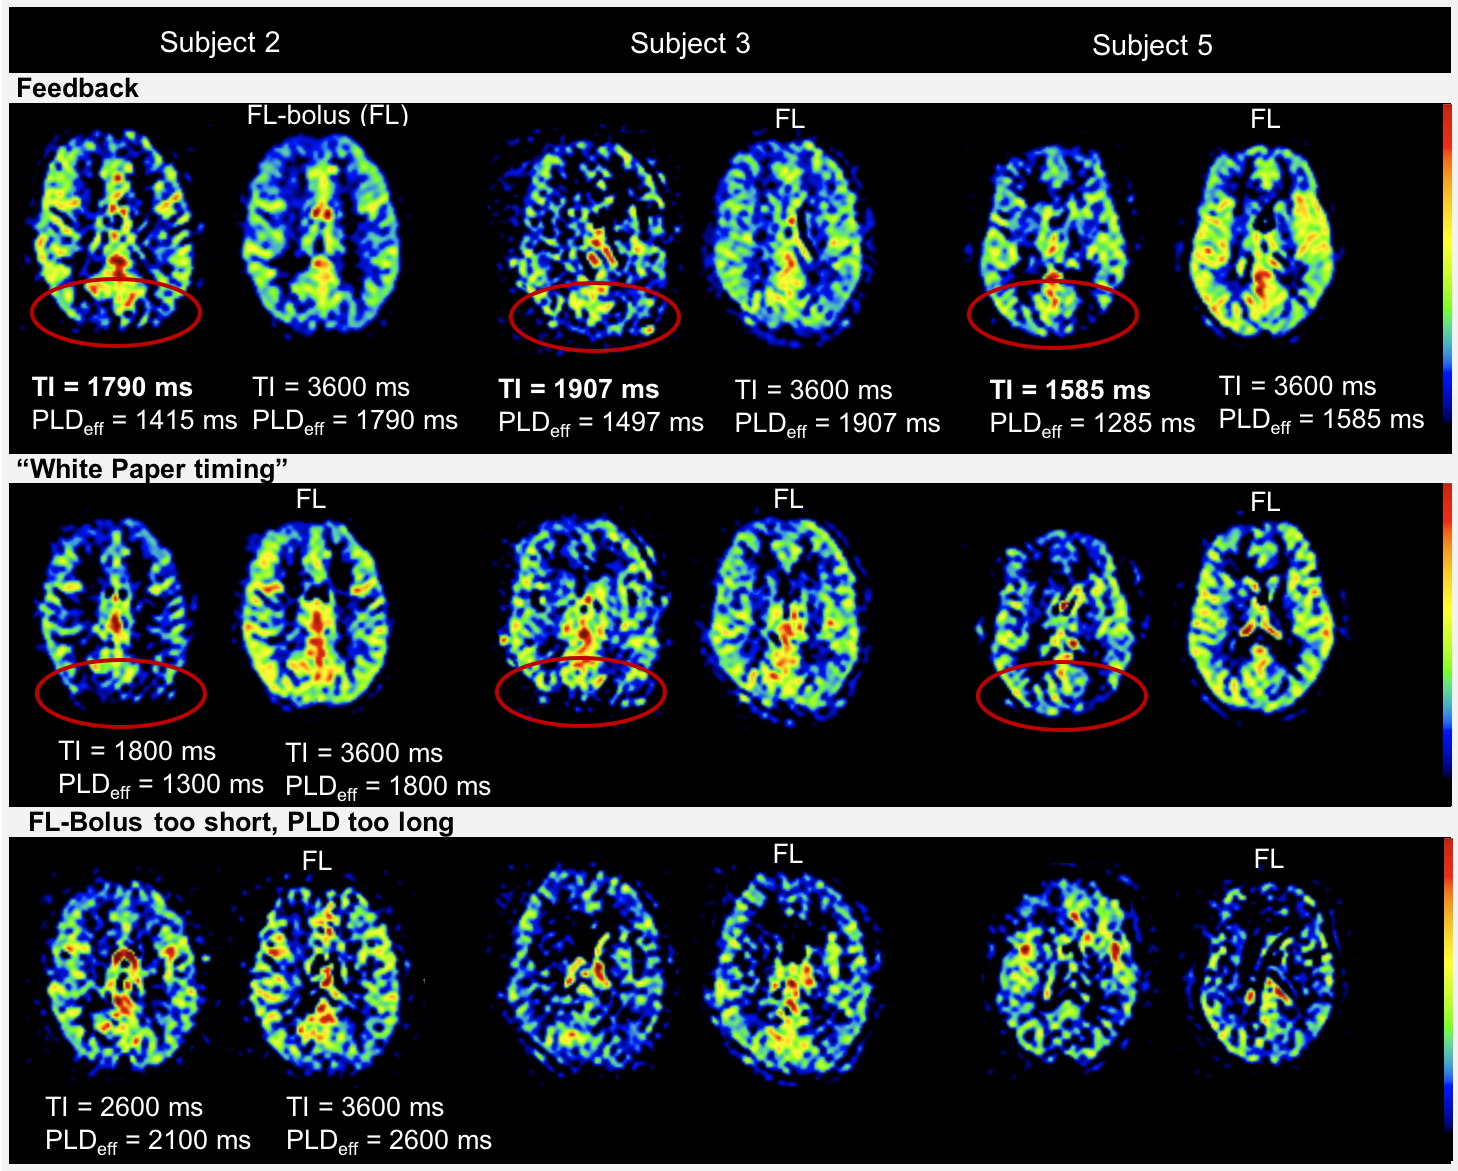
Figure 2 compares the FL-bolus with the previous SB, in which the brain of is almost completely supplied with blood for three representative subjects.
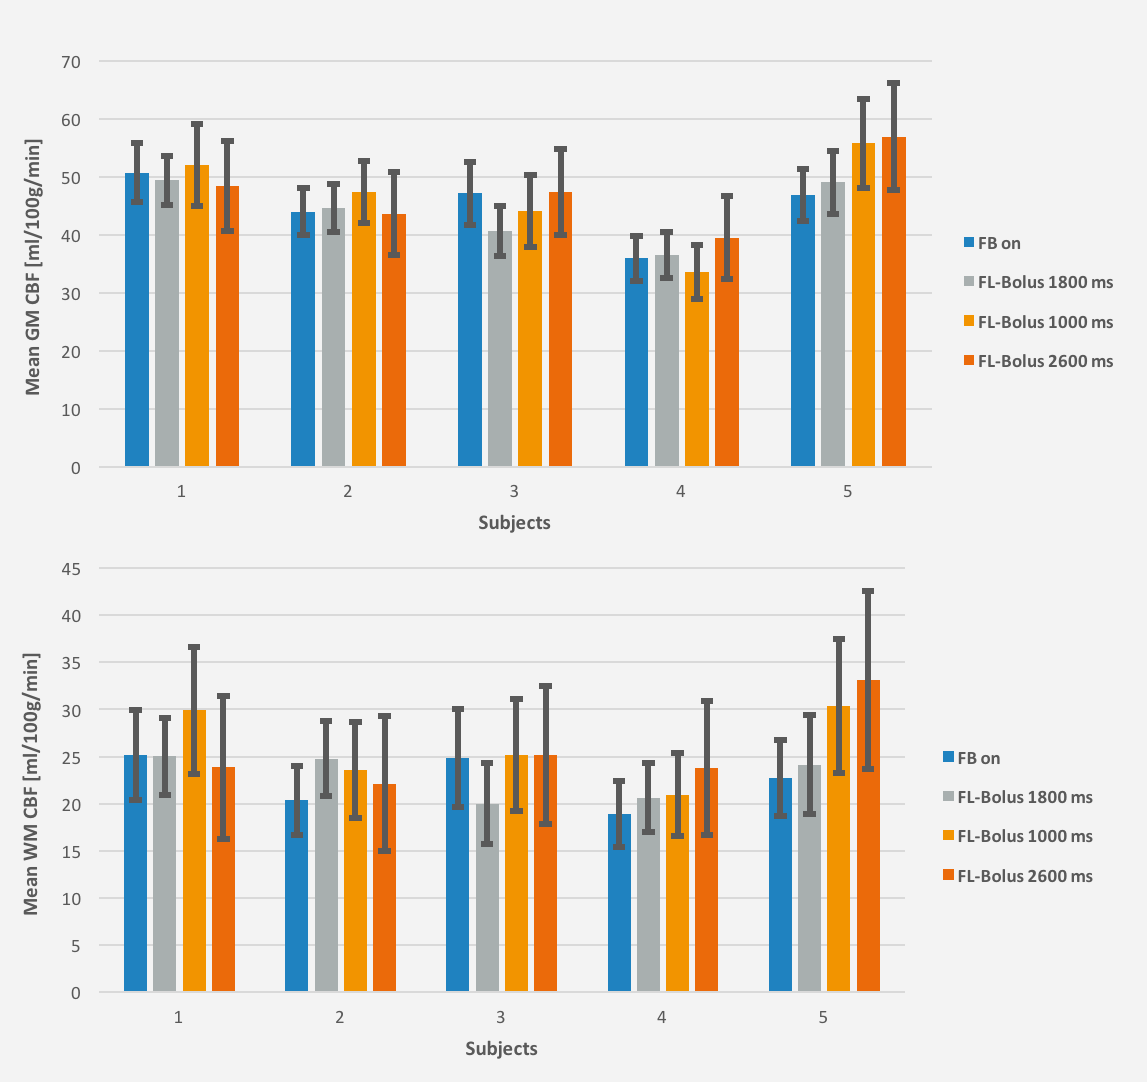
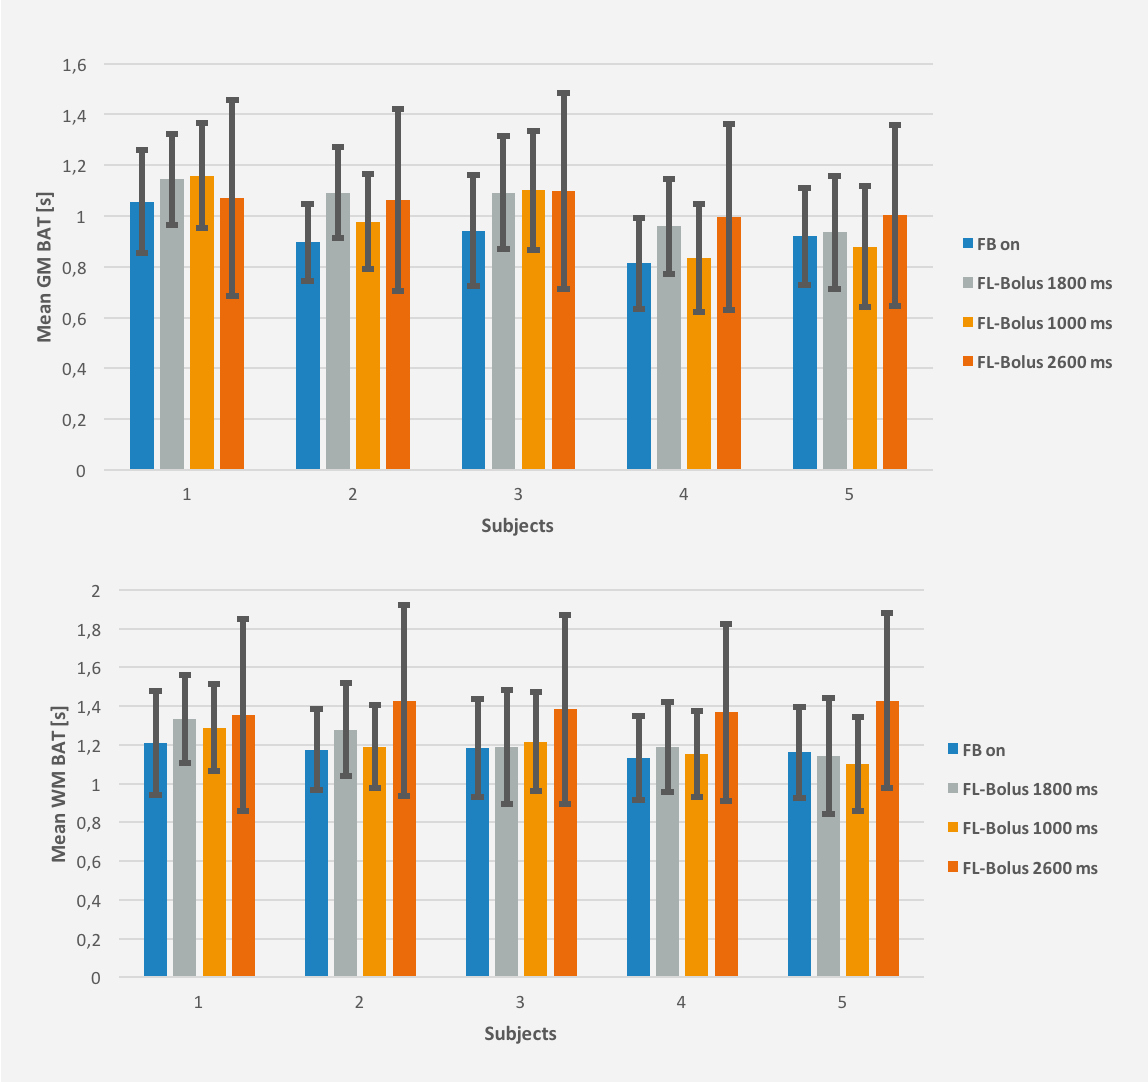
Figures 3 and 4 show the mean CBF and BAT results of all experiments in GM and WM with their associated standard deviations as an indicator for the uncertainty of the performed fit.
Discussion & Conclusion
Consequently, the feedback algorithm found an individual timing for the SBDs and FL-bolus. As desired, the brain was almost completely perfused in the SBs before the FL-bolus (see Fig. 2). At visual inspection, the FL-boli of the adapted timing show also no signs of ATD artifacts (see Fig. 1 & 2). Thus, the feedback algorithm has successfully found appropriate timings given the maximum TI and initial PLD. Additionally, in the three repetitions using the dynamic timing adaption a relatively low standard deviation can be observed, which suggests a robust performance and good repeatability of the proposed approach. The standard deviation of the first feedback run (Fig. 3 & 4) is within the range of the standard deviation from the recommended timing for healthy humans, while the uncertainty of suboptimal sampling increases significantly.The results suggest that the use of fixed timings for all patients could lead to a higher uncertainty of quantification results if sampling becomes suboptimal. To verify this, the feedback algorithm would need to be tested in a broader age group and in patients. For this, a higher maximum TI would be appropriate to account for reduced and delayed perfusion.
Acknowledgements
No acknowledgement found.References
1. Zaharchuk G. Arterial spin labeling for acute stroke: practical considerations. Transl. Stroke Res. 2012; 3:228-235. doi: 10.1007/s12975-012-0159-8.
2. Dai W, Robson PM, Shankaranarayanan A, Alsop DC. A reduced resolution transit delay prescan for quantitative continuous arterial spin labeling perfusion imaging. Magn Resn Med. 2012; 67(5):1252-1265. doi: 10.1002/mrm.23103.
3. Teeuwisse WM, Schmid S, Ghariq E, Veer IM, van Osch MJP. Time-encoded pseudocontinuous arterial spin labeling: Basic properties and timing strategies for human applications. Magn. Reson. Med. 2014. doi: 10.1002/mrm.25083.
4. Breutigam NJ, von Samson-Himmelstjerna F, Günther M. Automatic adaption of ASL labeling parameters: Walsh-sorted time-encoded pCASL with a dynamic feedback algorithm. Proceedings of the 24th Annual Meeting ISMRM 2016.
5. Breutigam NJ, Buck MA, Hoinkiss DC, von Samson-Himmelstjerna F, Günther M. Automated Subject-Specific Adaption of pCASL Timing Parameters in Real Time. Proceedings of the University of Michigan International Workshop on Arterial Spin Labeling MRI: Technical Updates and Clinical Experience At: Ann Arbor, MI, USA 2019.
6. Alsop DC, Detre JA, Golay X, et al. Recommended implementation of arterial spin-labeled perfusion MRI for clinical applications: A consensus of the ISMRM perfusion study group and the European consortium for ASL in dementia. Magn Reson Med. 2015;73(1):102-116.
7. Günther M, Oshio K, Feinberg DA. Single-shot 3D imaging techniques improve arterial spin labelling perfusion measurements. Magn. Reson. Med. 2005; 54:491–498. doi: 10.1002/mrm.20580.
8. Chappell MA, Groves AR, Whitcher B, Woolrich MW. Variational Bayesian inference for a non-linear forward model. IEEE Transactions on Signal Processing 57(1):223-236, 2009.
Figures