3281
Variable Density Sampling of 3D TSE Cartesian Acquisition for Improved Robustness and SNR of ASL-MRI1Radiology, UT Southwestern Medical Center, Dallas, TX, United States, 2Pediatrics, UT Southwestern Medical Center, Dallas, TX, United States, 3Advanced Imaging Research Center, UT Southwestern Medical Center, Dallas, TX, United States
Synopsis
3D Cartesian turbo spin echo (TSE) acquisition has shown robustness for arterial spin labeled (ASL) MRI. However, 3D Cartesian TSE are acquired with single average due to relatively long TR and longer scan times, which may lead to suboptimal signal to noise ratio (SNR). In this study, we implemented variable density sampling of 3D Cartesian TSE that acquires the center of the k-space with higher signal averages, and improves the robustness and SNR without significantly prolonging the scan time. We further combined this with M0 images using partial k-space to compensate for increased scan time, but without compromising perfusion quantification.
Introduction
3D spiral TSE and GRASE acquisitions are recommended for brain ASL because of their high signal to noise ratio (SNR) and compatibility with optimal background suppression [1]. However, they are challenging in areas with increased B0 inhomogenieties [2], and 3D Cartesian TSE acquisition has shown robustness in these applications [3]. 3D spiral TSE and 3D GRASE acquisitions are usually performed with multiple signal averages (NSA) to increase robustness of ASL signal and achieve better SNR. While 3D Cartesian TSE can also be performed with multiple NSAs, this increases the total scan time unduly due to longer TRs needed to accommodate larger number of refocusing pulses and maintain SAR limits. Thus, the purpose of this study was to improve the robustness and SNR of ASL with variable density (VD) sampled 3D Cartesian TSE, and to combine with M0 images using partial k-space, to maintain the total scan time without compromising perfusion quantification.Methods
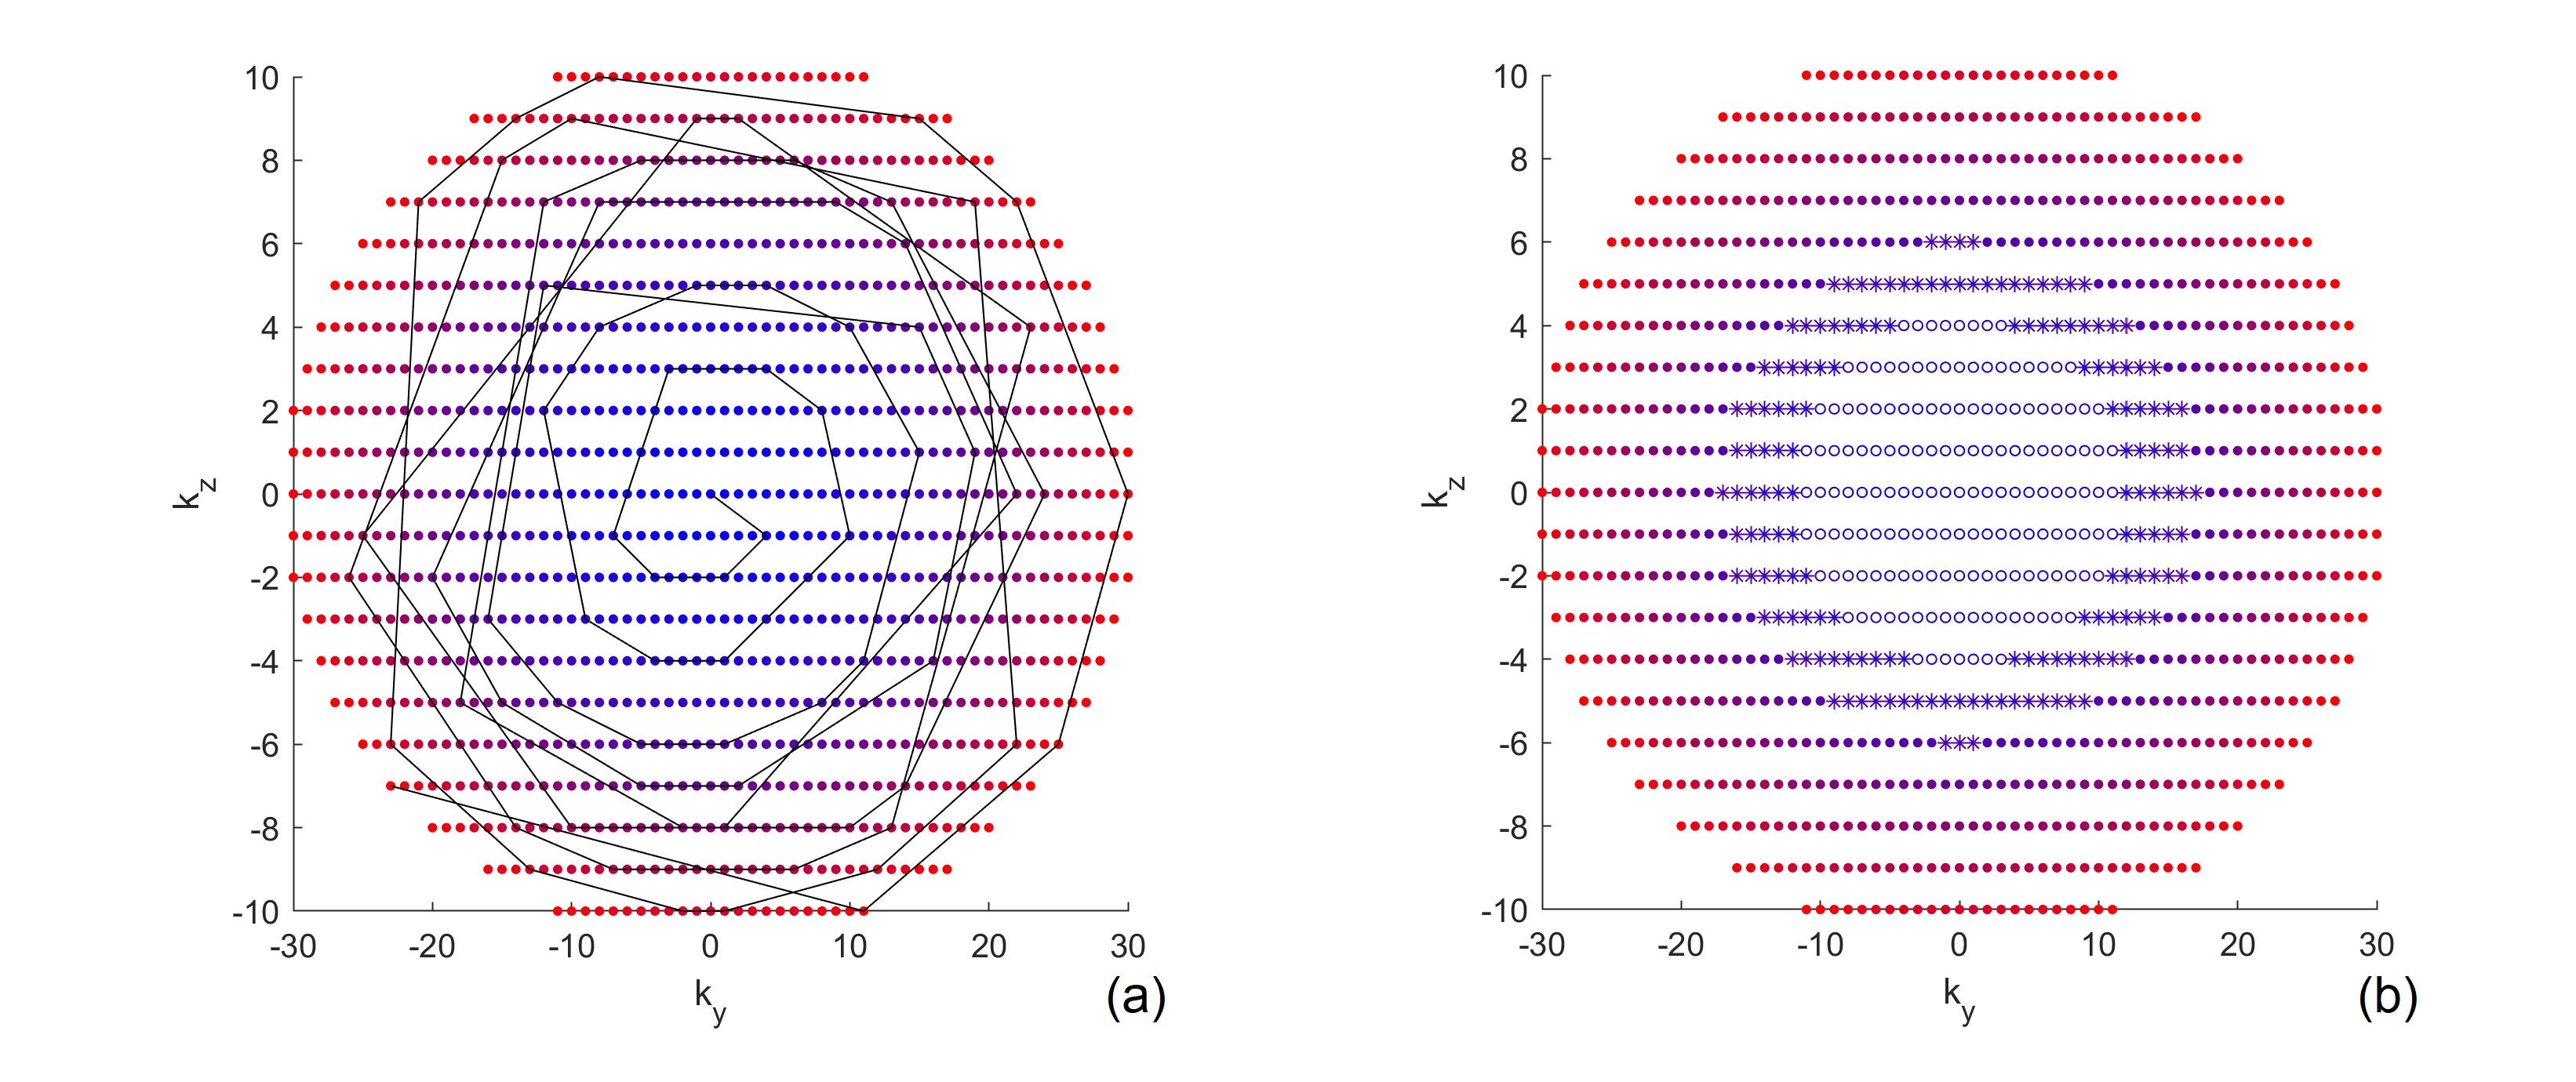
Variable Density Sampling: Pseudo-continuous ASL (pCASL) with optimized background suppression was used for brain perfusion imaging, using a 3D TSE Cartesian acquisition with Spiral Profile Reordering (CASPR) [3]. Compared to the original CASPR view ordering (Fig. 1a), the proposed method (VD-CASPR) divided the ky-kz space into 3 regions with increasing distances from the center of the k-space (Fig. 1b). The ‘region 1’ (R1) is an elliptical region in the center, surrounded by the annular regions 2 (R2), and 3 (R3), that allows VD sampling for each region separately. For example, the profiles in R1, R2 and R3 can be acquired with NSA of 3, 2 and 1 respectively, while still maintaining spiral profile reordering on a Cartesian grid for each echo train (Fig. 1a, solid line), allowing for increased robustness and SNR. The VD-CASPR slightly increases the scan time compared to CASPR, but still shorter than a true multiple NSA acquisition.M0 Images using Partial k-space: To compensate for the increased scan time with VD-CASPR, we explored partial k-space acquisitions for proton-density weighted (M0) images, such that the total scan time for ASL quantification (including ASL and M0) remains unchanged. This was tested on an original 3D TSE-CASPR acquisition, where M0 images were retrospectively generated using only 1/2, 1/3, and 1/5 of the central part of a fully acquired k-space, followed by cerebral blood flow (CBF) maps. This method was then implemented on the scanner that acquires only the central part of the k-space with different ratios.
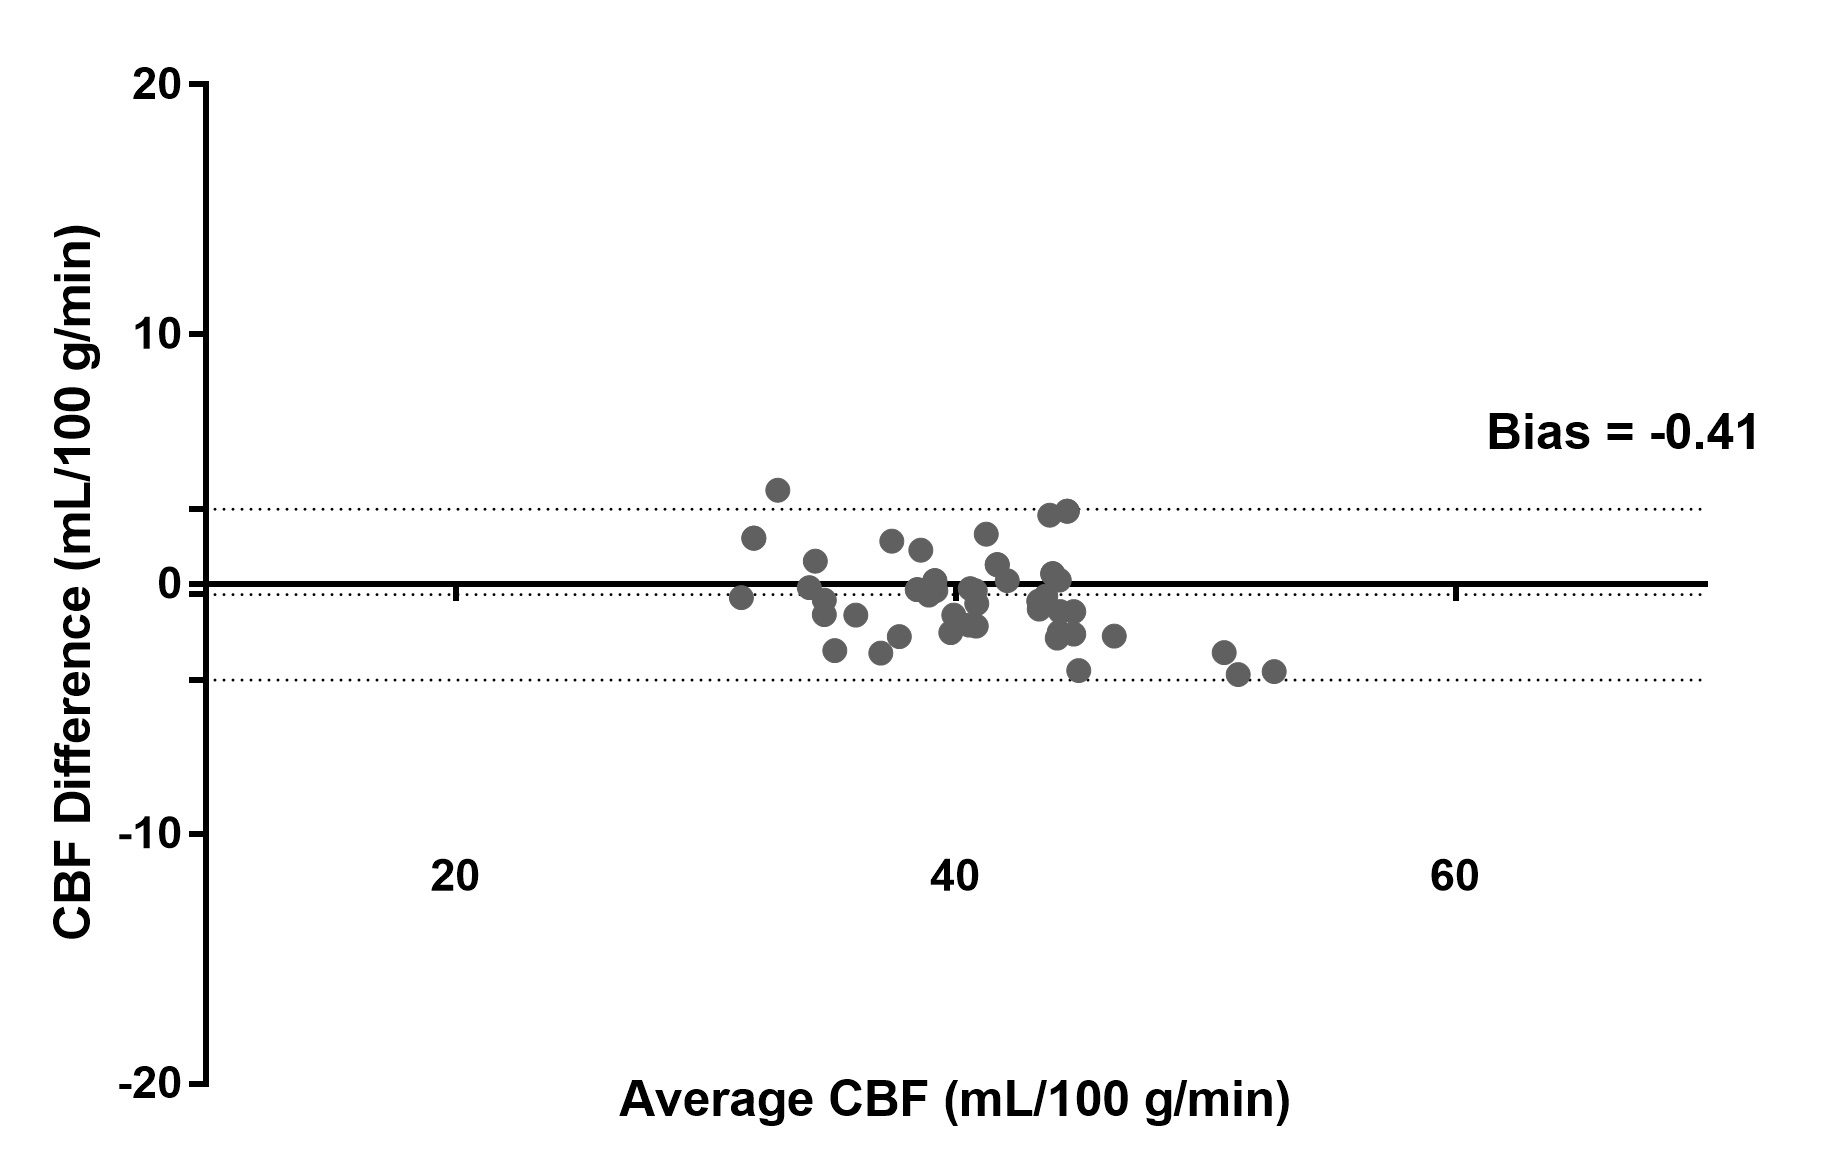
MR Imaging: Two healthy volunteers were scanned on a 3T Philips Ingenia scanner under IRB approval to test the VD-CASPR and partial k-space M0 acquisition. The imaging parameters for CASPR were: TR/TE = 6000/14 ms, FOV = 220x220x110 mm3, matrix = 64x64 with 36 slices, acquired resolution = 3.5x3.5x6 mm3, reconstructed resolution = 3x3x3 mm3, ETL = 80, echo spacing = 2.8 ms, label duration = 1.8 s, post-label delay = 1.8 s, 4 BGS pulses and acquisition time = 3:00 minutes for 1 average. For the proposed VD-CASPR acquisition, the number of profiles in R1 and R2 were set to 2×ETL = 160 in each region, which increased the scan time to 4:00 mins. Due to higher SNR, M0 images were only acquired with CASPR view ordering, for which the scan time was 1:30 mins with fully acquired k-space, and 45 s, 30 s and 16 s with 1/2, 1/3 and 1/5 acquired k-space respectively. Image Analysis: ROIs were drawn on CBF maps in common gray matter regions including upper frontal lobe, upper parietal lobe, lower operculum, lower occipital lobe, thalamus, cerebellum, and brainstem [4]. The agreement between the quantified mean CBF values in these ROIs was compared between using M0 images with full and 1/3 acquired k-space using Bland-Altman analysis.
Results
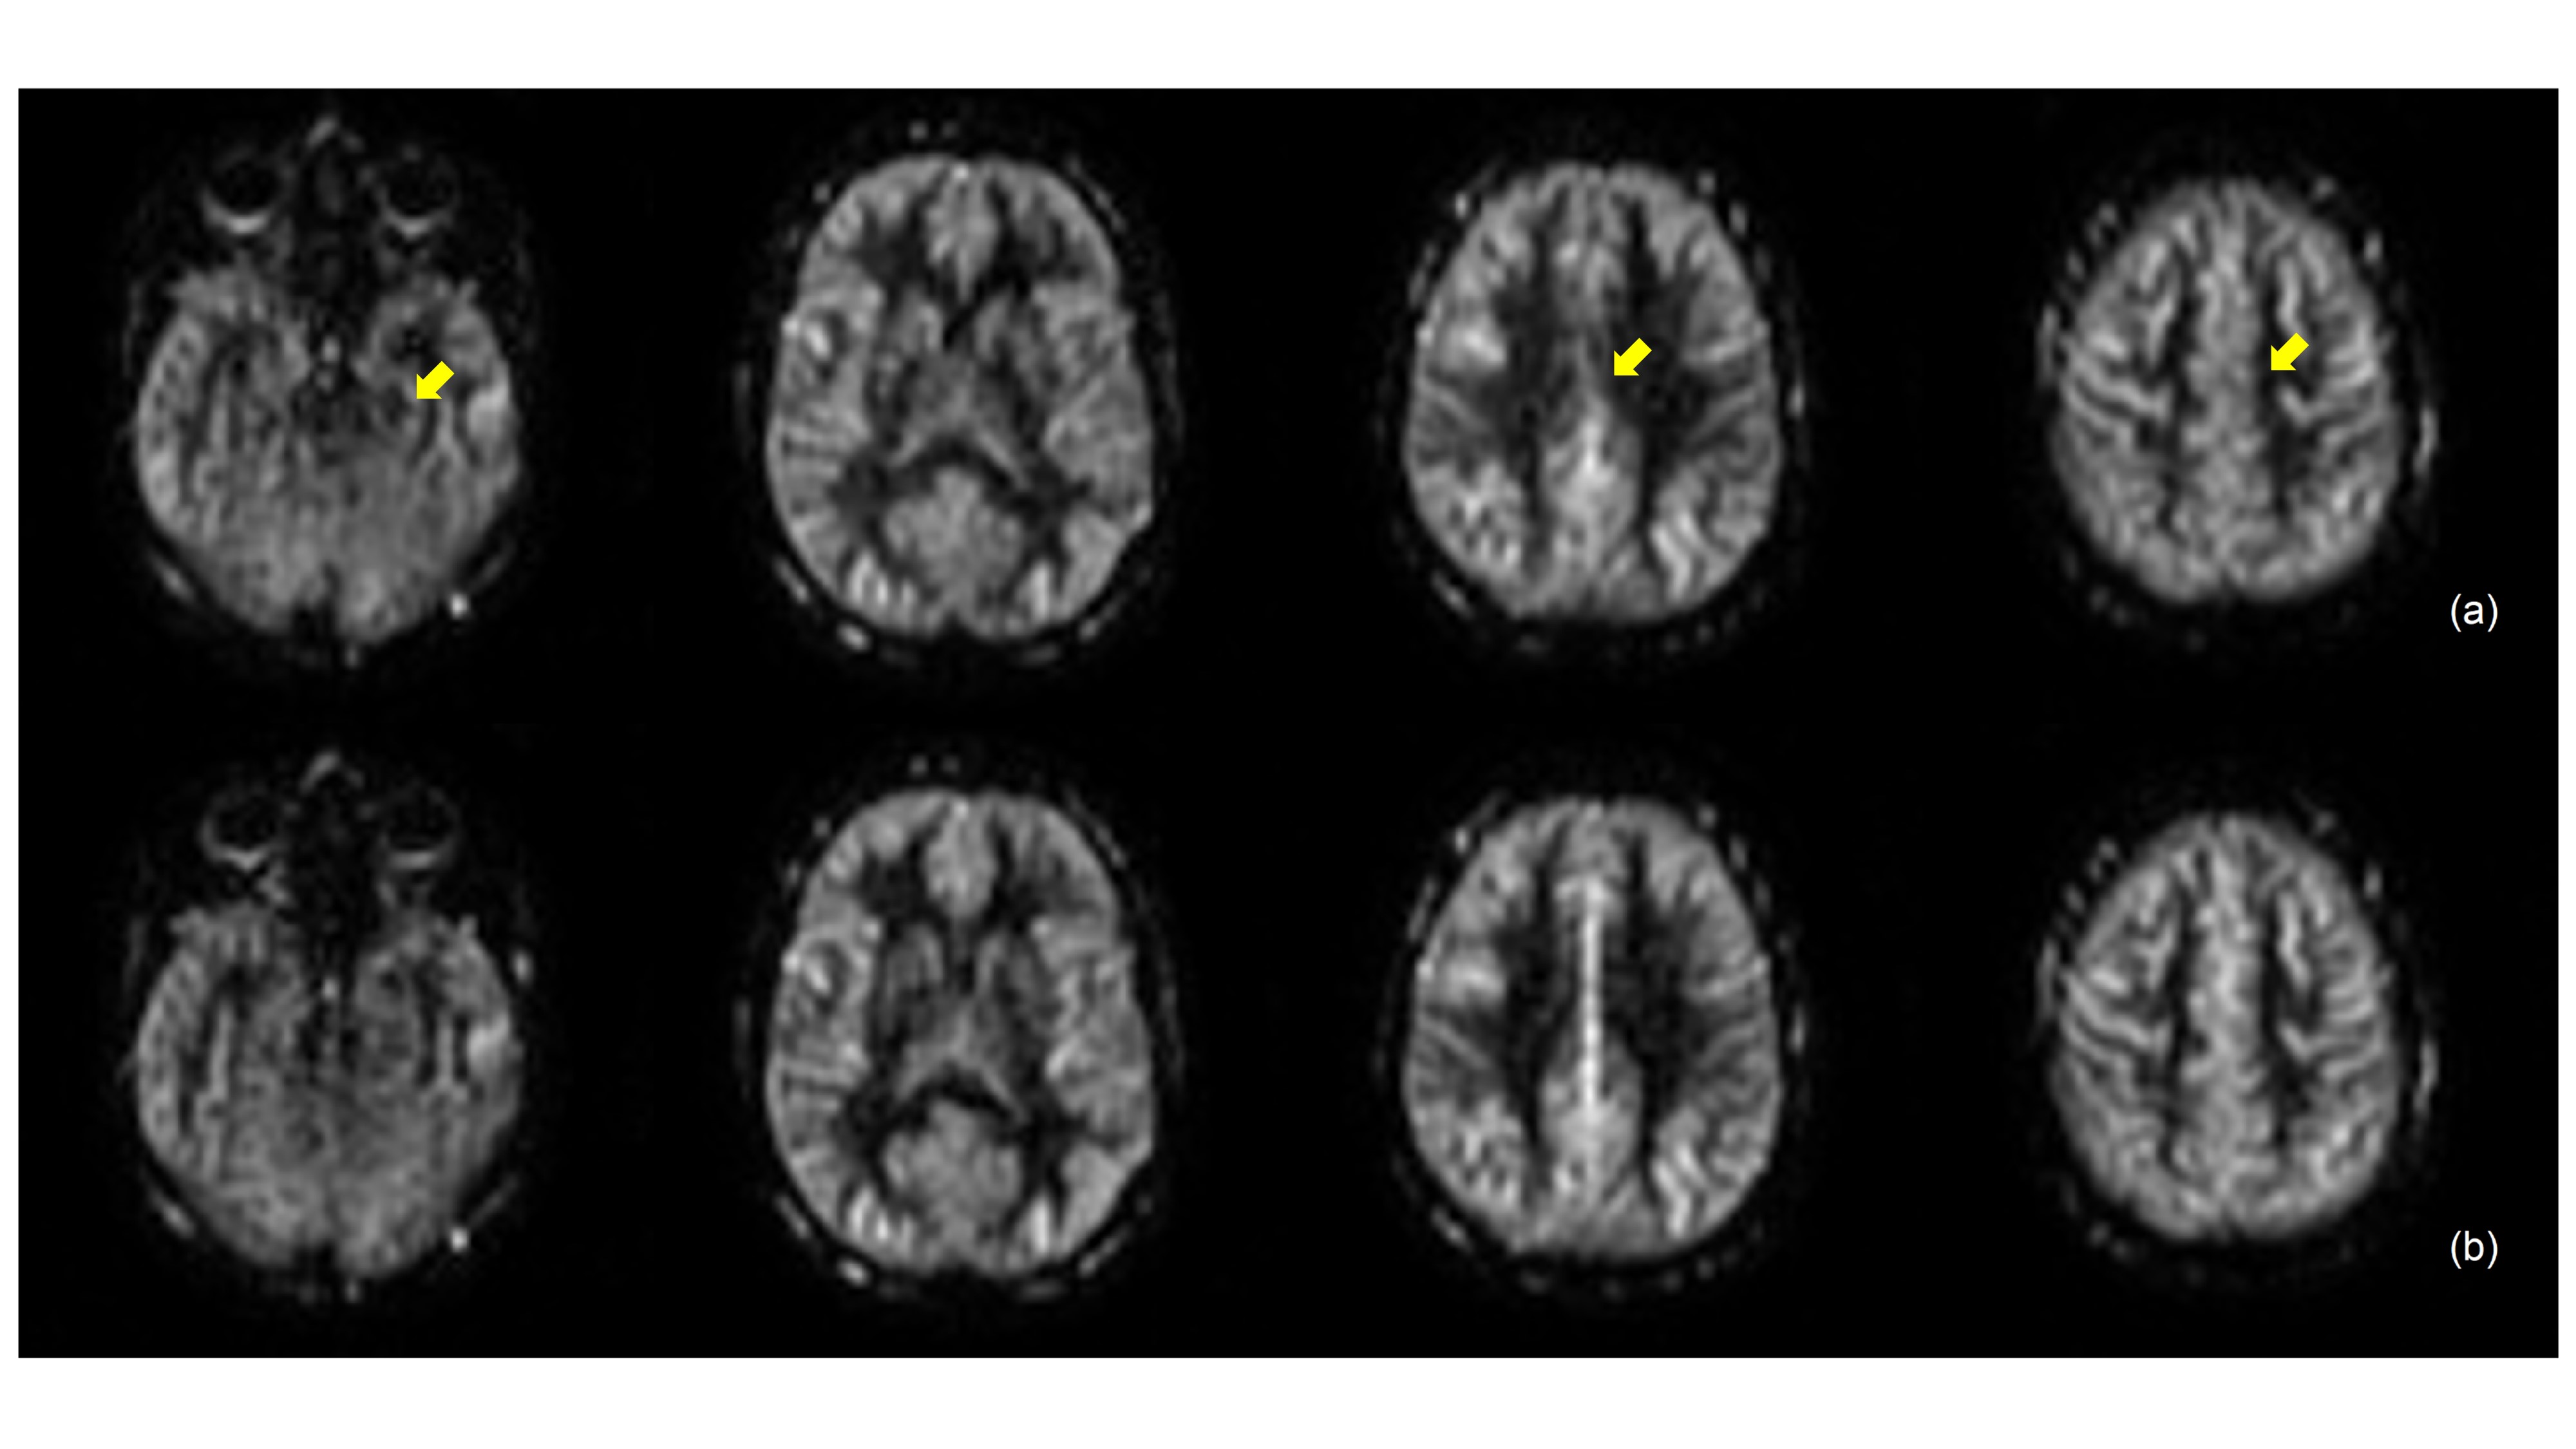
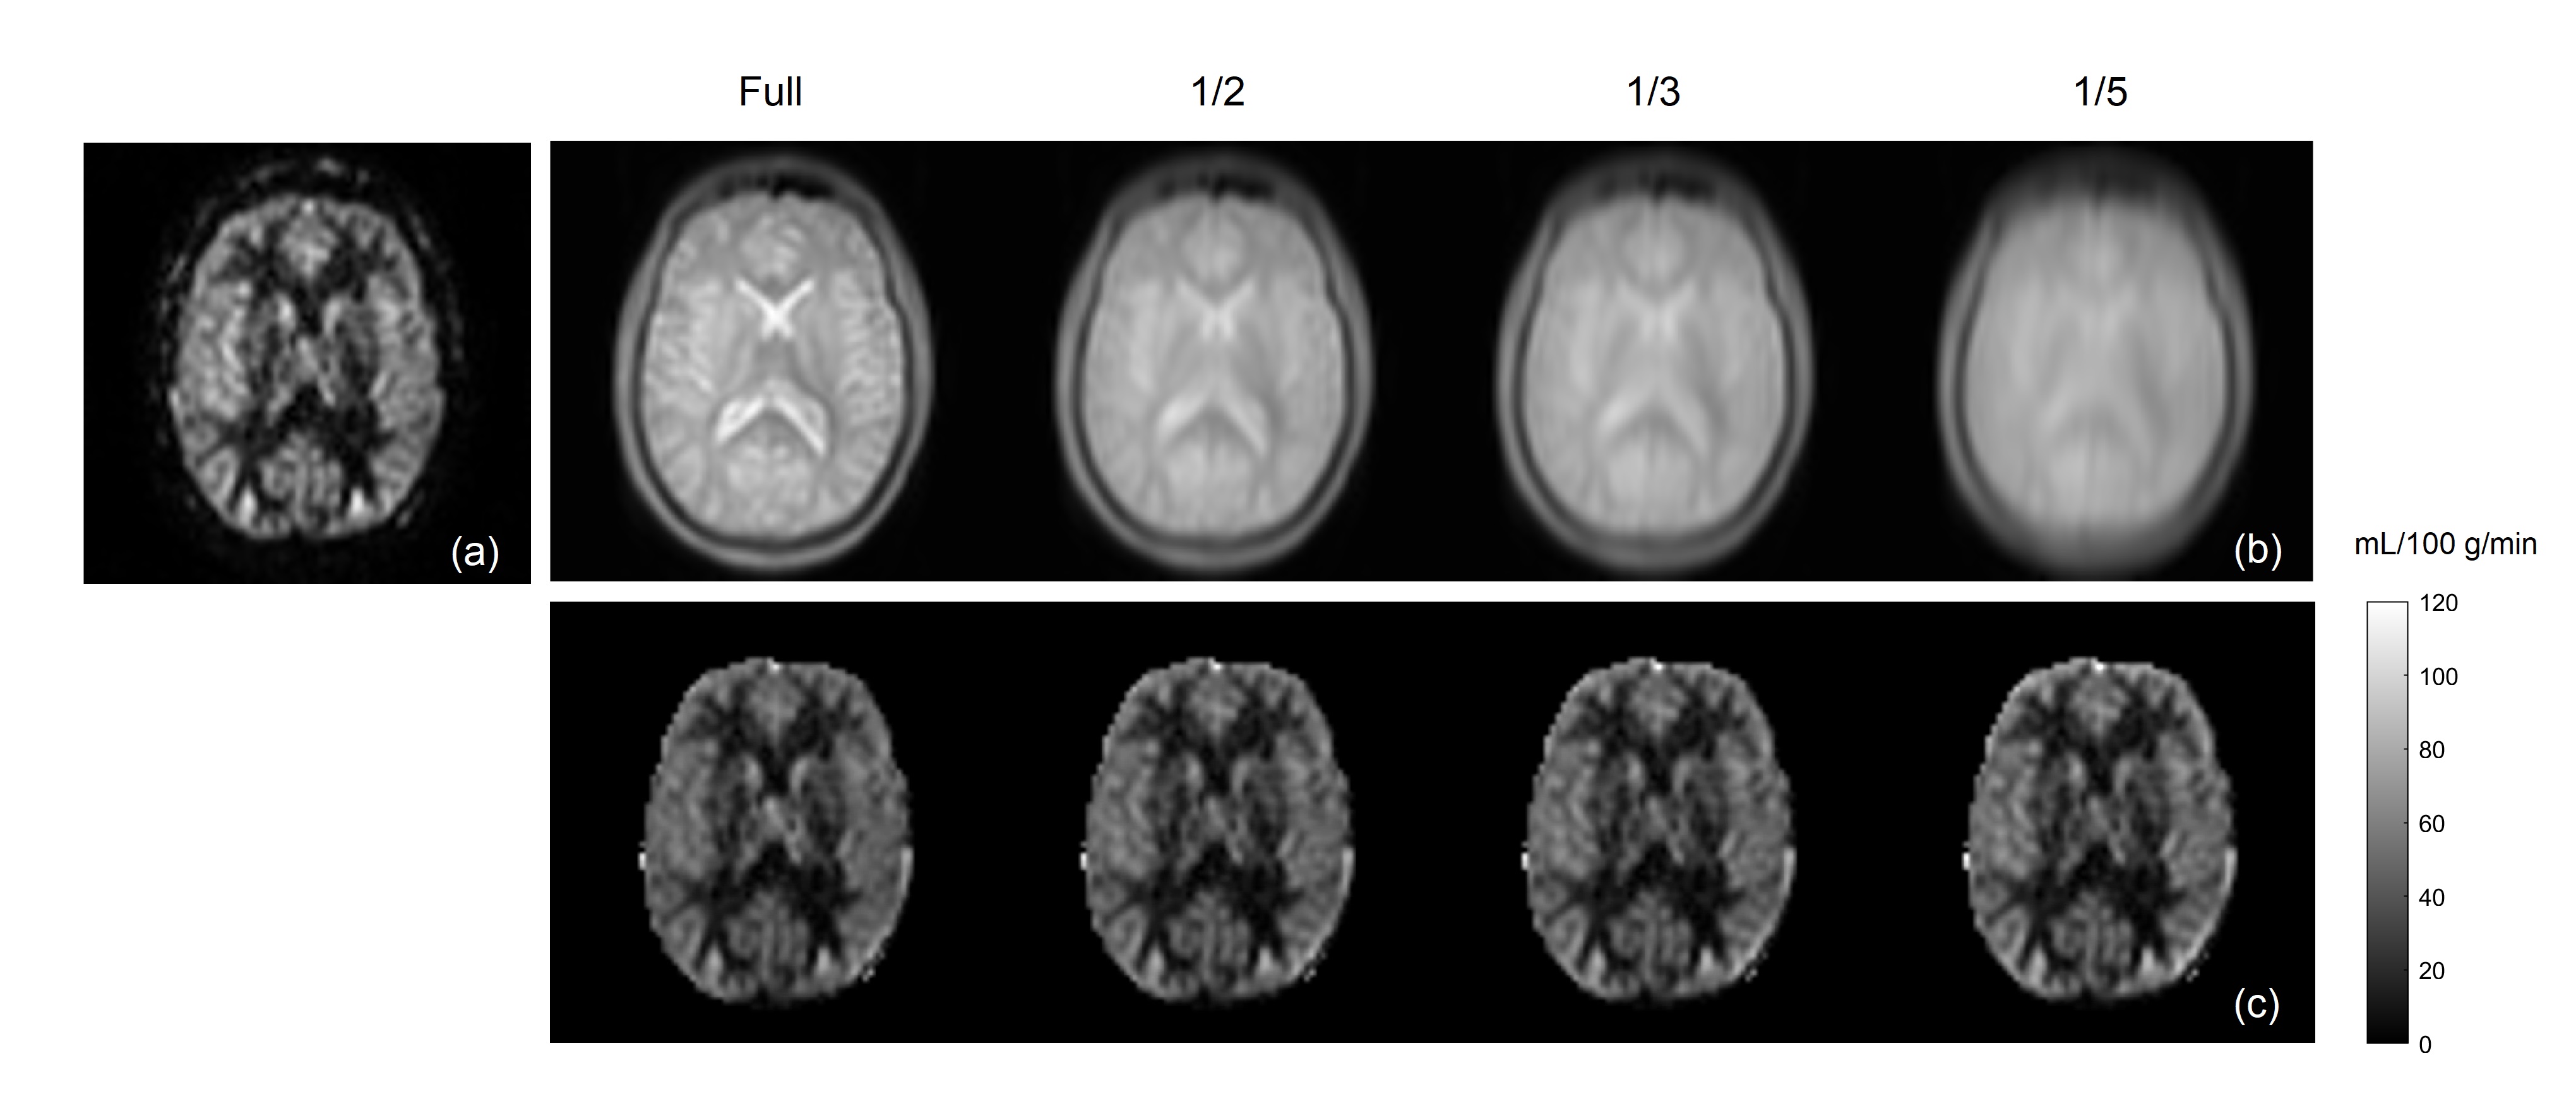
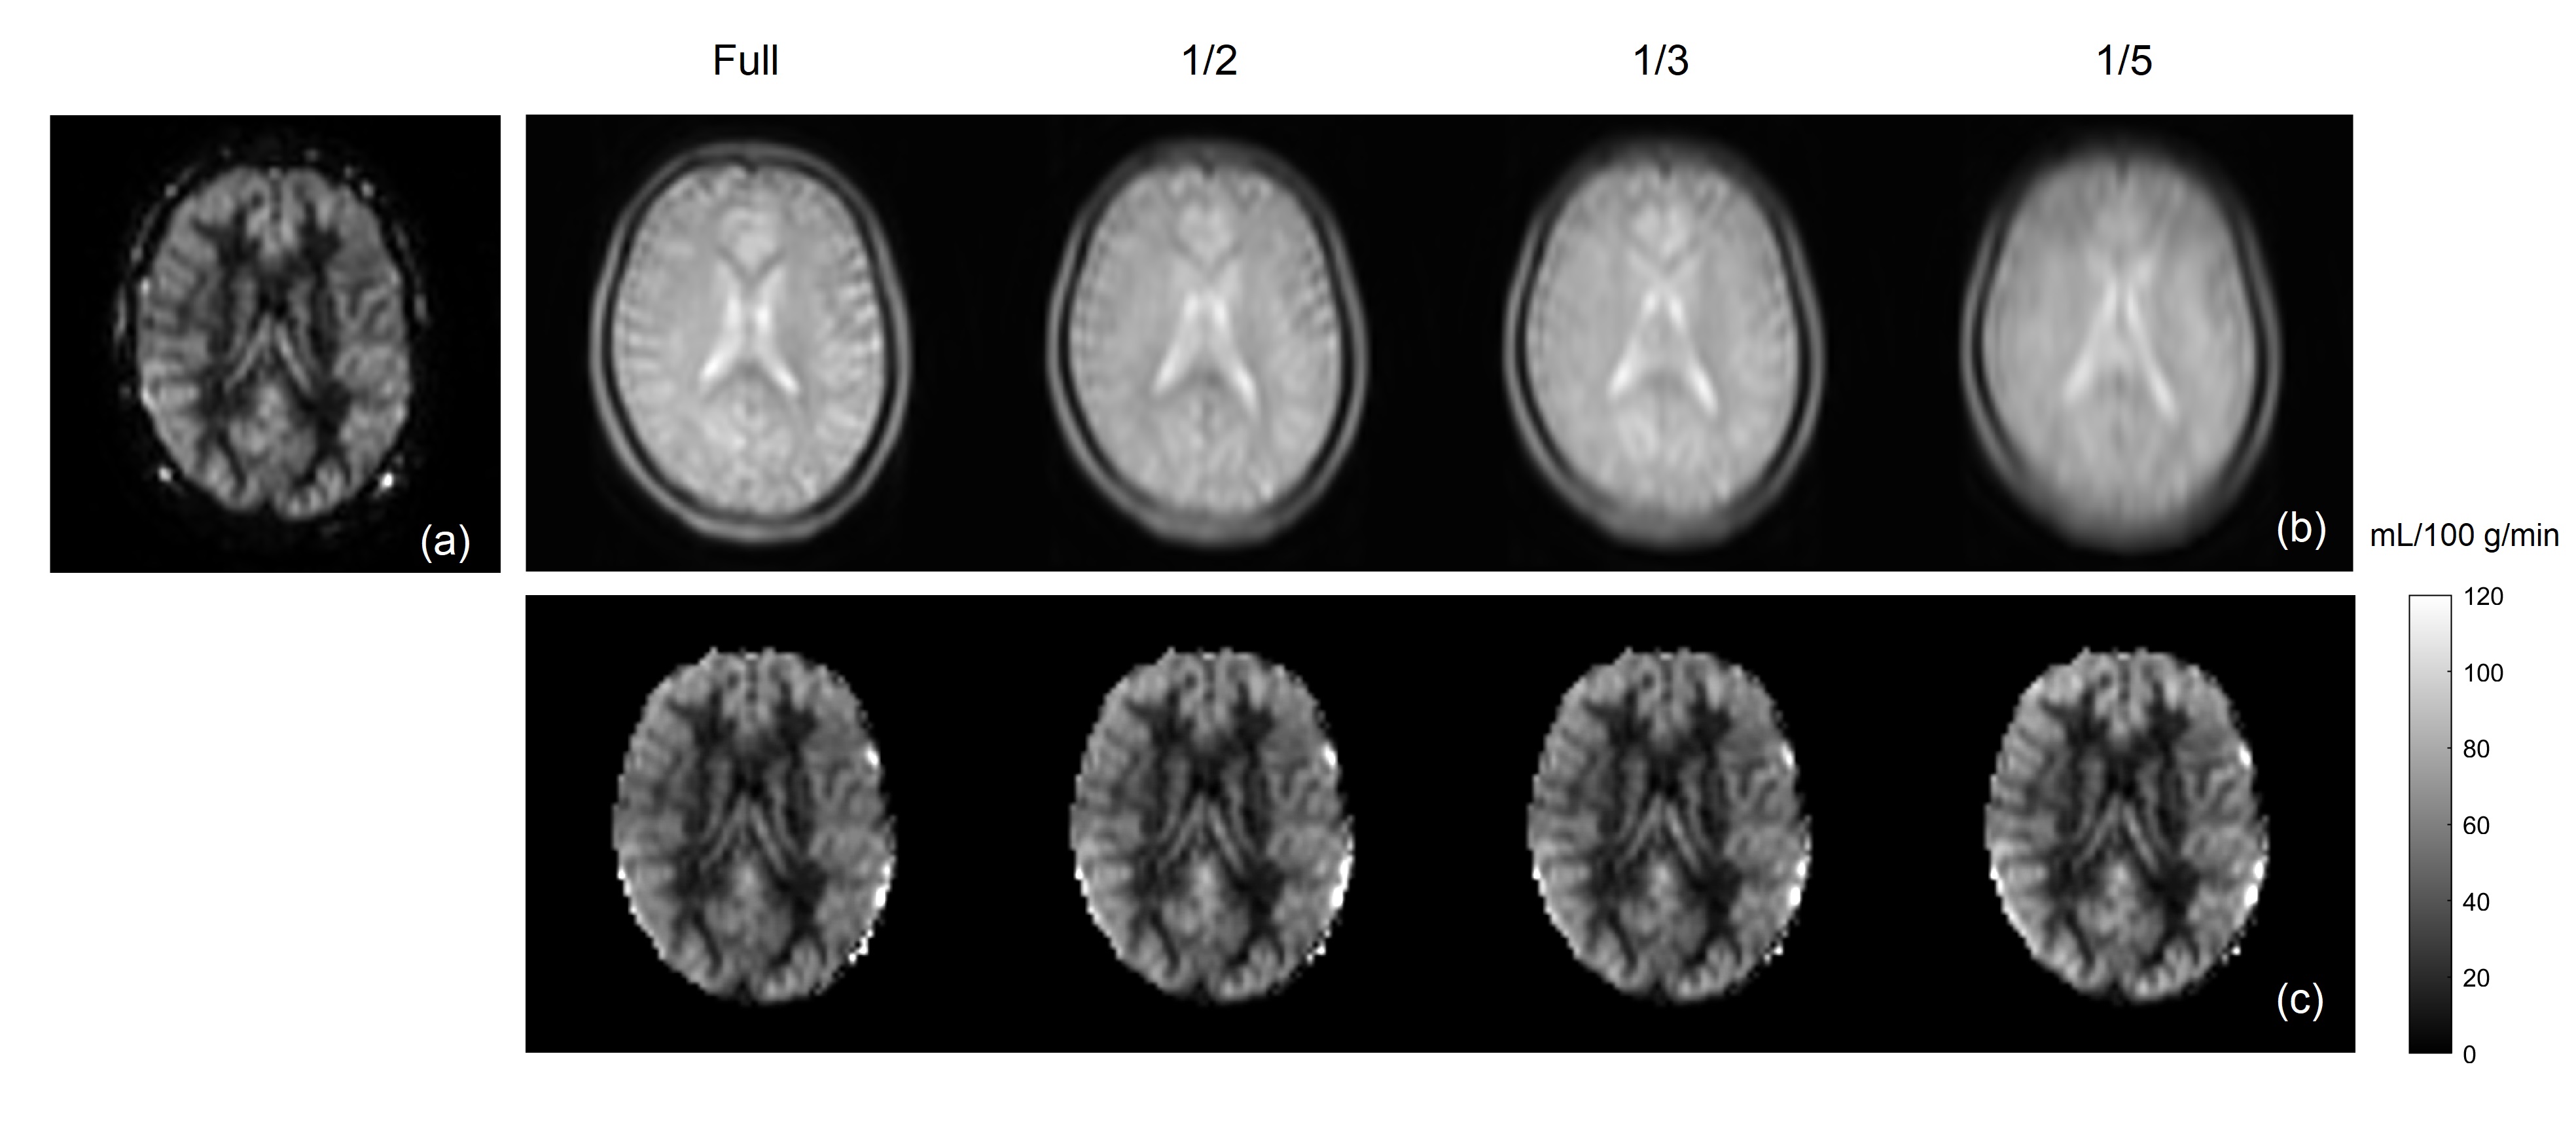
Brain perfusion weighted images acquired with the proposed VD-CASPR method showed improved SNR and robustness to signal loss compared to the original CASPR acquisition with single average (Fig. 2), albeit at longer acquisition time. Both retrospectively generated and prospectively acquired M0 images with partial k-space showed similar signal intensities overall compared to fully-acquired image, although are more blurred as expected (Fig. 3b & 4b). Nevertheless, the CBF maps calculated using both retrospectively generated and prospectively acquired M0 images with different ratios of the central k-space showed overall similar values compared to the CBF maps calculated using M0 images with fully-acquired k-space (Fig. 3c & 4c). The CBF values measured in several brain ROIs showed good agreement between using fully acquired k-space and 1/3 acquired k-space M0 images (Fig. 5).Discussion and Conclusion
The proposed VD-CASPR method acquires the center of the k-space with multiple averages in 3D Cartesian TSE acquisition, and simulates true spiral acquisitions with more densely sampling of the central k-space. This improves the SNR of the ASL images and robustness to signal loss (Fig. 2). While it increases the scan time slightly, this method can be combined with the partial k-space acquisition for M0 images to retain the total scan time, without introducing bias in CBF quantification. The VD-CASPR acquisition combined with partial k-space M0 can potentially improve ASL imaging in other anatomies, such as kidneys [5], where the SNR benefits may be more desired.Acknowledgements
This work was partly supported by the NIH/NCI grant U01CA207091.References
[1] Alsop, DC et al. MRM 2015; 73(1):102-116.
[2] Li, Z et al. MRM 2015; 75(1):266-273.
[3] Greer, JS et al. MRM 2019; 82(5):1713-1724.
[4] Chen, Y et al. JMRM 2011; 33(4):940-949.
[5] Robson, PM et al. Acad Radiol 2016; 23(2):144-154.
Figures