3280
Comparison of k-space filtering and variable flip angle schemes for reduced T2 blurring in 3D ASL MRI1Radiology, UT Southwestern Medical Center, Dallas, TX, United States, 2Pediatrics, UT Southwestern Medical Center, Dallas, TX, United States, 3Advanced Imaging Research Center, UT Southwestern Medical Center, Dallas, TX, United States
Synopsis
3D arterial spin labeled (ASL) MRI using turbo spin echo (TSE) based acquisitions suffer from image blurring, due to T2 decay along the echo train. To date, several methods have been proposed to reduce T2 blurring, including k-space filtering and variable flip angle schemes. In this study, the performances of k-space filtering was compared with variable flip angle scheme to compensate or reduce T2 blurring of 3D ASL images acquired with Cartesian TSE. Results showed k-space filtered images provided similar sharpness improvement compared with variable flip angle method.
Introduction
3D TSE and GRASE acquisitions are recommended for brain ASL because of their high SNR and compatibility with optimal background suppression [1]. While 3D TSE acquisitions are more robust to B0 inhomogeneities, they suffer from image blurring due to T2 decay along the long echo trains. Several methods have been proposed to reduce or compensate T2 blurring, including k-space filtering [2, 3] and variable flip angle schemes [4]. While variable flip angle methods can reduce T2 blurring, it needs optimization and may be more sensitive to B1 inhomogeneities compared to constant refocusing flip angle method. In this study, we compared the variable flip angle schemes [4] implemented in 3D Cartesian TSE acquisition, with k-space filtering method [2] using a constant refocusing flip angle scheme for robust 3D ASL images of brain perfusion.Methods
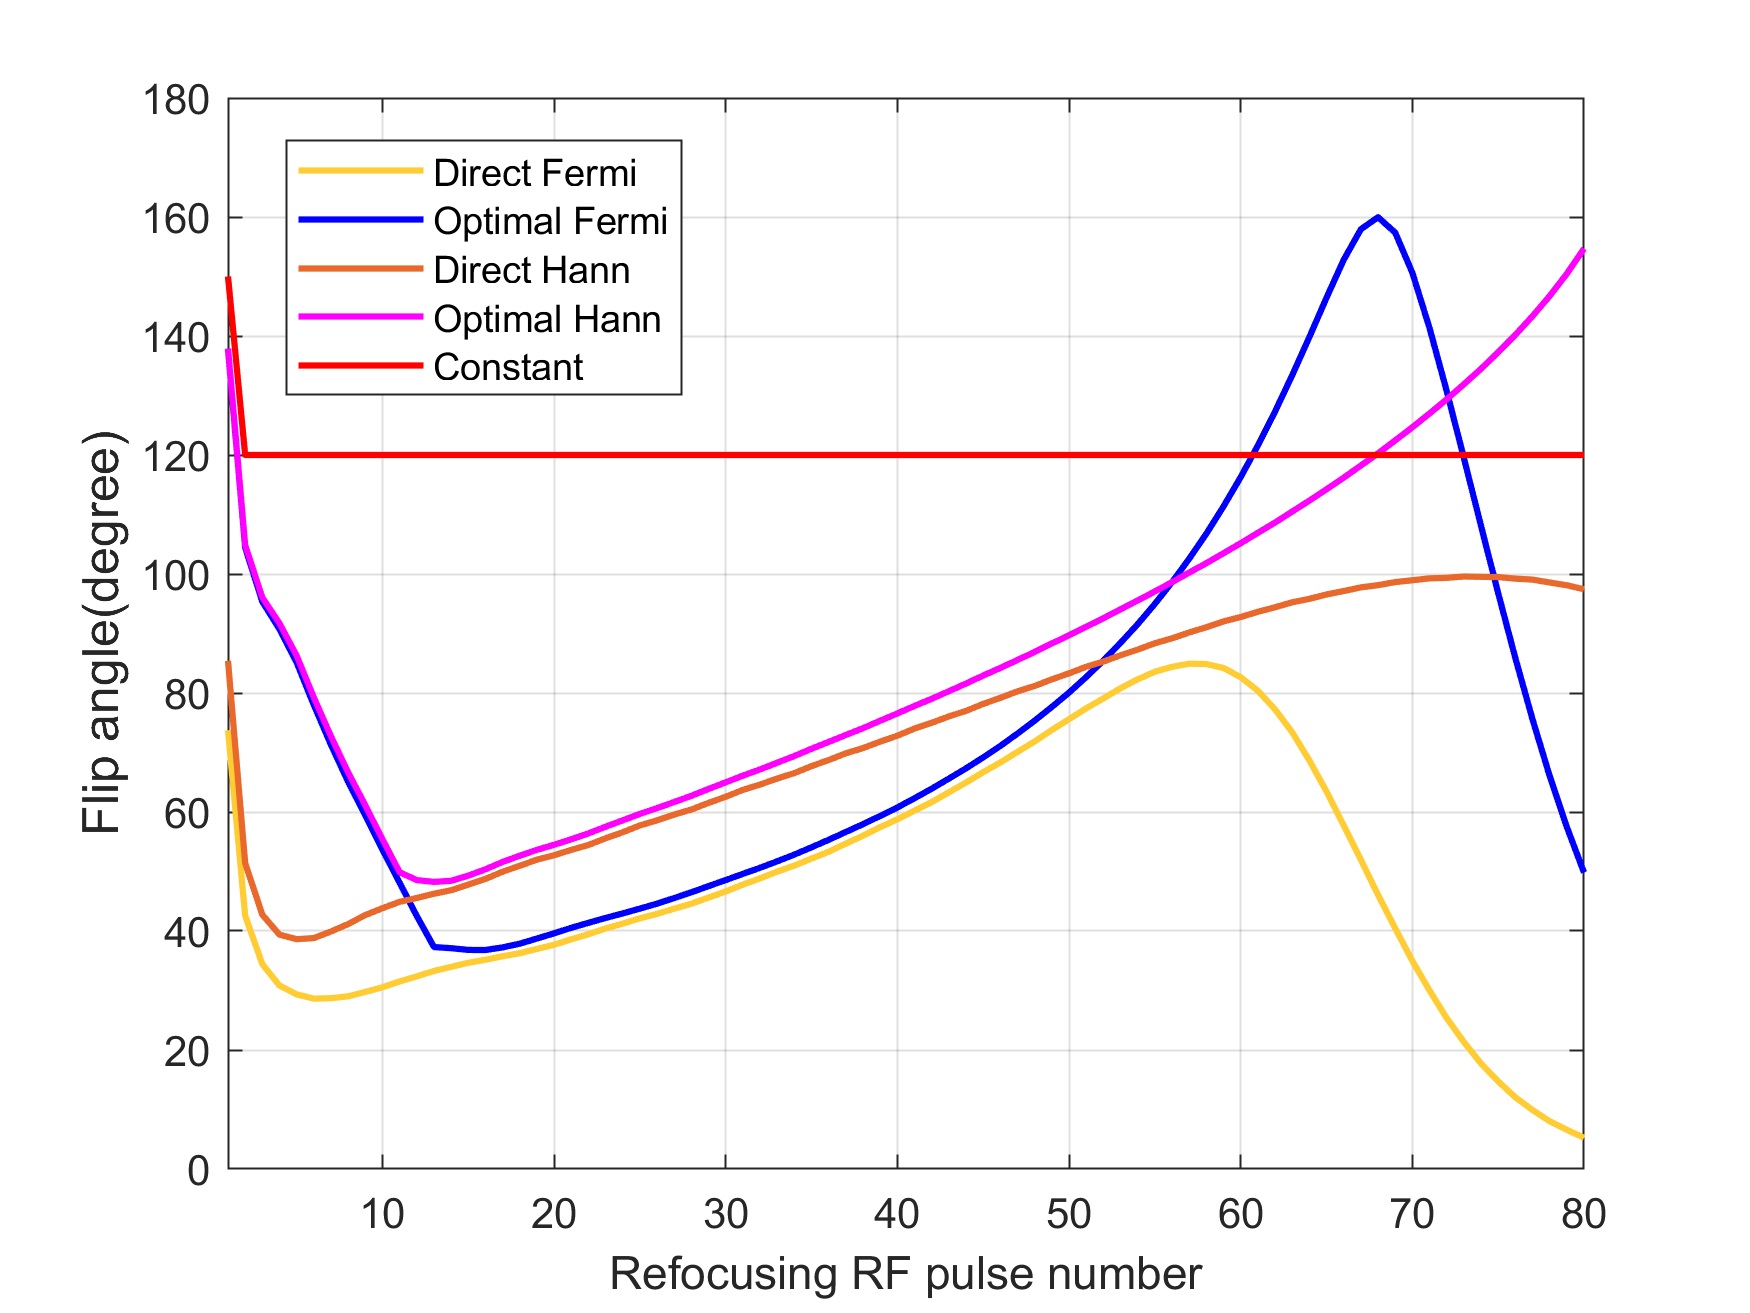
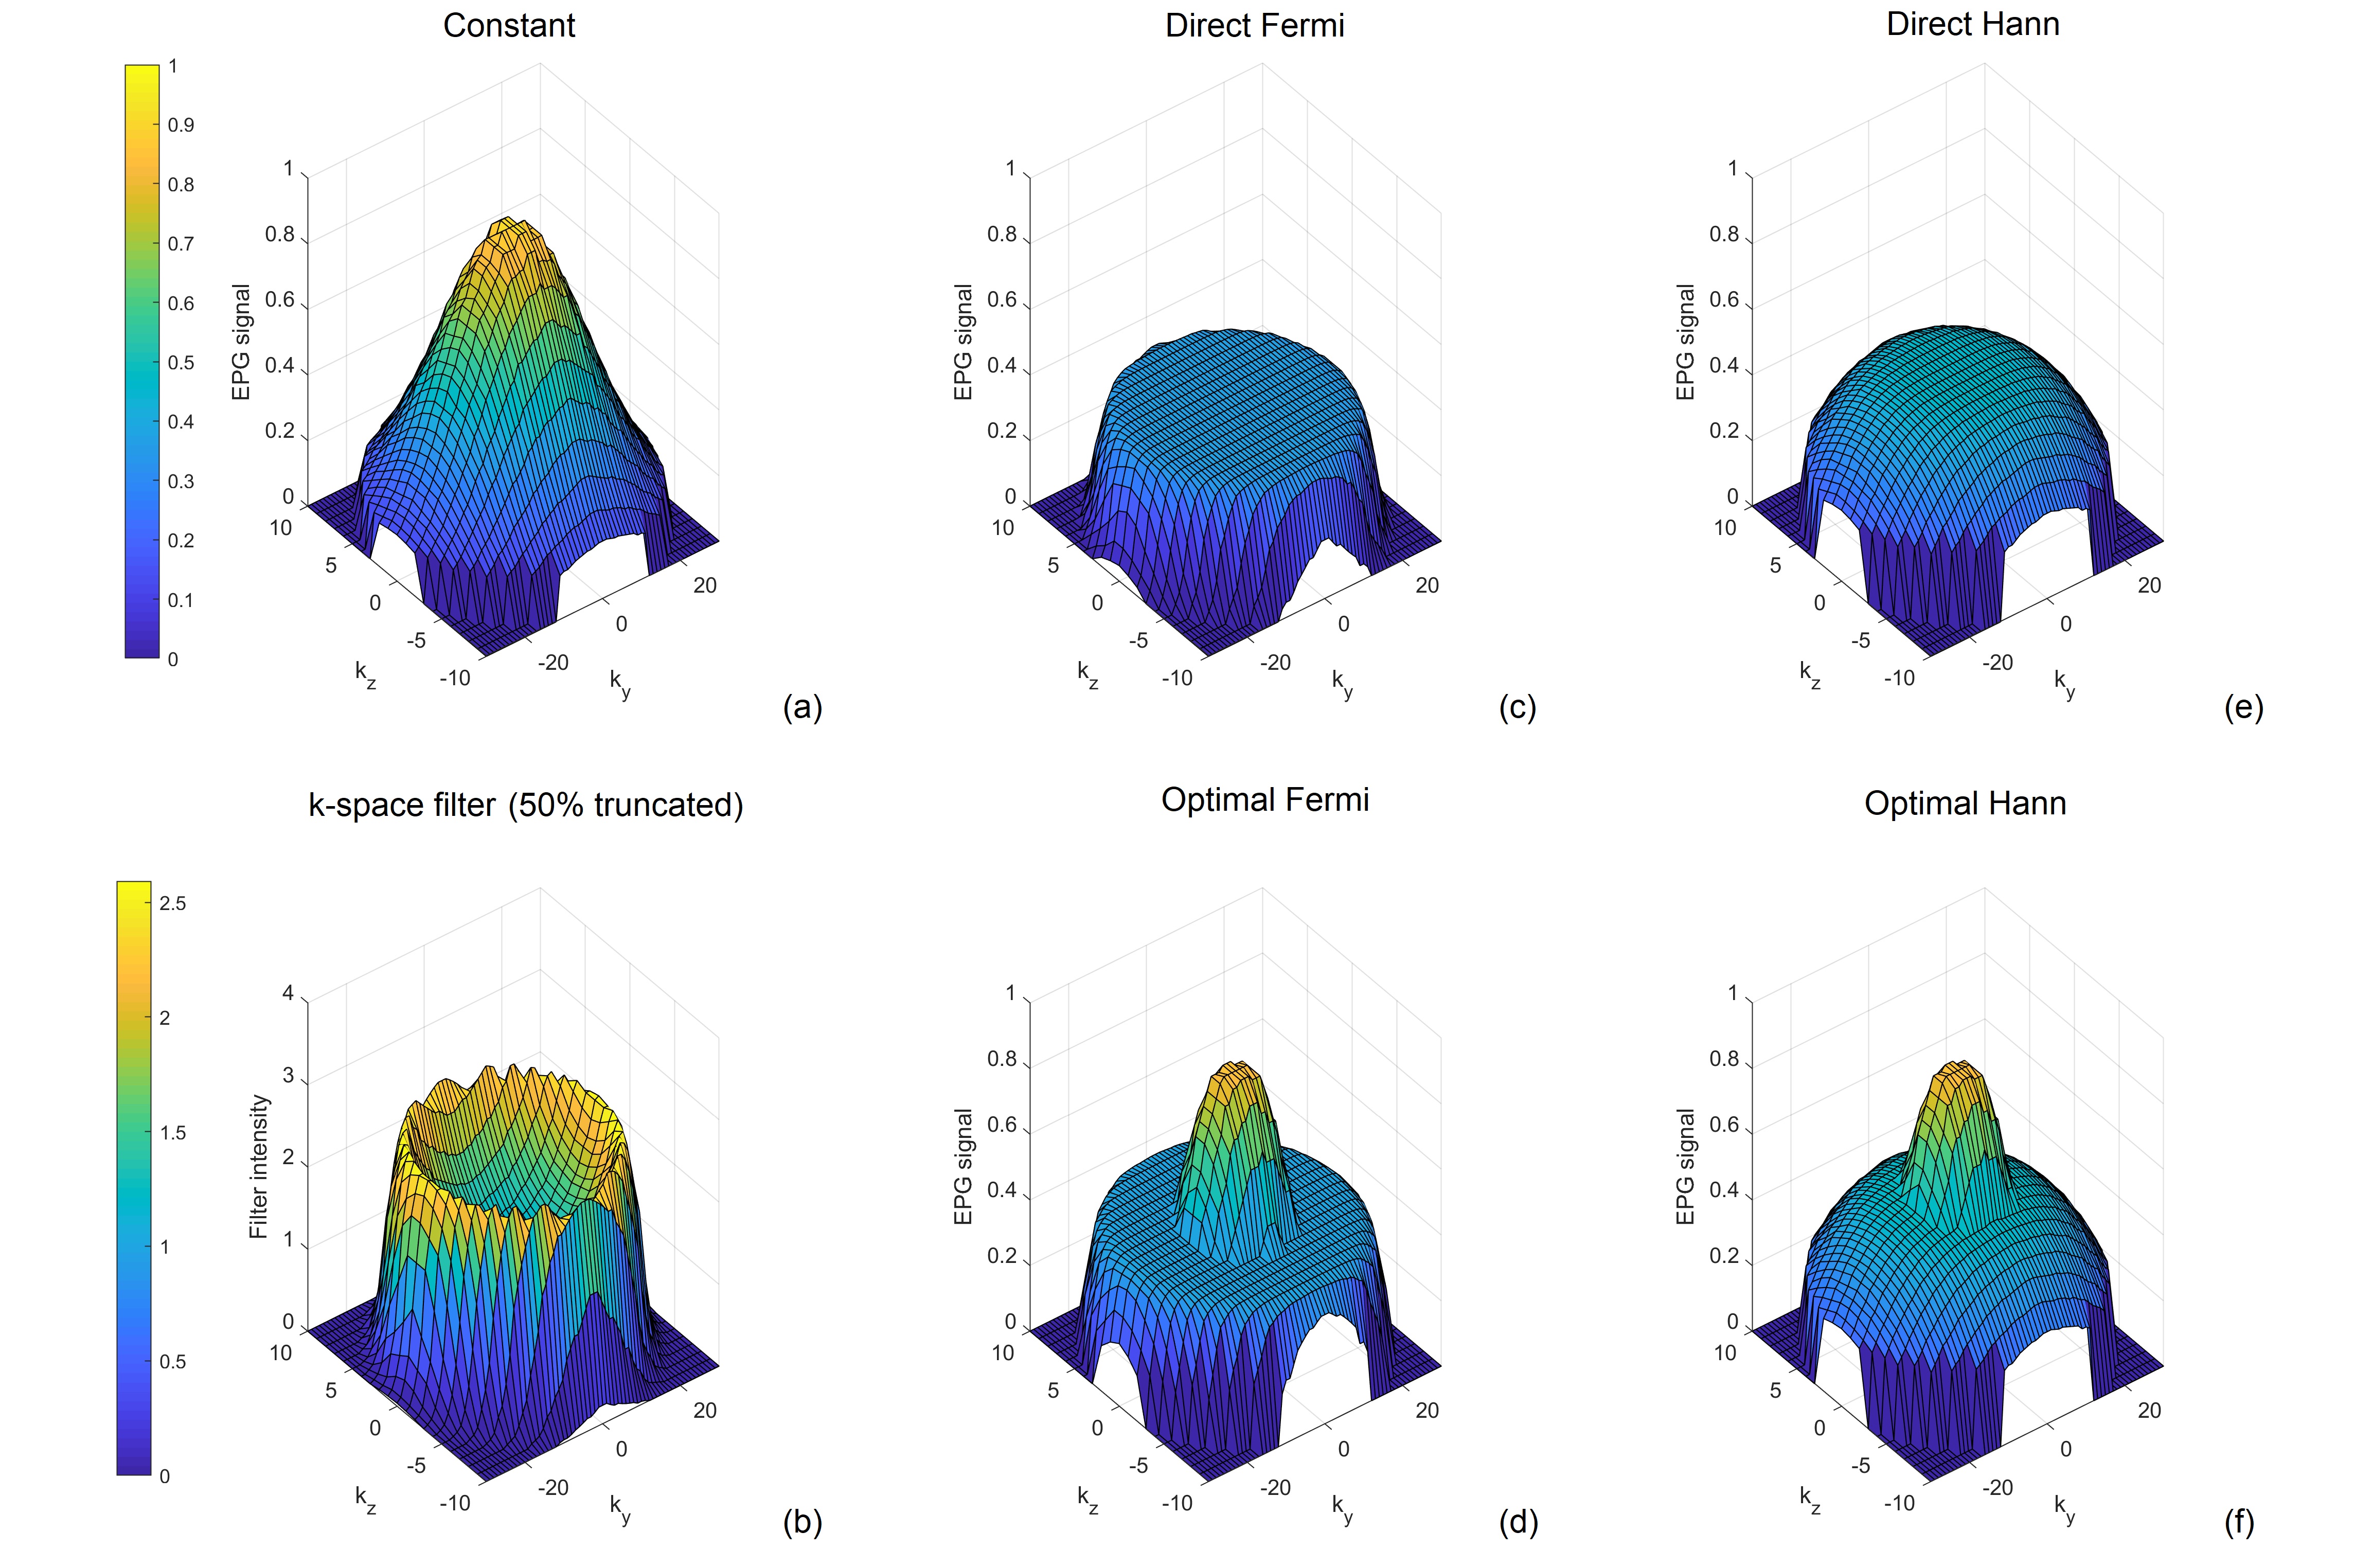
Variable flip angle schemes: Variable flip angle schemes were designed using the extended phase graph (EPG) algorithm [5] using gray matter T1 and T2 [6], inversely calculated from the predefined signal shapes along the echo train. The signal shapes were defined either as a Fermi or Hann function (‘direct Fermi’ or ‘direct Hann’ [4]), or the adapted forms (‘optimal Fermi’ or ‘optimal Hann’ [4]) which used increased amplitudes in the first few echoes to improve SNR. Maximum amplitudes and linewidths allowed by the EPG algorithm were used for these signal shapes for the benefit of SNR, by means of iterating among a range of different values. A Fermi filter was then used with optimized radius (r = 56) and width (w = 8) to increase the overall SNR of the images. The resultant signals of different variable flip angle schemes were simulated as well using the EPG algorithm to validate the calculated flip angles.k-space filtering method: A k-space filtering method was designed as the inverse of the EPG simulated signal along the echo train to compensate for the T2 decay modulation, combined with a Fermi function to minimize the noise contribution in the later echoes. The k-space filter intensity increases before reaching the 50% of the ETL and progressively decays to 0 at the end of the echo train. This k-space filtering method was applied to ASL images acquired with a constant refocusing flip angles of 120°.
MR Acquisition: This study used pseudo-continuous ASL (pCASL) with optimized background suppression and a 3D TSE Cartesian acquisition with Spiral Profile Reordering (CASPR) on a 3T scanner (Ingenia, Philips Healthcare) [7]. 3D ASL was performed in 2 healthy volunteers with IRB approval. The imaging parameters were: TR/TE = 6000/14 ms, FOV = 220x220x110 mm3, matrix = 64x64 with 36 slices, acquired resolution = 3.5x3.5x6 mm3, reconstructed resolution = 3x3x3 mm3, label duration = 1.8 s, post-label delay = 1.8 s, 1 repetition, 4 background suppression pulses and acquisition time = 3:00 minutes. A M0 image was acquired using same acquisition parameters in 1:30 minutes. Other parameters were echo spacing = 2.8 ms and ETL = 80. Each volunteer was scanned with 5 ASL acquisitions with different refocusing flip angle schemes, including constant, direct Fermi, direct Hann, optimal Fermi, and optimal Hann.
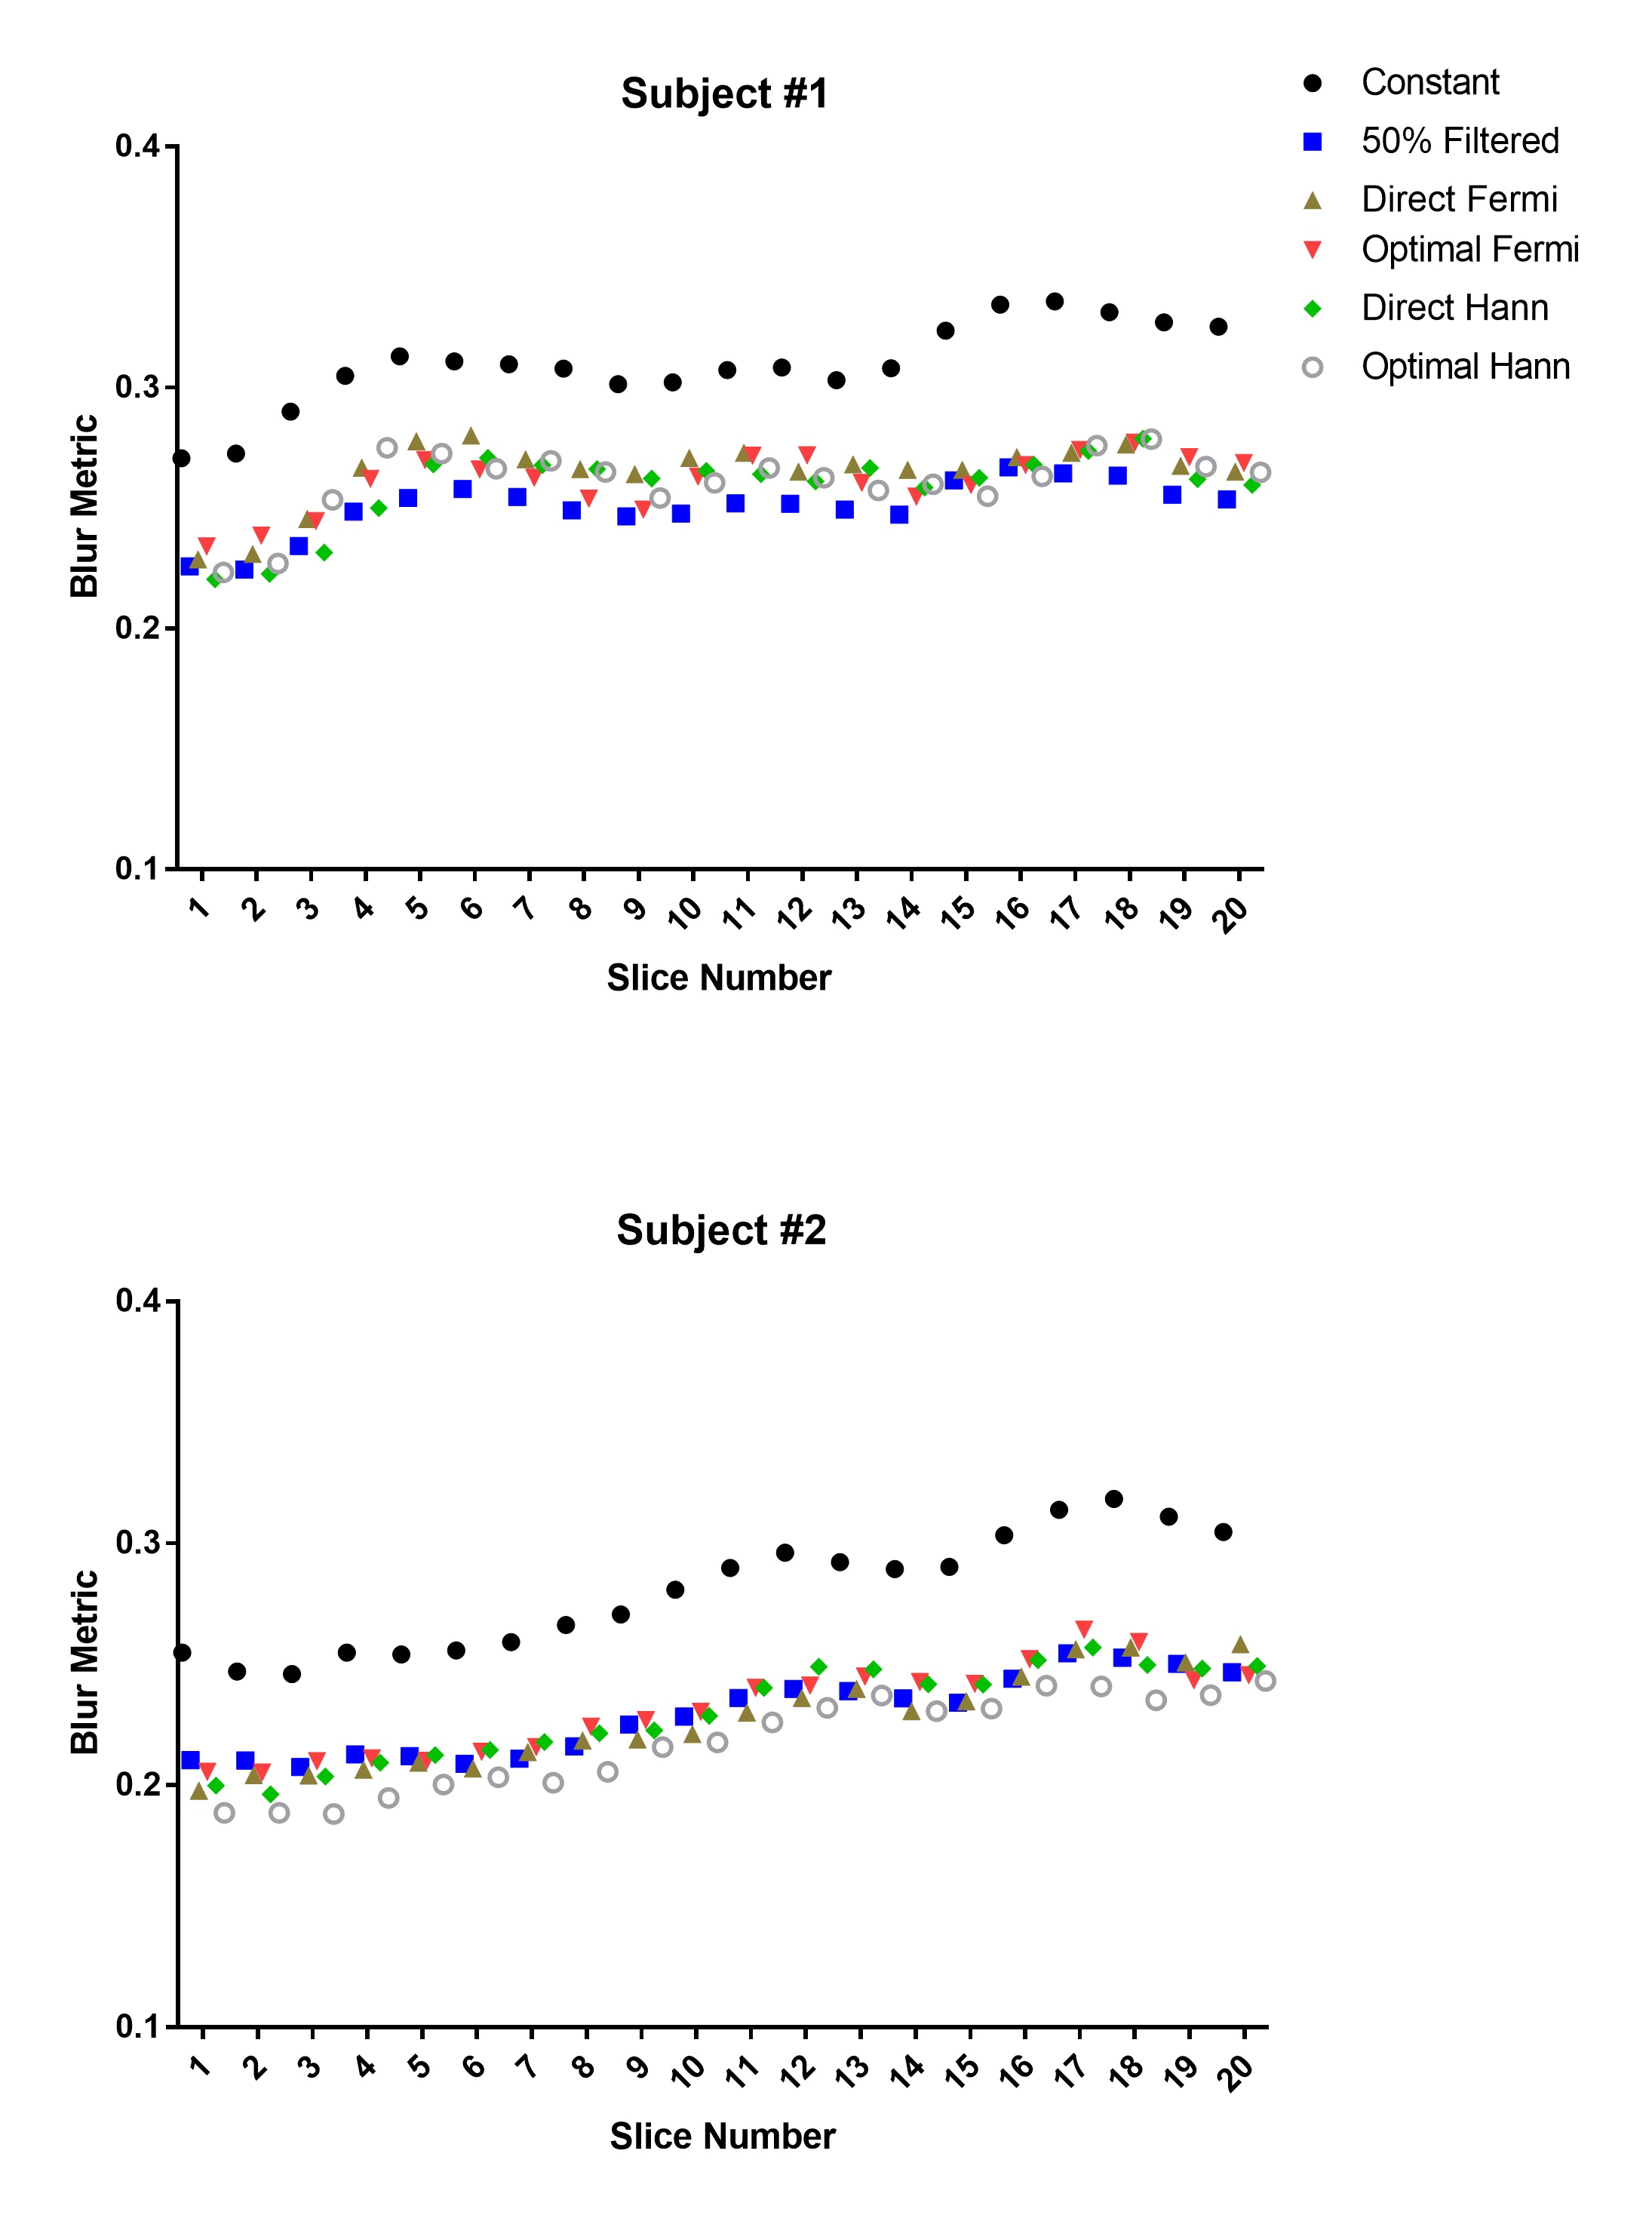
Image analysis: The k-space filtering combined with the Fermi windowing was implemented on the scanner reconstruction platform (Philips Recon 2.0). A blur metric was used to quantitatively determine the blurring of the images [8].
Results
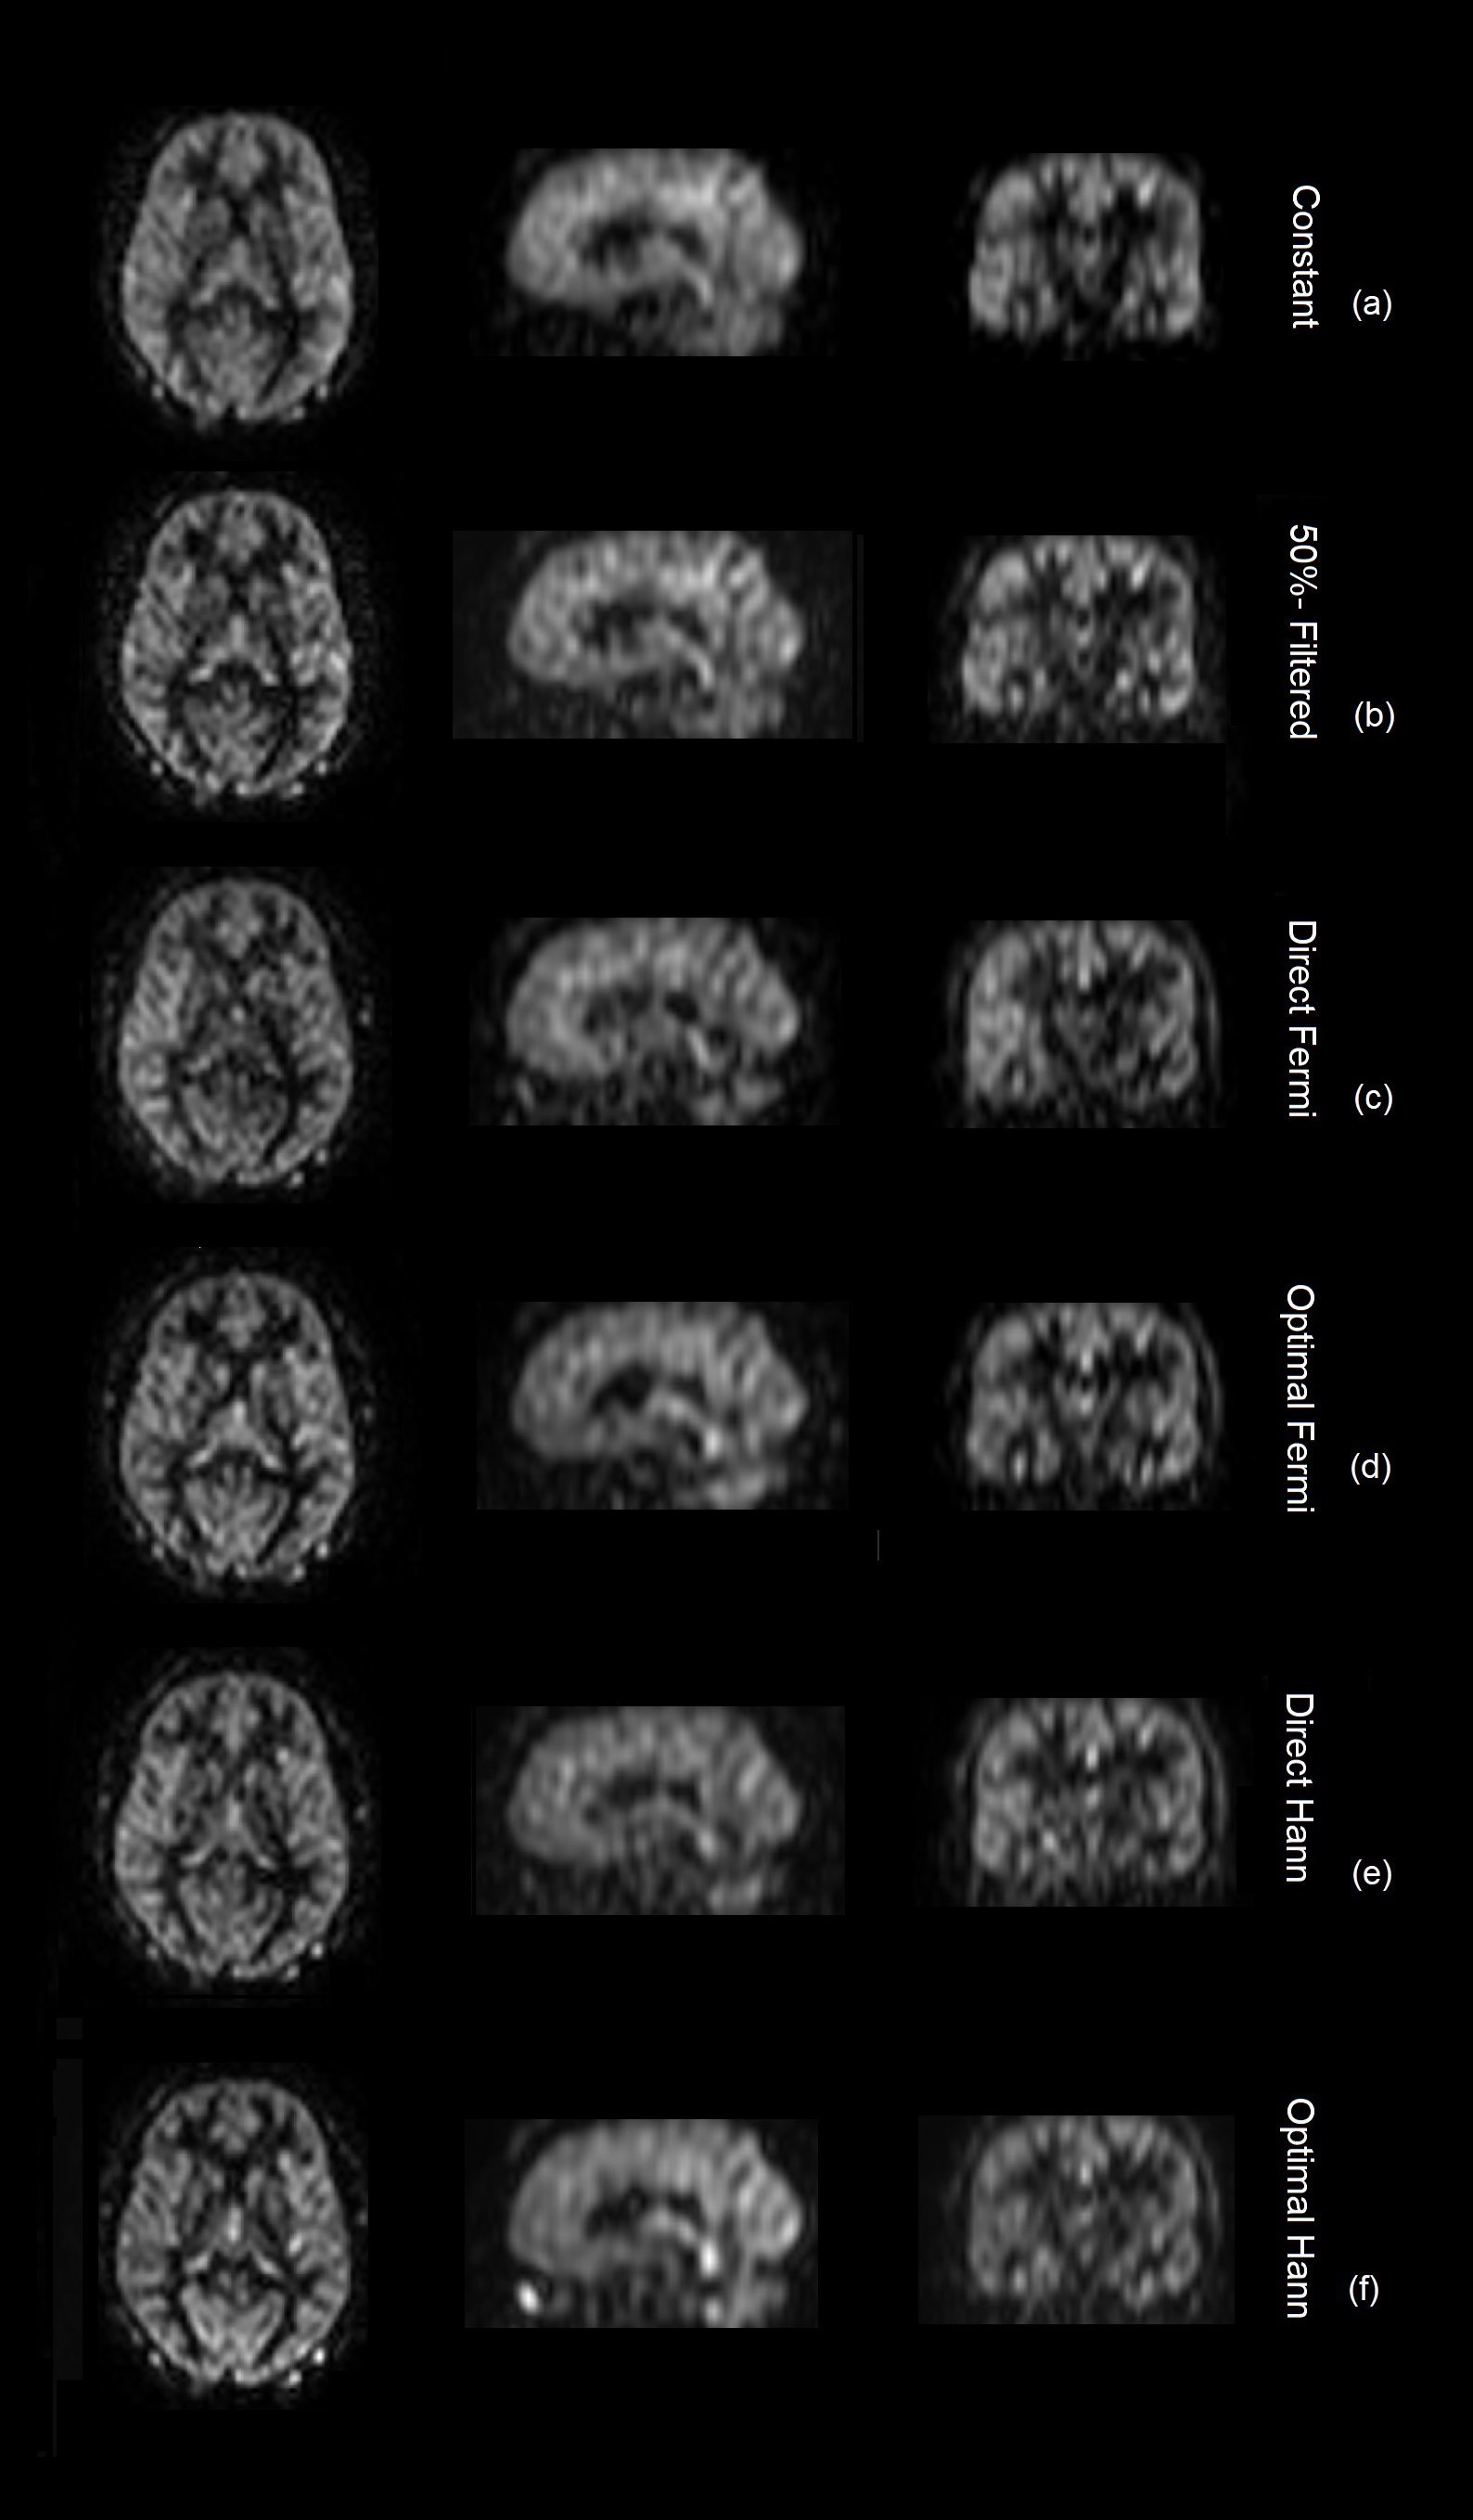
Fig. 1 shows the flip angle schemes of different methods along the echo train (ETL = 80), where the ‘optimal’ methods have larger values than ‘direct’ methods, in particular for the first few refocusing flip angles. Fig. 2c-f show the EPG simulated signals of different flip angle designs, where the signals at the peripheral k-space are better maintained than the constant flip angle design (Fig. 2a), to which a truncated k-space filter (Fig. 2b) was applied to demodulate the signal decay. Fig. 3c-f show the 3D brain ASL images in a volunteer using different variable flip angle schemes, compared against the constant flip angle image without (Fig. 3a) and with (Fig. 3b) k-space filtering, showing reduced blurring with both variable flip angle and k-space filtering methods. Fig. 4 shows the blur metric values calculated at the central slices in the 3D ASL images acquired in 2 healthy volunteers with variable flip angle schemes, compared against the values of constant flip angle images without and with k-space filtering. ASL images acquired with constant refocusing flip angles combined with k-space filtering showed similar blur metric values compared with images acquired using variable flip angle schemes (Fig. 4).Discussion and Conclusion
Variable flip angle schemes were designed and applied to 3D brain ASL images acquired with 3D Cartesian TSE, and its performance in reducing T2 blurring was compared against k-space filtering with constant flip angle methods. Optimized k-space filtering with constant refocusing flip angle could achieve similar deblurring provided by variable flip angle schemes, and can be more robust to B1 inhomogeneities. Future study will consider comparing these two methods systematically in more volunteers and evaluate its sensitivity to B1 inhomogeneities.Acknowledgements
This work was partly supported by the NIH/NCI grant U01CA207091.References
[1] Alsop, DC et al. MRM 2015; 73(1):102-116.
[2] Wang, Y et al. ISMRM 2019:4962.
[3] Galazzo, IB et al. ISMRM 2014:2704.
[4] Zhao, L et al. MRM 2018; 80(4):1391-1401.
[5] Hennig, J et al. MRM 2004; 51(1):68-80.
[6] Wright, PJ et al. MAGMA 2008; 21(1-2):121-130.
[7] Greer, JS et al. MRM 2019; 82(5):1713-1724.
[8] Crete-Roffe, F et al. HVEI 2007; 12:6492-6416.
Figures