3278
High-resolution whole brain perfusion mapping in mice by a drift-corrected steady pulsed imaging and labeling sequence1Institute of Science and Technology for Brain-Inspired Intelligence, Fudan University, Shanghai, China, 2Key Laboratory of Computational Neuroscience and Brain-Inspired Intelligence (Fudan University), Ministry of Education, Shanghai, China, 3Russell H. Morgan Department of Radiology and Radiological Science, Johns Hopkins University School of Medicine, Baltimore, MD, United States, 4F.M. Kirby Research Center for Functional Brain Imaging, Kennedy Krieger Institute, Baltimore, MD, United States
Synopsis
We developed a drift-corrected steady pulsed imaging and labeling (dSPIL) to measure CBF with high-resolution and whole brain coverage. We applied a metric of low band pass to remove MRI signal drift using interleaved label-control images. We also optimized several key imaging parameters in an effort to minimize scan time while covering the whole brain. With the optimized dSPIL scheme, quantification of high-resolution CBF in 22 mouse brain regions can be obtained. As a demonstration and validation of the method, the volume of ischemic lesion regions in mice was quantified by calculating CBF reductions.
Introduction
Several multi-slice pulsed arterial spin labeling (PASL) techniques have been developed to measure cerebral blood flow (CBF) in both human and animals 1–3. Although these methods provide high labeling efficiency and low specific absorption rate (SAR), they suffer from EPI-induced distortions, limited acquisition efficiency, limited brain coverage and finite bolus duration. In the present work, unlike EPI-based PASL scheme, we sought to develop a new steady state perfusion method based on our previous work 4, named drift-corrected steady pulsed imaging and labeling (dSPIL), to measure CBF with high-resolution and whole brain coverage. A metric of low band pass will be applied to remove MRI signal drift using interleaved label-control images. We also try to optimize several key imaging parameters, including exchange time (tmix), spatial resolution, and number of slices in an effort to minimize scan time while covering the whole brain. With the optimized dSPIL scheme, quantification of high-resolution CBF in 22 mouse brain regions can be obtained. As a demonstration and validation of the method, the volume of ischemic lesion regions in mice will be quantified by calculating CBF reductions.Materials and Methods
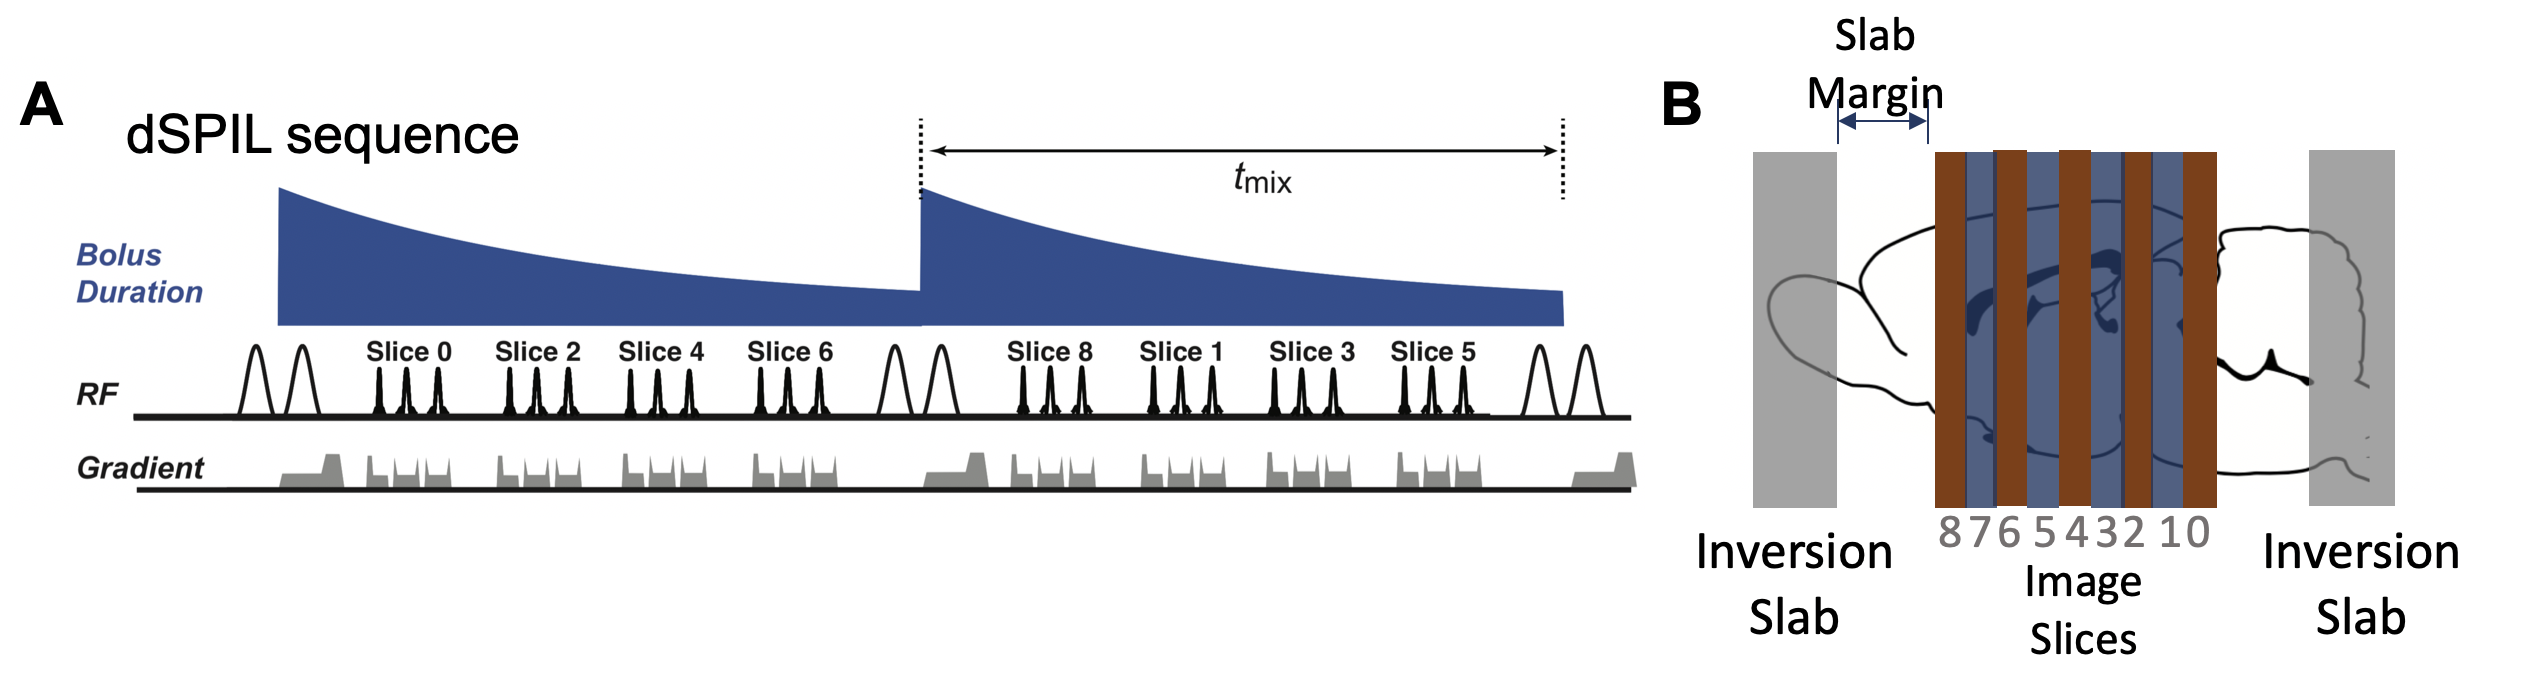
dSPIL sequence: As shown in Fig. 1A, the dSPIL scheme repeats a label-and-exchange module (LEM) consisting of an un-inverted flow-sensitive alternating inversion recovery (UNFAIR) 5 labeling unit, followed by an exchange time (tmix) to extend the bolus duration to the total experimental time. Multi-slice images are acquired during each exchange time (Fig. 1B). For each exchange time, four slices are acquired instead of single slice in the original SPIL study 4.Animals: All experimental protocols were approved by the Animal Ethics Committee of Fudan University. A total of 10 C57BL/6J adult mice were obtained from Slac Laboratory (Shanghai, China). Six mice were used for optimizing the dSPIL method. Four mice received a right carotid artery ligation to create ischemic stroke model. All animals were anesthetized by 1% to 1.5% isoflurane during the MR scanning. Body temperature was maintained at 37°C. Respiration was monitored and maintained at 95-110/min.
MRI: An 11.7T BioSpec 117/16 USR MRI system equipped with a CryoProbe (Bruker BioSpin, Ettlingen, Germany) was used. A 72 mm volume resonator and a 2×2 phased array coil were used for transmission and image acquisition, respectively. High-resolution perfusion images of the whole brain were acquired using a fast spin-echo (FSE) sequence with TR = 5s; effective TE = 3 ms; RARE factor = 18; slice thickness = 1 mm; total experimental time is 8 minutes. Four sets of exchange time were used to optimize the sequence. And high-resolution T2W images of whole brain were also acquired.
Data analysis: Motion correction and realignment were performed using SPMMouse based on SPM8 (http://www.fil.ion.ucl.ac.uk/spm/software/spm8/) for MATLAB 2015b (MathWorks, Natick, USA). CBF and ΔM images were processed using custom routines written in MATLAB. A two-step method was used to register the template to the perfusion images. First, rigid-body co-registration between mouse template and anatomical scan was performed. Then, the same step was performed between T2W images and ASL images, and the transform information was applied to the template. With the labels of the template, 22 brain regions were selected and the CBF values within these brain regions were calculated.
Results
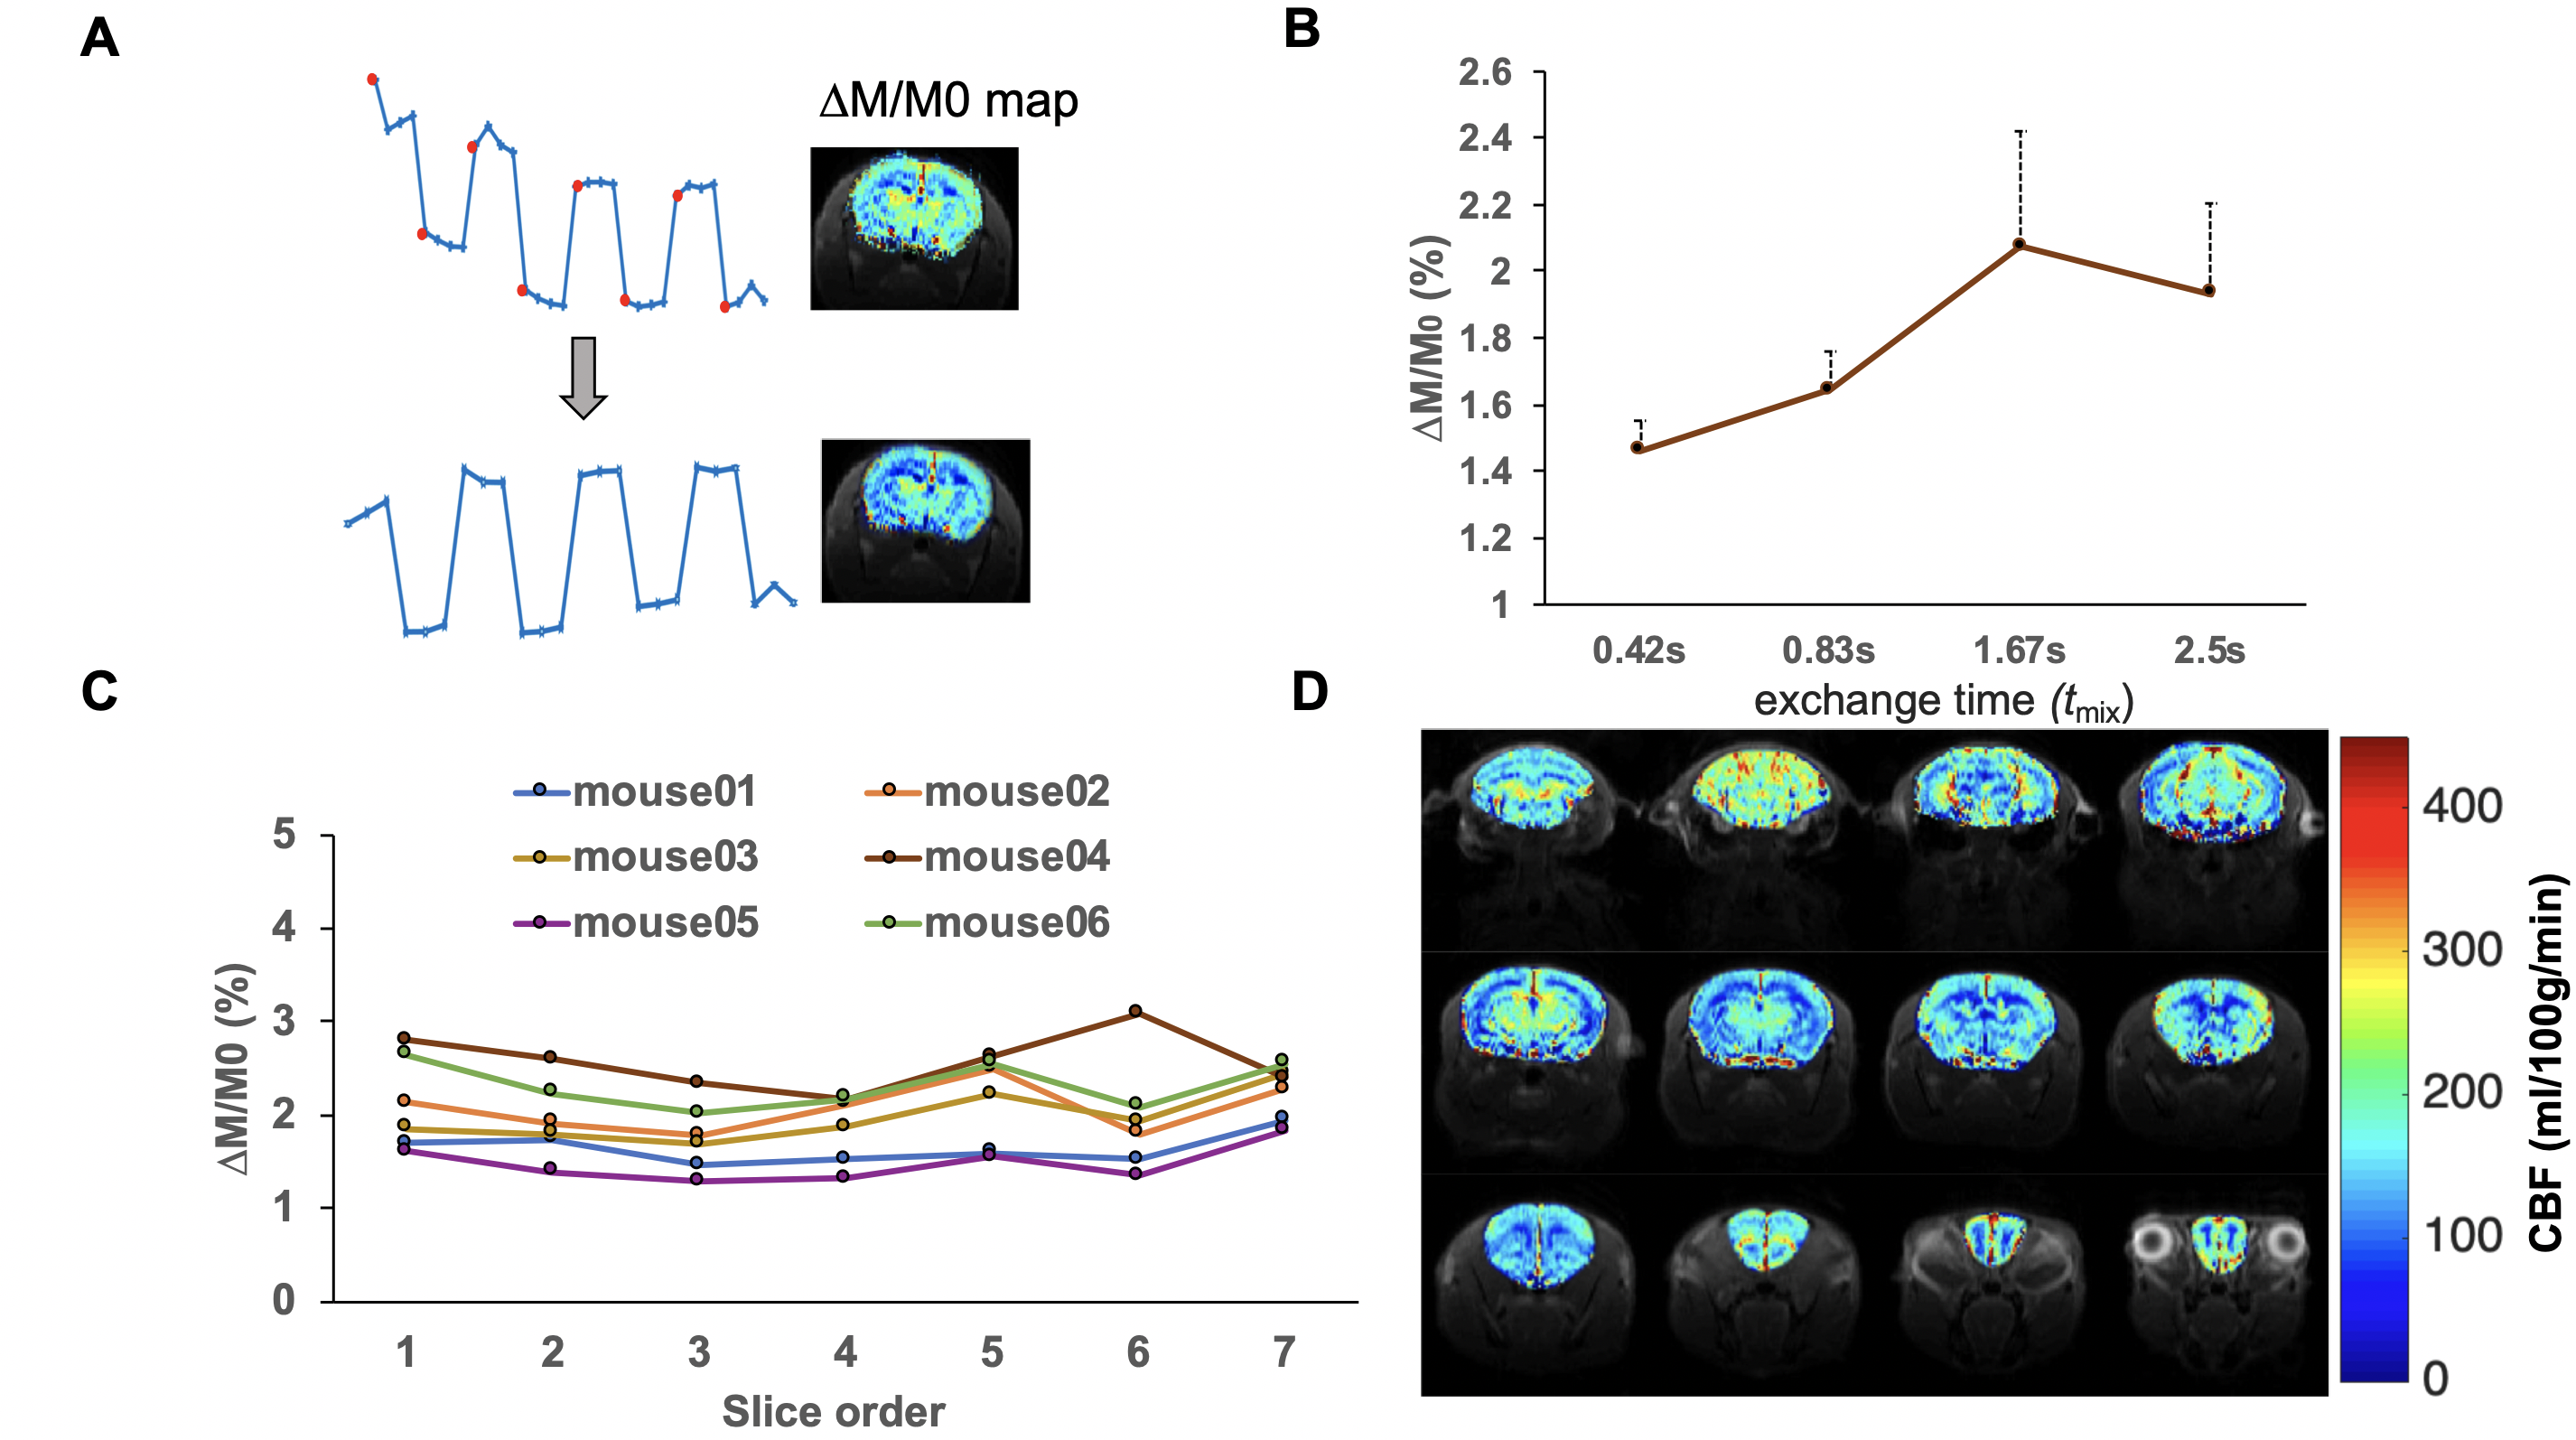
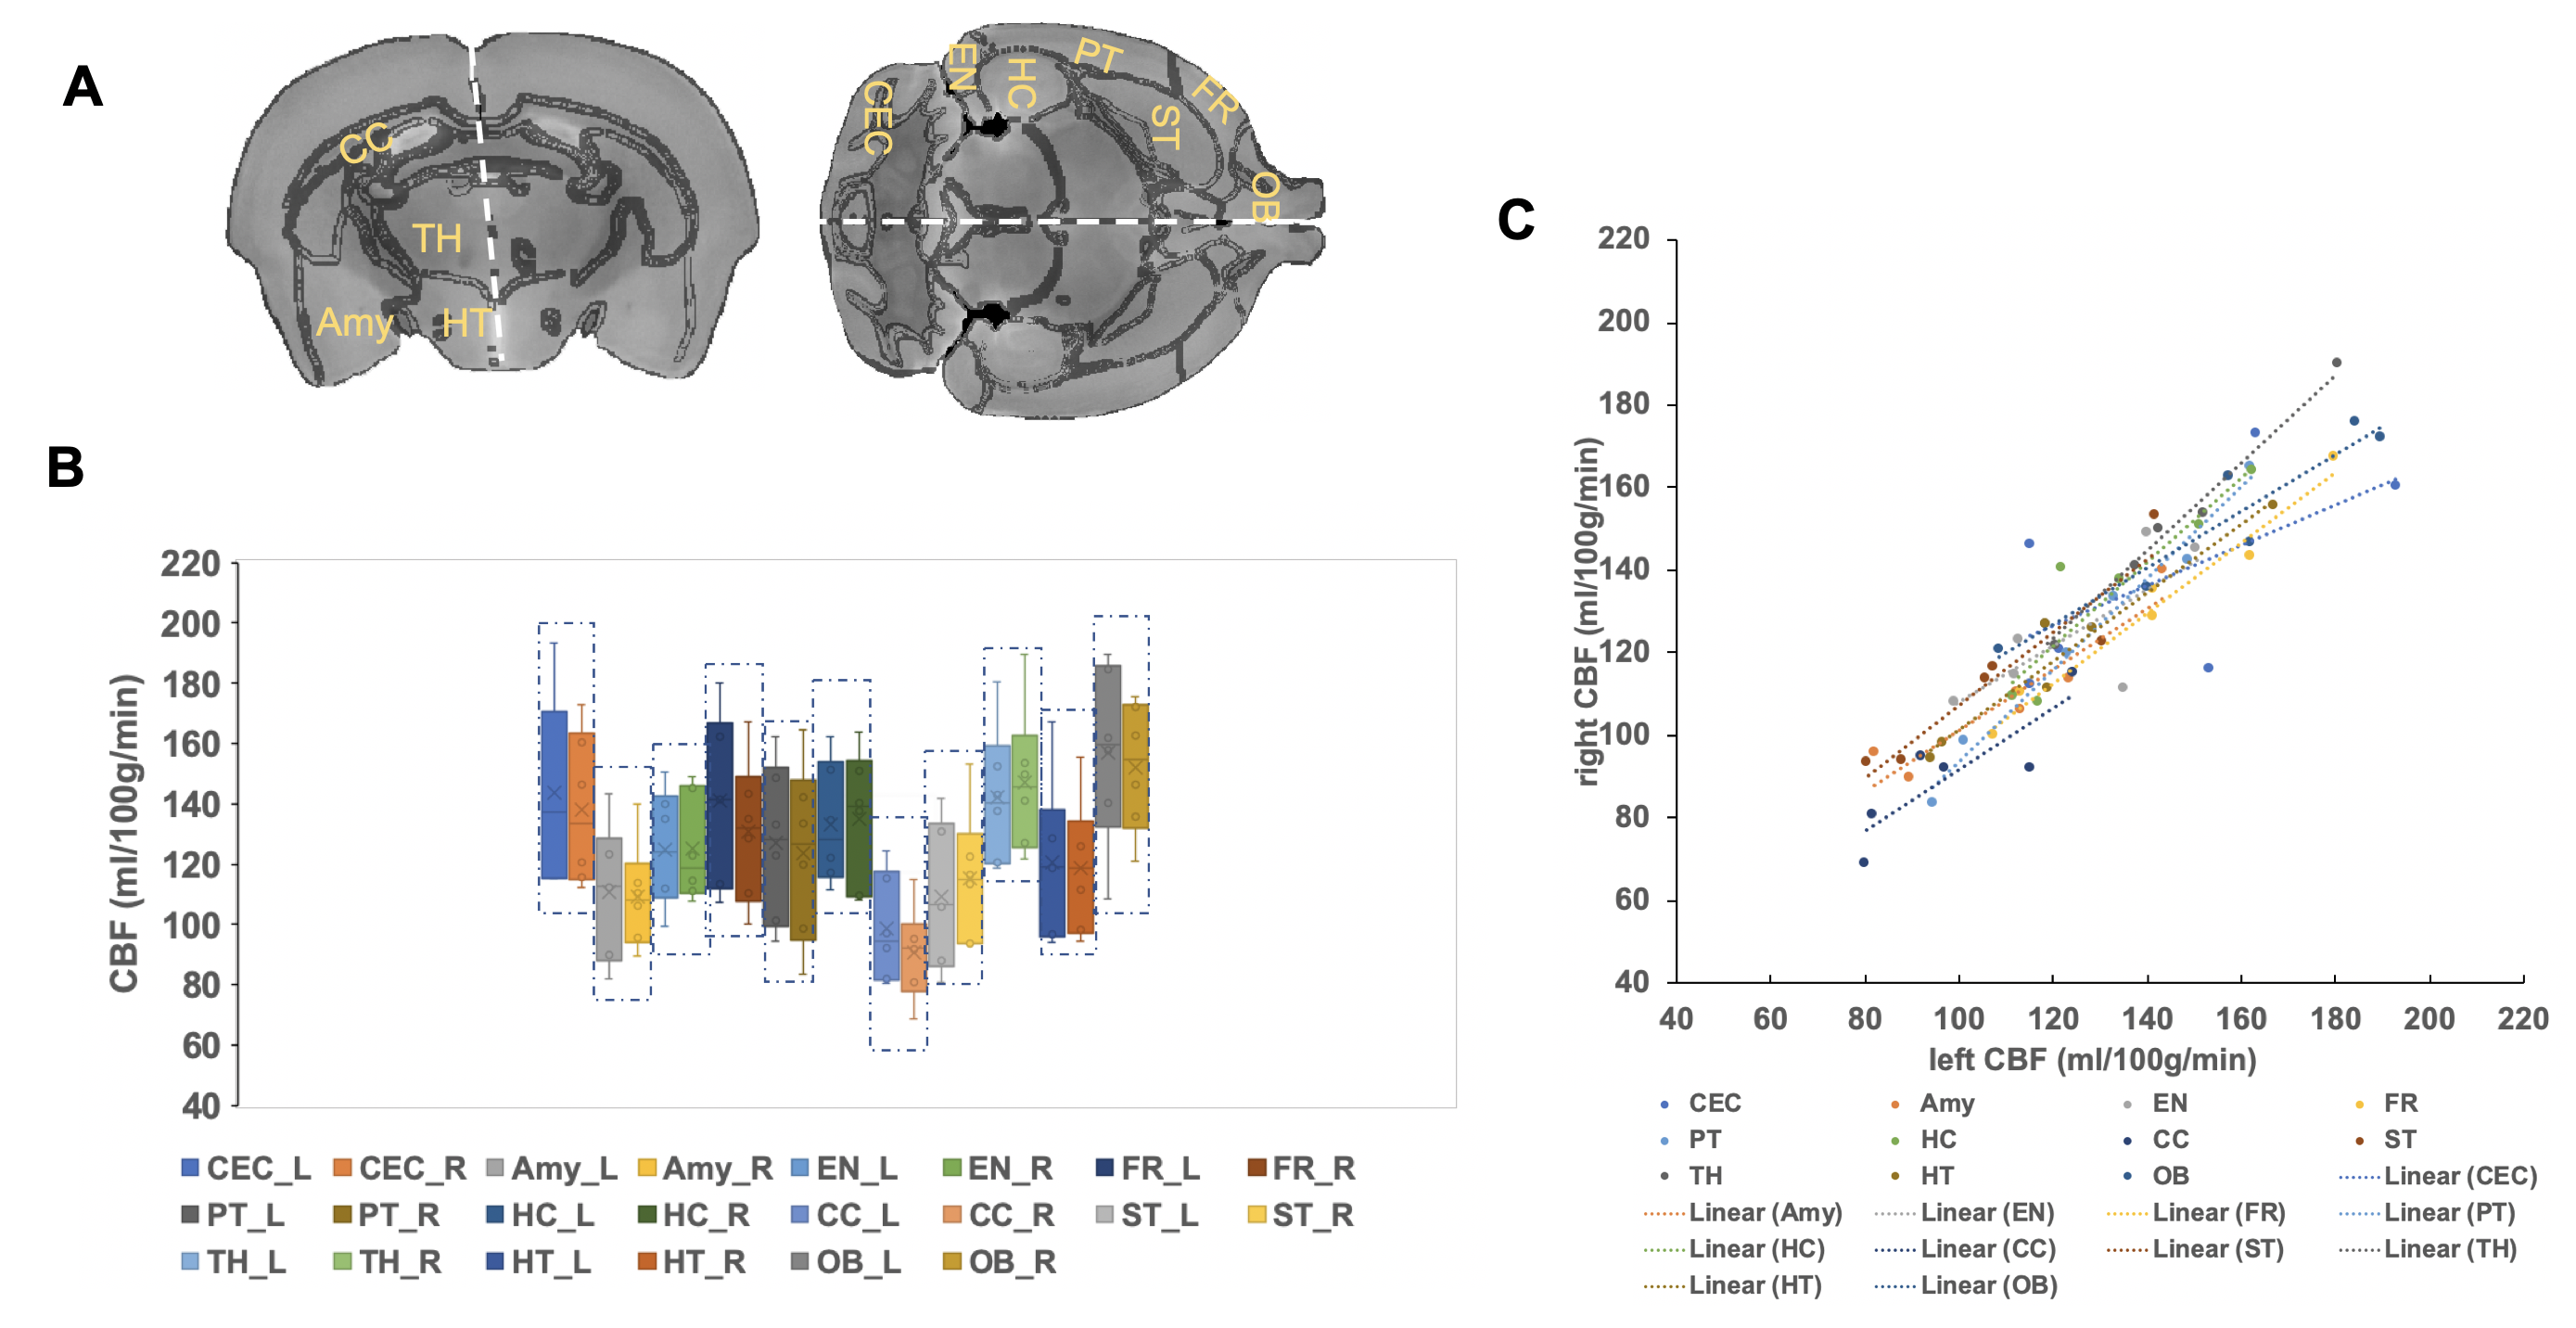
As shown in Fig. 2A, the first point of each labeling or control image is inaccurate owing toviolation of the steady state. In order to minimize the steady-state error, the first points were discarded. The slow B0-based drift in the time series data (Fig. 2A) can be corrected by applying a high-pass frequency filter to improve the perfusion contrast. tmix was optimized to 1.67 s to reach the maximum perfusion signal (Fig. 2B). Fig. 2C shows no significant perfusion variations in cortex between different slices. Fig. 2D shows a representative CBF map with whole brain coverage. After optimization, each CBF image was registered to the MRI anatomical brain atlas (Fig. 3A) through a rigid‐body landmark‐matching algorithm. Mean CBF was computed in the 22 largest anatomical regions of the brain as shown in Fig 3B: the cerebellum (CEC) and olfactory bulb (OB) show the highest CBF value, however the corpus collosum (CC) shows the lowest CBF value. Fig. 3C illustrates no significant CBF difference between right and left hemispheres in 22 brain regions. As shown in Fig. 4A, hyperintensity in T2W images and clear CBF reduction in perfusion images are observed to show ischemia regions, respectively. The ischemia region observed in CBF map is significantly larger than observed lesion in T2W images (Fig. 4B).Discussion
dSPIL has several unique advantages for performing multi-slice perfusion imaging in addition to the typical advantages of PASL methods: (i) dSPIL is robust with respect to experimental errors: the steady state perfusion signal simplifies the quantification of CBF, and makes it less prone to potential confounds affecting other PASL methods such as finite bolus duration and label transition bands; (ii) dSPIL achieves high acquisition efficiency by removing the pre-scan delays to achieve a 100% labeling duty cycle; (iii) dSPIL perfusion images do not require correction for each slice’s post-label acquisition delay.Conclusion
We developed a novel steady state perfusion method to measure CBF for whole brain coverage with high resolution in mice.Acknowledgements
This work was supported by grants from the National Natural Science Foundation of China (81873893), the key project of Shanghai Science & Technology (16JC1420402), and Shanghai Municipal Science and Technology Major Project (2018SHZDZX01) and ZJlab.References
1. Feinberg DA, Beckett A, Chen L. Arterial spin labeling with simultaneous multi-slice echo planar imaging. Magn Reson Med. 2013;70(6):1500-1506. doi:10.1002/mrm.249942.
2. Kim T, Shin W, Zhao T, Beall EB, Lowe MJ, Bae KT. Whole brain perfusion measurements using arterial spin labeling with multiband acquisition. Magn Reson Med. 2013;70(6):1653-1661 doi:10.1002/mrm.248803.
3. Buchanan C, Cox E, Francis S. Evaluation of 2D Imaging Schemes for Pulsed Arterial Spin Labeling of the Human Kidney Cortex. Diagnostics. 2018;8(3):43. doi:10.3390/diagnostics80300434.
4. Xu J, Qin Q, Wu D, et al. Steady pulsed imaging and labeling scheme for noninvasive perfusion imaging. Magn Reson Med. 2016;75(1):238-248. doi:10.1002/mrm.256415.
5. Tanabe JL, Yongbi M, Branch C, Hrabe J, Johnson G, Helpern JA. MR perfusion imaging in human brain using the UNFAIR technique. J Magn Reson Imaging. 1999;9(6):761-767.
Figures