3275
Improved inflow saturation markedly reduces inflow artifacts in background-suppressed 3D arterial spin labeling1Radiology, Perelman School of Medicine, University of Pennsylvania, Philadelphia, PA, United States, 2Chinese Academy of Medical Sciences, Peking Union Medical College, PUMCH, Beijing, China, 3Icahn School of Medicine at Mount Sinai, New York, NY, United States, 4Neurology, Perelman School of Medicine, University of Pennsylvania, Philadelphia, PA, United States
Synopsis
Inflow blood during the post labeling delay is a significant source of physiological noise in arterial spin labeling. This study utilized a novel inflow saturation method to address this issue. Compared to traditional inflow saturation approach where a 90o thick saturation slab is used to null blood within the interval of background suppression inversion pulses, the proposed method employs serial of thin slab sub-bolus saturations, with the saturation strength planned adaptively to return the blood to nulling point at the excitation point. The proposed method reduces the inflow artifacts markedly and mitigates global signal fluctuations.
Introduction
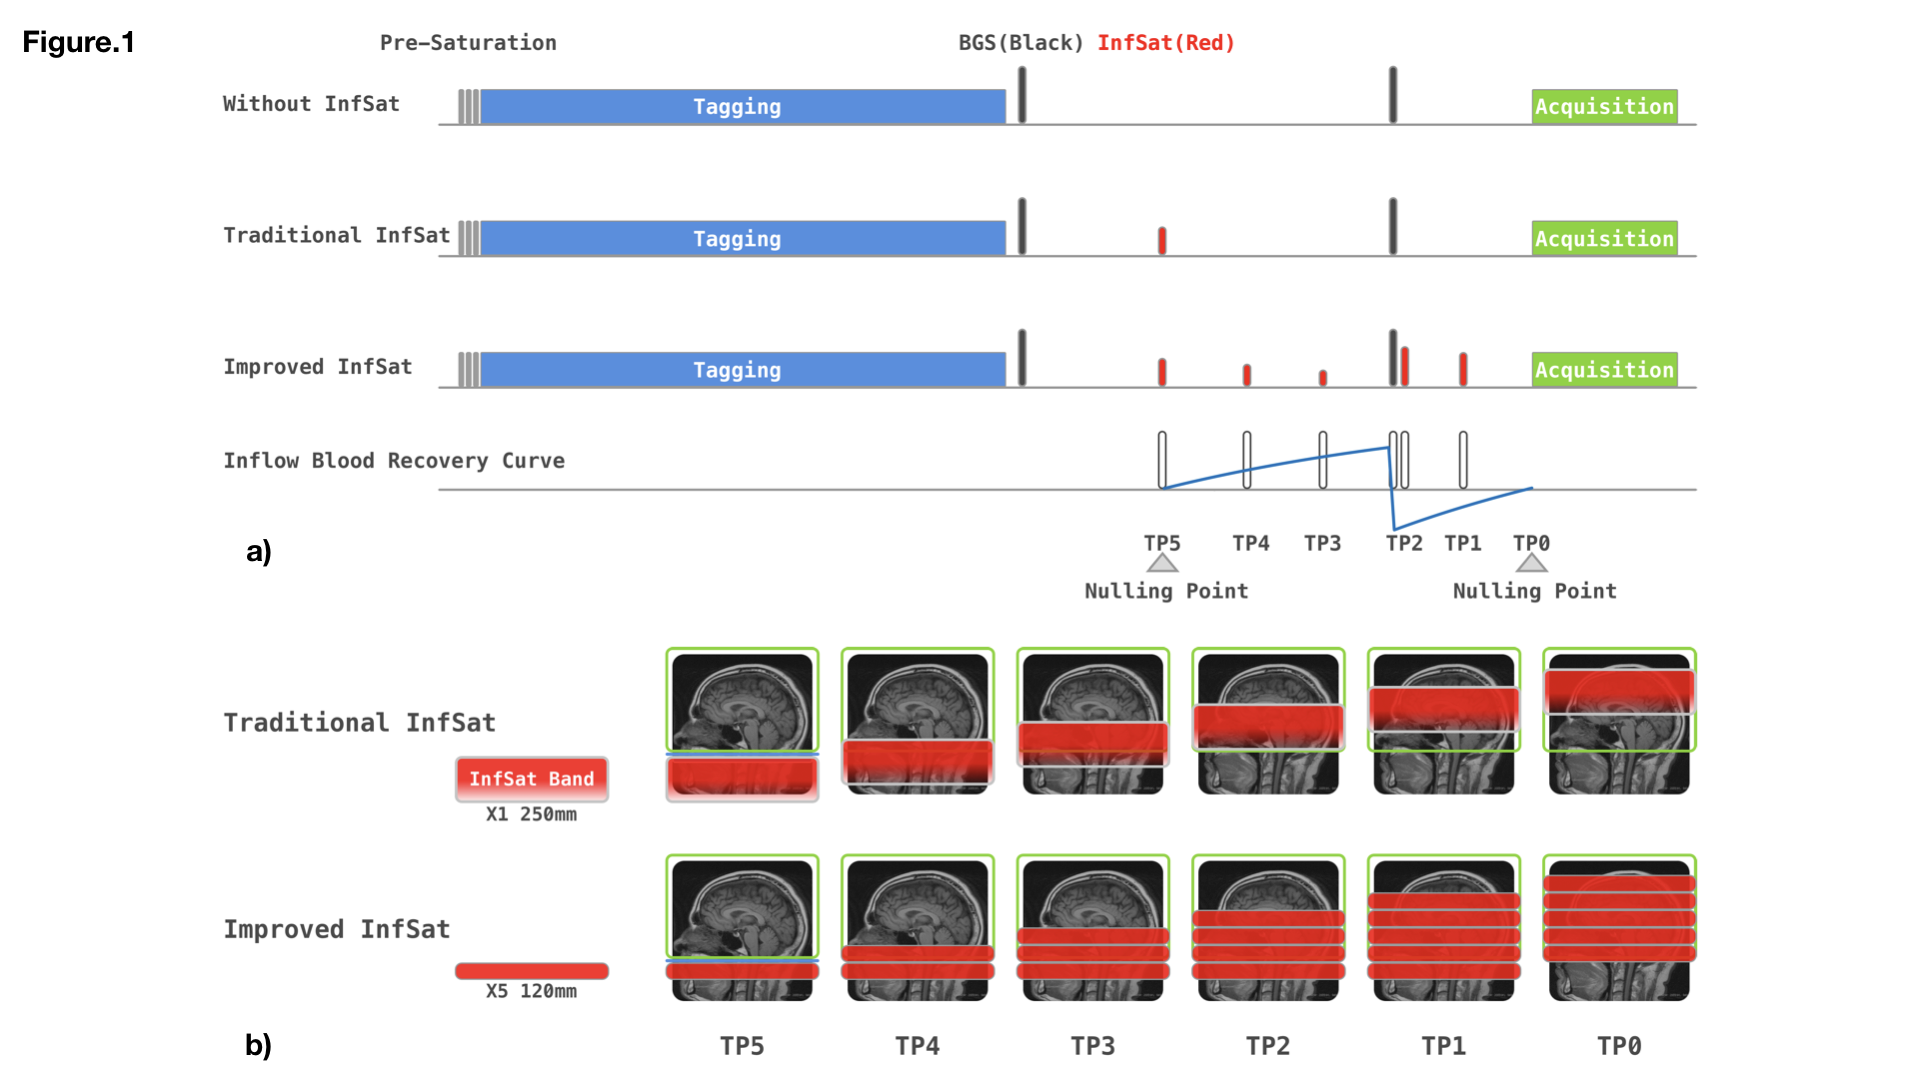
Inflow of unlabeled blood during post labeling delay (PLD) is a significant source of physiological noise in continuous arterial spin labeled (ASL) perfusion MRI. Although cardiac gating can reduce inflow fluctuations1, it requires extra preparations and lengthens acquisition time. Vessel suppression is an alternative strategy, but it introduces T2 weighting and reduces SNR2. Inferior saturation bands are typically used to suppress inflowing blood. In background suppressed (BS) 3D ASL, an inflow saturation band is typically inserted between BS inversion pulses to suppress inflowing blood after the labeled bolus. With the help of inversion pulses, longitudinal relaxation then returns saturated blood to the nulling point at the initial excitation pulse of the image acquisition (Fig.1a). In ideal circumstances, a single thick inferior saturation band should suppress all signal from inflowing blood. However, due to RF field inhomogeneity, the optimal saturation region is often more limited, compromising the saturation module’s efficacy. In this work, we replace the thick saturation band with serial thinner saturation bands to achieve more robust inflow saturation. The saturation RF strength of sub-bolus saturation bands is adjusted independently to match the recovery curve of blood in an ideal situation.Method
Figure.1 illustrates sequences without saturation, with standard thick slab saturation, and with the improved serial saturation for comparison. The labeling duration and PLD were 1.8s, following the consensus paper2. Two slice selective inversion pulses, placed at 493ms, and 1771ms before the acquisition, are used for background suppression, achieving a moderate suppression efficiency of 90%. In the standard approach, the inferior saturation band was placed at 700 ms before the last inversion pulse. For the serial saturation approach, two and three saturation modules are evenly placed within the interval of saturation to inversion and inversion to acquisition. The saturation slab thickness for the traditional approach was 250mm, while for the serial saturation approach, the saturation thickness was 120mm, chosen to optimally saturate blood with a mean velocity of 50 cm/s. Parameter details for inflow saturation are shown in Fig.1a. The acquisition utilized a single-shot accelerated 3D stack-of-spirals fast spin echo (SoS-FSE) readout with the following parameters: FOV 240mm, 40 slices, isotropic resolution 3.75 mm, and rate-2 GRAPPA acceleration in the Kz direction3. ASL measurements were performed on two healthy volunteers with: 1) no inflow saturation; 2) traditional saturation; and 3) proposed serial saturation on a 3T whole-body system (MAGNETOM Prisma, Siemens Healthcare, Erlangen, Germany). In total, thirty interleaved phases of labeling and control were acquired for each inflow saturation approach. The M0 normalized standard deviation (SD) of perfusion-weighted (PW) images were calculated for comparison.Results
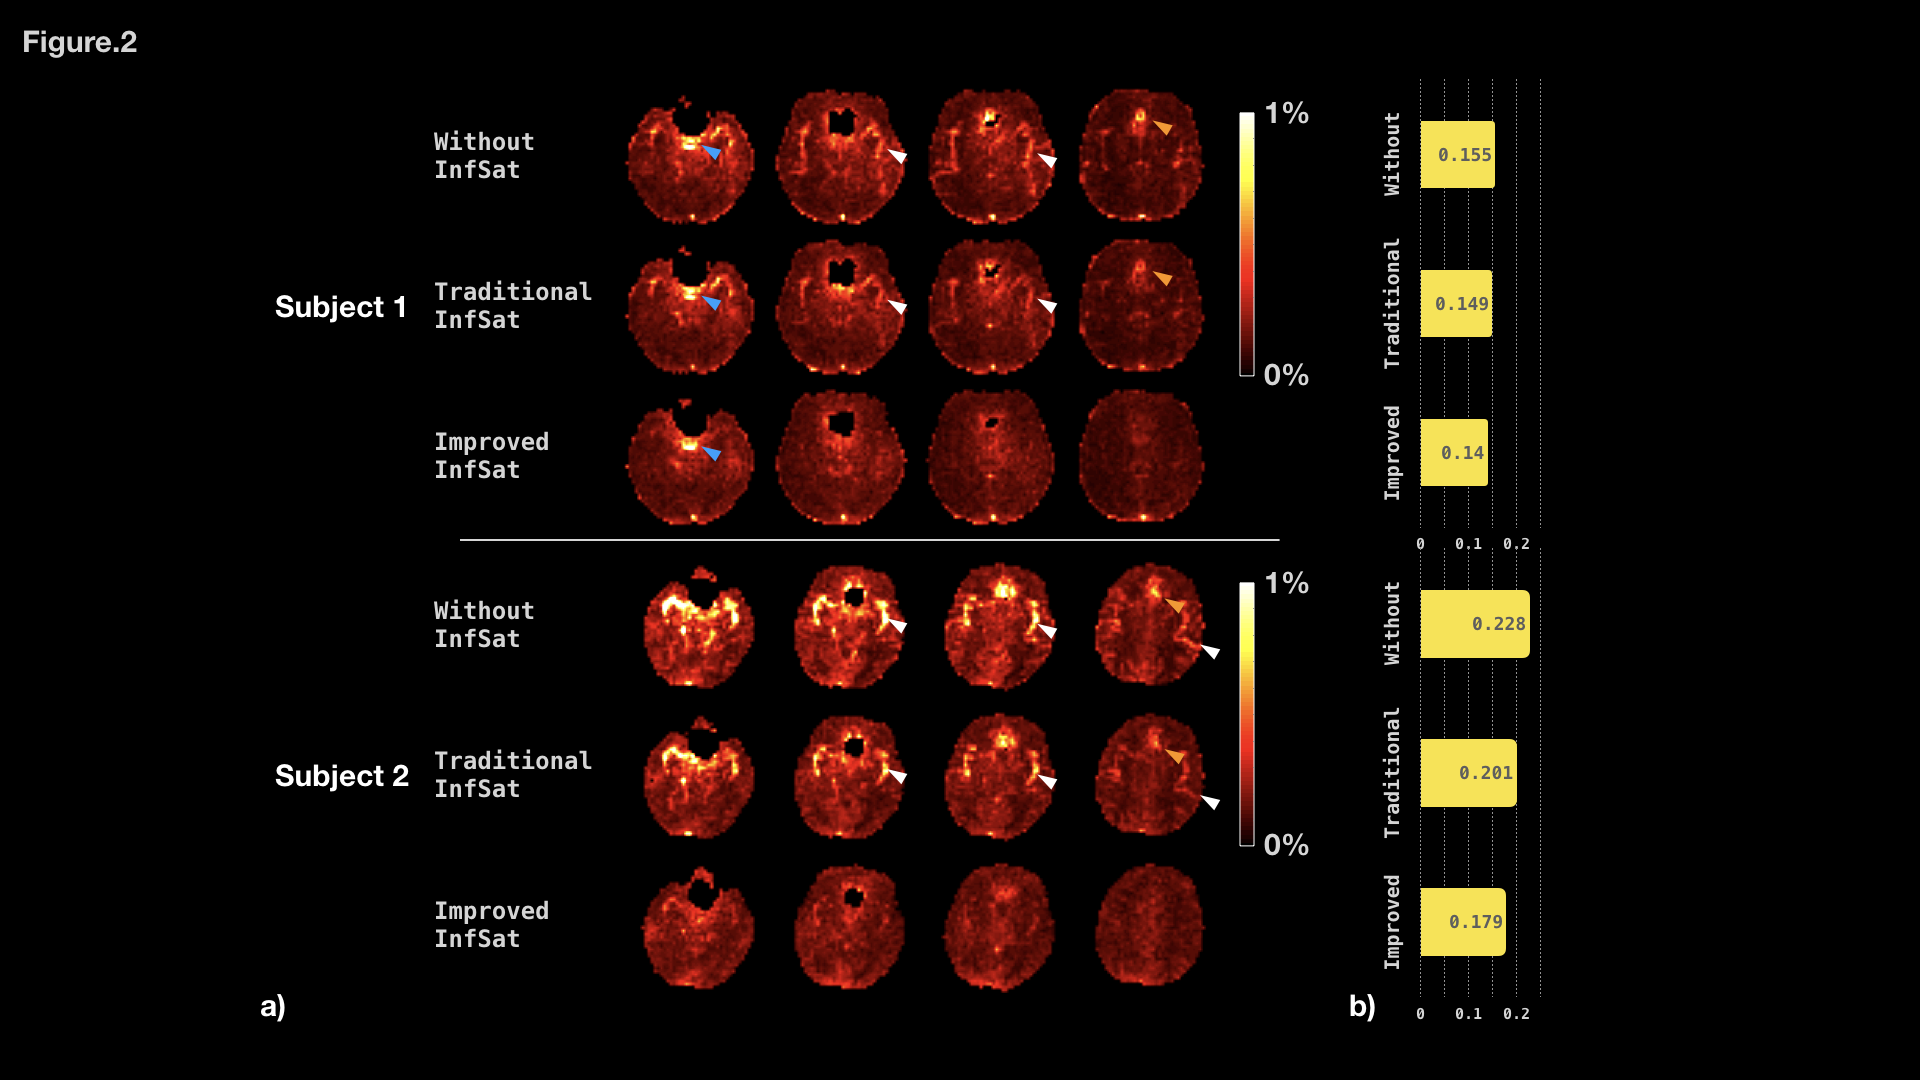
Figure 2a illustrates the normalized standard deviation map for each subject. Fig2b plots the average value of the SD within the brain parenchyma. For both subjects, the SD is high for measurements without inflow saturation, which is most prominent in regions around the middle cerebral arteries (MCA, white arrows) and anterior cerebral arteries (ACA, orange arrows). The standard saturation approach reduced these artifacts, but with the serial saturation approach, signal fluctuation around MCA and ACA were further suppressed. Neither approach effectively attenuated signal fluctuations in CSF (blue arrows). Global signal fluctuations were also reduced (Fig 2b). For the first subject, the average SD dropped from 0.155 to 0.149 (4.1%) and 0.140 (9.5%) for standard and serial approaches, respectively. For subject two, the average SD dropped from 0.228 to 0.201 (11.8%) and 0.179(21.5%) for standard and serial approaches, respectively.Conclusions
Inflow artifacts in BS 3D ASL artifacts are incompletely attenuated by single slab inflow saturation, while the serial saturation approach completely eliminated conspicuous inflow artifacts in the MCA and ACA regions. This approach is more straightforward and more time-efficient compared to the cardiac-gated method. In designing the sub-bolus saturation band thickness, the sequence assumed a mean blood velocity of 50 cm/s, whereas in instances where proximal flow velocity deviates from this value, there remains a chance of compromised saturation or potentially double saturation. The tolerance to both fast and slow flow is not addressed in the current study and waits to be explored later. There exists a difference in the fluctuation reduction rate for the two subjects, which might be a result of varying hemodynamics, such as arterial transit time. The proposed method could also be extended to BS planning involving more than two inversion pulses. Additional evaluation of saturation efficiency tolerance to serial slab saturation number and thickness across the inflow velocity values will be explored in future work.Acknowledgements
This work was supported by NIH grant P41 EB015893References
[1]Yang Li, Dend Mao, etc. Cardiac-Triggered Pseudo-Continuous Arterial-Spin-Labeling: A Cost-Effective Scheme to Further Enhance the Reliability of Arterial-Spin-Labeling MRI, MRM, 2018
[2]David C. Alsop, John A. Detre, etc. Recommended Implementation of Arterial Spin-Labeled Perfusion MRI for Clinical Applications: A Consensus of the ISMRM Perfusion Study Group and the European Consortium for ASL in Dementia, MRM, 2014
[3] Marta Vidorreta, Ze Wang, etc. Whole-brain background-suppressed pCASL MRI with 1D-accelerated 3D RARE Stack-Of-Spirals readout, PlosOne, 2017
Figures