3274
Reducing the effect of cerebrospinal fluid pulsation on arterial spin labeled perfusion MRI acquired with fast spin echo readouts1Radiology, Perelman School of Medicine, University of Pennsylvania, Philadelphia, PA, United States, 2Chinese Academy of Medical Sciences, Peking Union Medical College, PUMCH, Beijing, China, 3Neurology, Perelman School of Medicine, University of Pennsylvania, Philadelphia, PA, United States
Synopsis
Fast spin echo is widely used for ASL acquisition. However, if the flip angle reduced to minimize SAR and/or stabilize signal evolution over the echo train, the fluctuation of CSF increases markedly. This work explored the influence of minimum flip angle, and crusher strength in ASL acquisition. A CSF-prioritized background suppression (BS) planning was also performed. We found that increasing minimum flip angle together with reducing crusher in superior-inferior direction benefits the stability of ASL acquisitions. Prioritizing CSF suppression in BS was also helpful.
Introduction
Fast spin echo (FSE) is a recommended acquisition approach for whole brain volume perfusion mapping in arterial spin labeling (ASL)1. While FSE facilitates the optimization of background suppression and provides high SNR, it also has limitations, including a relatively high specific absorption rate (SAR) and T2-blurring along the partition-encoding direction. Reduced refocusing flip angle provides a remedy for these problems2, but at the cost of increased sensitivity to motion between the inversion pulses. The stability of repeated ASL measurement also becomes more vulnerable to the pulsatile cerebrospinal fluid (CSF) flow3, producing an undesirable temporal fluctuation in ASL images. This work aims to study the effect of CSF pulsation in ASL with a reduced flip angle and presents methods to reduce it.Methods
We used background suppressed (BS) ASL with a stack-of-spirals (SoS) FSE acquisition. Labeling duration and post labeling delay were 1.8s1. A background suppression module consisting of two inversion pulses was employed. To avoid additional artifacts due to motion across segmented acquisitions, a single-shot acquisition setting was used with the parameters listed below, FOV 240mm * 240mm, slice number 40, isotropic resolution 3.75mm, two in-plane spiral interleaves, and 2x GRAPPA in the slice direction4. The echo spacing was 15.12ms, and the echo train length was 32. In total, thirty interleaved phases of labeling and control were acquired for each ASL serial. Two subjects were scanned, having given informed consent, on a 3.0 T whole-body scanner (MAGNETOM Prisma, Siemens Healthcare, Erlangen, Germany).Three experiments were conducted: the first one compared the influence of the minimum flip angle; the second explored the impact of crusher strength along the superior-inferior (S-I) direction; and the third modulated the suppression efficiency for CSF via changing the timing of inversion pulses.
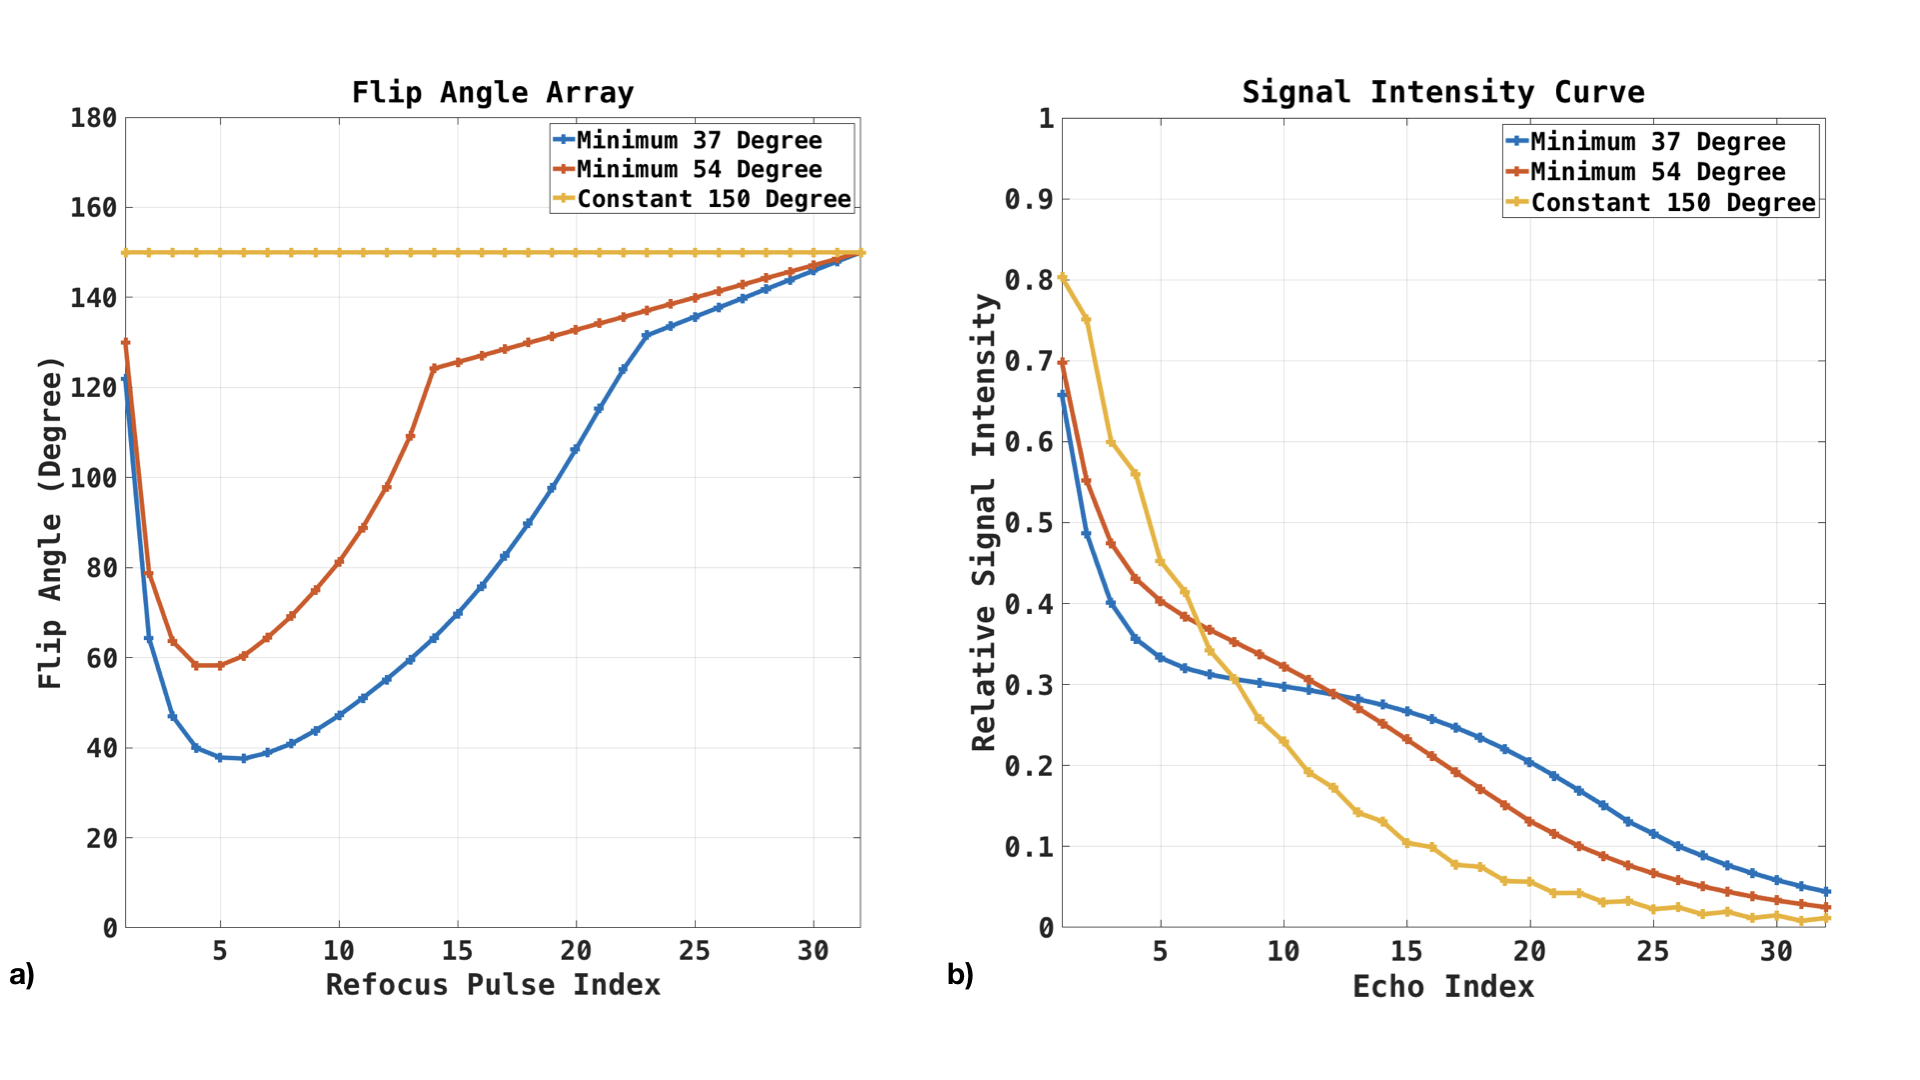
First Experiment. The flip angle arrays for the first experiment are shown in Figure 1.a. The constant flip angle of 150-degree, variable flip angle with a minimum flip angle of 37-degree, and 54-degree were performed. Figure 1b illustrates the signal intensity along the echo train, assuming a relaxation rate of T1 1600ms and T2 100ms.
Second Experiment. In the second experiment, the crusher moment along S-I direction was reduced from 9000 mT/m*us (0.766 PI/mm) to 4800, 2400, and 0. Meanwhile, the crusher moment in perpendicular directions was increased to keep the duration fixed and combined slew rate at a constant value. As the CSF flow direction mainly lies along the S-I direction around the spinal cord and brain-stem, where the fluctuation increased markedly in the first experiment, a reduced crusher along the same direction is expected to reduce the sensitivity to CSF3.
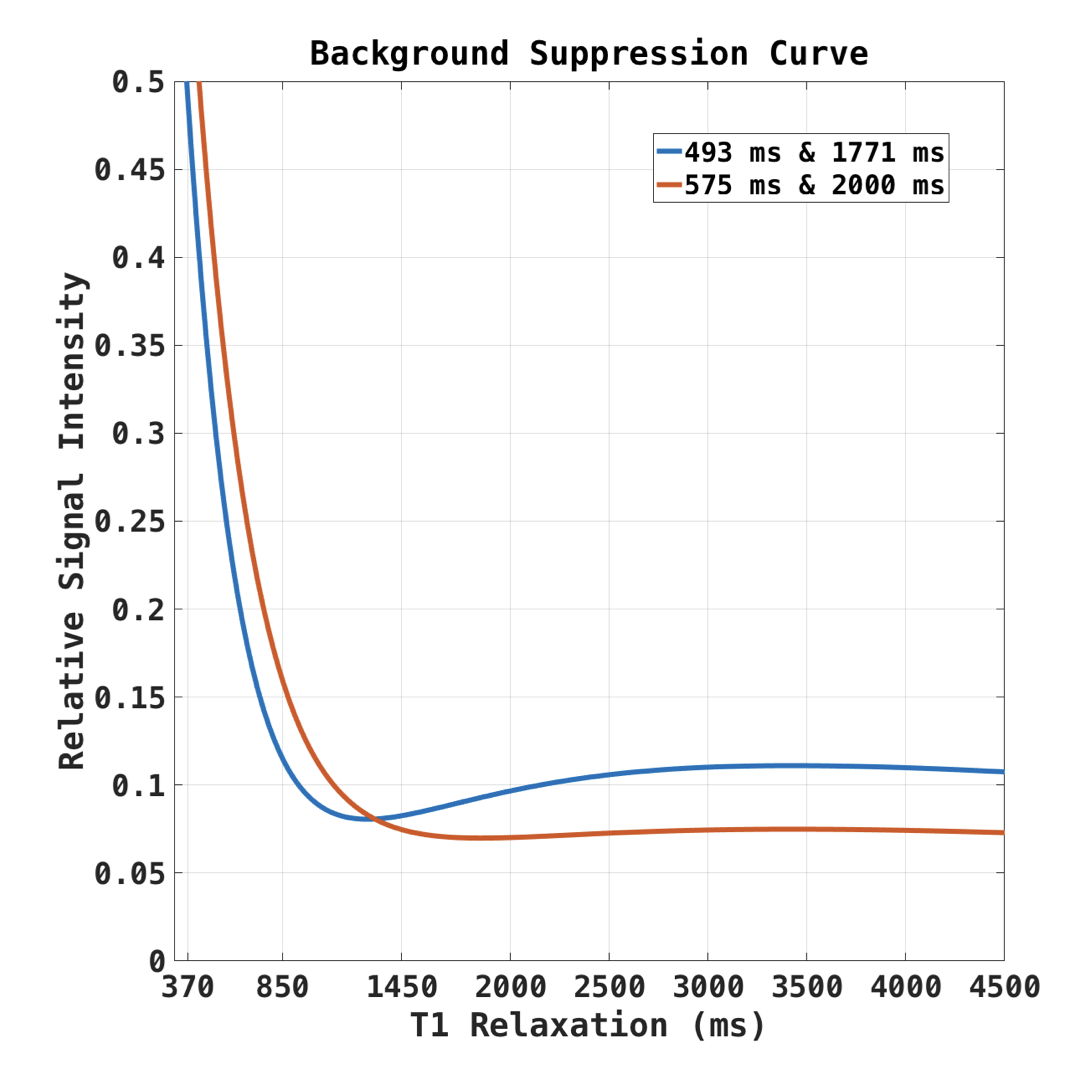
Third Experiment. The residual signal intensity curves for different BS timing are plotted in Figure 2. Using standard settings, the suppression was optimized, targeting a suppression efficiency of 90% for white matter (WM), gray matter (GM), and CSF. We also acquired data with a novel timing of the BS inversion pulses, designed to prioritize CSF suppression, resulting in residual intensities for WM, GM, and CSF of 16%, 7%, and 7%, respectively.
For all experiments, the M0-normalized standard deviation (SD) of perfusion-weighted (PW) images were calculated, and histograms of voxel-wise SD distributions were plotted for comparison across acquisition parameters.
Result
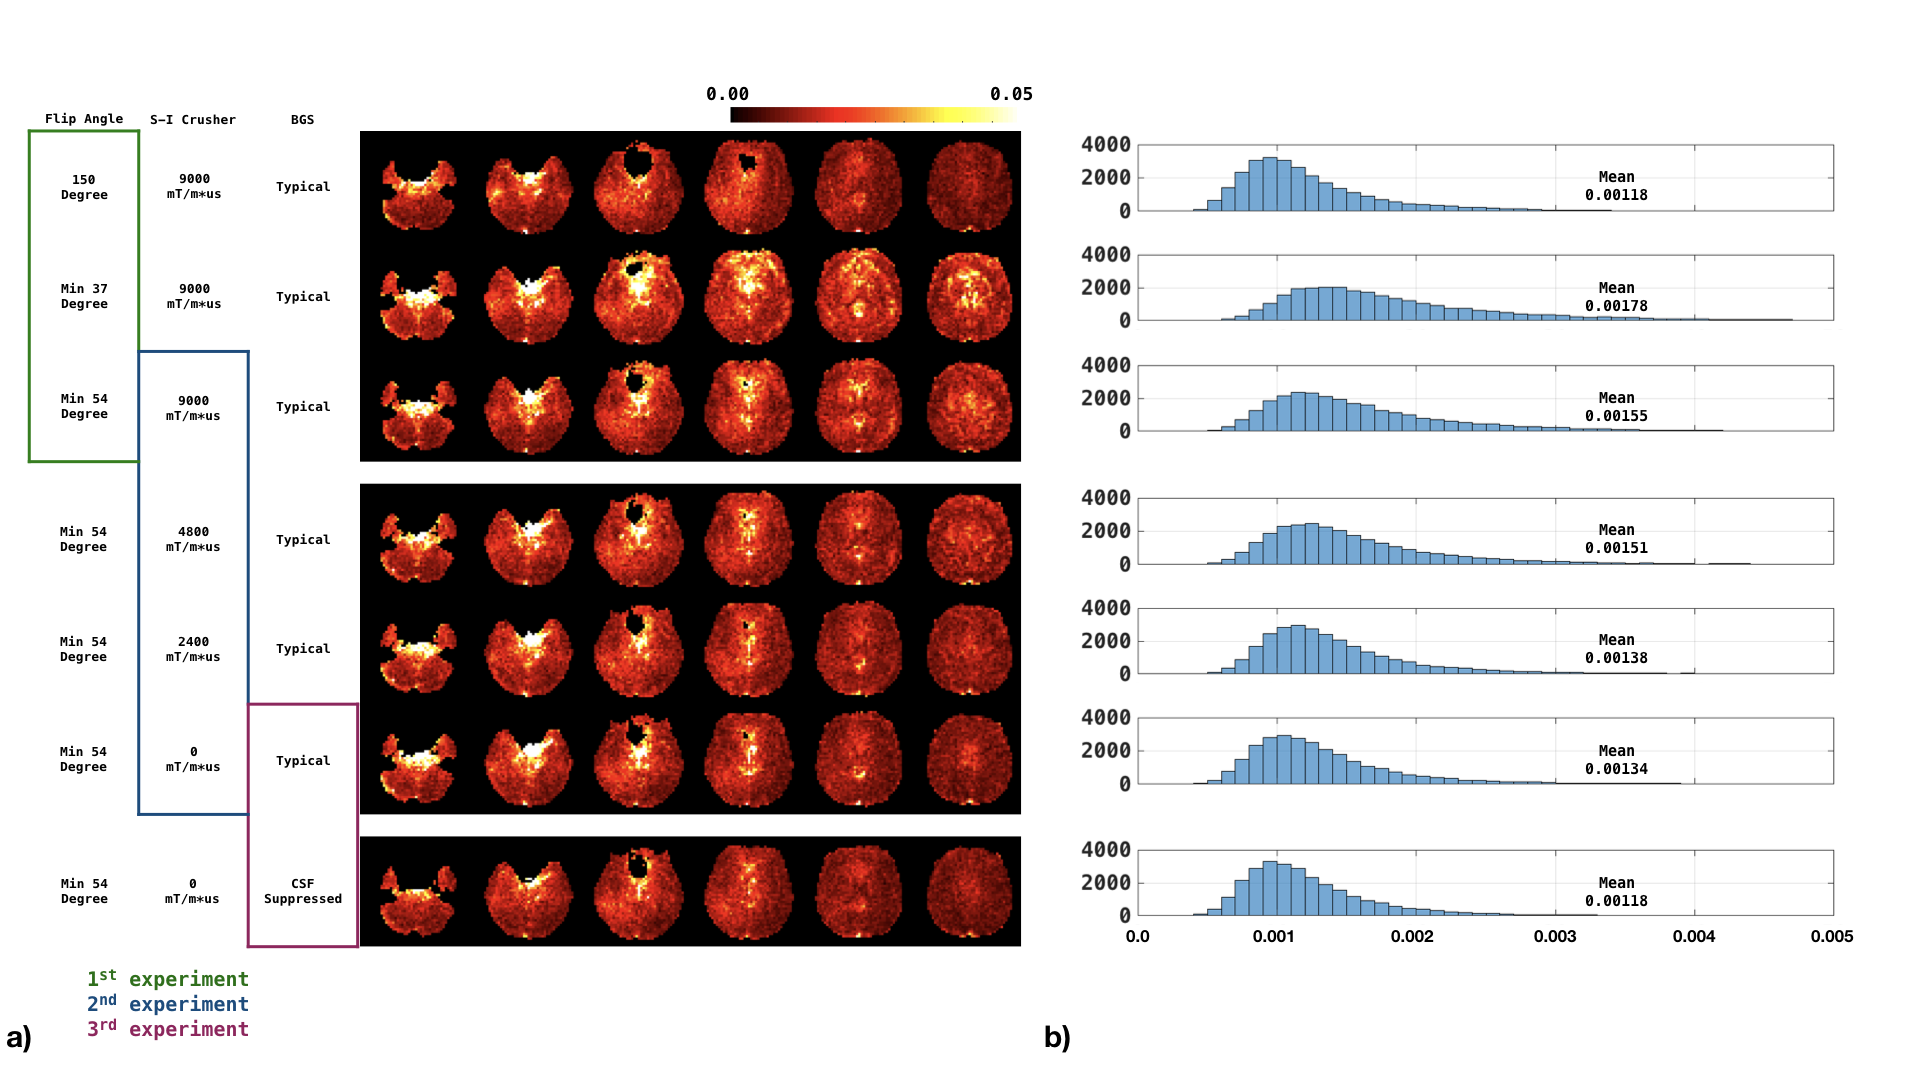
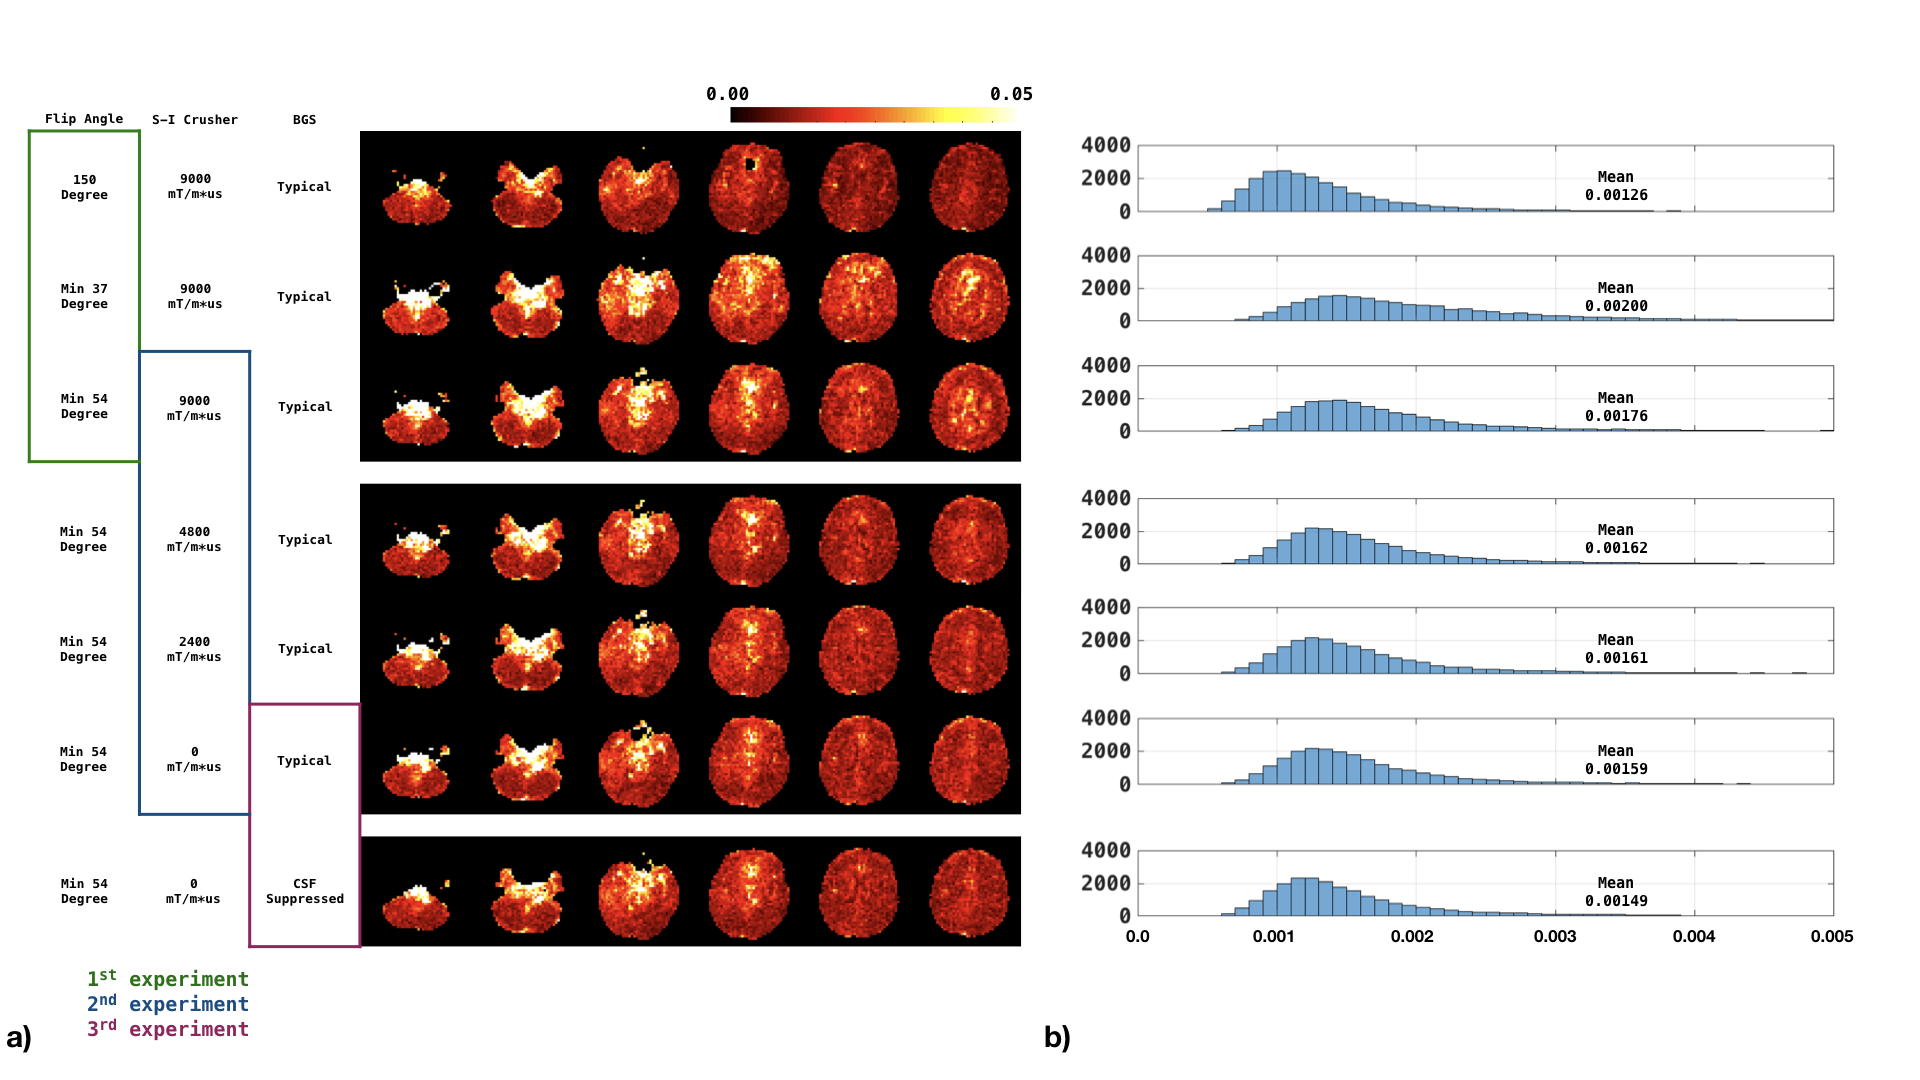
Figures 3-4 show the normalized SD maps (Figs 3a/4a) and the histograms of the SD map (Figs 3b/4b) across acquisition parameters for the two study subjects. With the minimum flip angle set to 37-degree, fluctuations increased markedly. Increasing the minimum flip angle from 37o to 54o reduced fluctuations from 0.178E-2 to 0.155E-2 for the first subject, and from 0.200E-2 to 0.176E-2 for the second subject. Reducing the S-I direction crusher also reduced the fluctuation: compared to crusher moment of 9000 mT/m*us, the average SD of zero crusher moment dropped from 0.155E-2 to 0.134E-2, and from 0.176E-2 to 0.159E-2 for the first and second subject, respectively. Tailoring the BS for more significant CSF suppression could also mitigate the fluctuation, as shown in Figures 3 and 4.Discussion and Conclusions
This study demonstrates that reducing the flip angle for FSE refocusing pulses increases undesired fluctuations in the ASL time series. These fluctuations could be reduced by increasing the minimum refocus flip angle, although this also limits the usable echo train length and thus effectively limits volume coverage. Reducing the crusher gradient amplitude in the S-I direction also reduced CSF fluctuations. Reducing the crusher moment may reduce the accumulated phase shift due to the pulsations of CSF flow in regions around the brain stem. Not surprisingly, suppressing CSF also mitigates the observed signal fluctuations. We note, however, that while we have demonstrated that CSF pulsatility is the likely cause of these fluctuations, they are not localized exclusively to regions of CSF, as shown from the histogram shift between different flip angle settings (Figs 3b/4b, first experiment). Instead, the fluctuation is spread out into the whole acquisition volume because that CSF is not completely refocused during the echo train. Due to the limited subject number, the optimal combination of flip angle, crusher strength, and BS timing time still wait to be explored in future studies.Acknowledgements
This work was supported by NIH grant P41 EB015893.References
[1] David C. Alsop, John A. Detre, etc. Recommended Implementation of Arterial Spin-Labeled Perfusion MRI for Clinical Applications: A Consensus of the ISMRM Perfusion Study Group and the European Consortium for ASL in Dementia, MRM, 2014
[2] Li Zhao, Ching-Di Chang, and David C. Alsop. Controlling T 2 blurring in 3D RARE arterial spin labeling acquisition through optimal combination of variable flip angles and k-space filtering, MRM, 2018
[3] R.F. Busse, Flow Sensitivity of CPMG Sequences with Variable Flip Refocusing and Implications for CSF Signal Uniformity in 3D-FSE Imaging, ISMRM, 2006
[4] Marta Vidorreta, Ze Wang, etc. Whole-brain background-suppressed pCASL MRI with 1D-accelerated 3D RARE Stack-OfSpirals readout, PlosOne, 2017
Figures