3271
Arterial spin labeling signal in the Sagittal Sinus as hemodynamic proxy parameter in patients with sickle cell disease.1Radiology and Nuclear Medicine, Amsterdam University Medical Center, location AMC, Amsterdam, Netherlands, 2Radiology, Leiden University Medical Center, Leiden, Netherlands, 3Helmholtz-Zentrum Dresden-Rossendorf, Institute of Radiopharmaceutical Cancer Research, Dresden, Germany, 4Department of Cardiology and Radiology, Children’s Hospital of Los Angeles, Los Angeles, CA, United States, 5Department of Hematology, Amsterdam UMC, location AMC, Amsterdam, Netherlands, 6Department of Radiology & Nuclear Medicine, Amsterdam UMC, location AMC, Amsterdam, Netherlands, 7Amsterdam UMC, Amsterdam, Netherlands
Synopsis
Higher sagittal sinus signal is present in the ASL images of patients with sickle cell disease (SCD). The purpose of this study was to assess if the signal in the sagittal sinus is correlated with clinical parameters and if this is affected by the vasoactive stimulus. The sagittal sinus signal was measured in patients with SCD and in healthy controls. Signal in sagittal sinus of the SCD patients were significantly correlated with clinical parameters including hemolysis markers. Our results show that sagittal sinus signal can be used as a hemodynamic proxy parameter in patients with SCD.
Introduction
Sickle cell disease (SCD) is characterized by chronic hemolytic anemia resulting in elevated cerebral blood flow (CBF)1. In the recent years, several studies have measured whole-brain CBF non-invasively using arterial spin labelling (ASL) to gain more insight into the cerebral pathophysiology of patients with SCD2–4. Visual assessment of the CBF images often shows brighter signal in the sagittal sinus (SaS) of SCD patients compared to the signal in brain tissue. The high signal in SaS indicates that labelled blood from the carotid arteries has already arrived to the venous side at the time of image acquisition, typically 1-2 seconds after labeling. Acknowledging this collection of venous label may not only help to improve the parenchymal CBF quantification, but may also provide a whole-brain indicator of arterio-venous label transit. The goal of this study is to explore whether the presence of label in the SaS is associated with clinical parameters, and how the SaS signal is affected by the vasodilatory stimulus acetazolamide (ACZ).Methods
Participants: In this study, 37 steady state SCD patients (mean age 32.4±11.0, n=24 (65%) male) and 10 healthy controls (mean age 36.4±15.1, n=6 (60%) male) were included. Prior to MRI, blood samples were drawn from an antecubital vein in all participants and analyzed using standard laboratory procedures.Imaging: Pseudo-continuous arterial spin labelling (pCASL) was performed in all subjects at 3T MRI (Philips Healthcare, Best, The Netherlands) using a 32 receive head-coil. A 2D gradient-echo single-shot EPI pCASL sequence was used to acquire perfusion-weighted images with the following settings: FOV 240 x 240 mm, voxel size 3 x 3 x 7 mm, 19 slices of 7 mm, TR/TE 4400/14 ms, with 2 background suppression pulses, post-labelling delay 1800-2558 ms, labelling duration 1800 ms, two sets of 35 control-label pairs with a total scan duration of 5 min each. After 5 the first set, 16 mg/kg (max 1400 mg) acetazolamide (Diamox®, Mercury Pharmaceuticals Ltd., London, UK) was injected intravenously and the second set of post-ACZ scans were performed 10 minutes after injection to allow maximum vasodilatory response to be achieved.
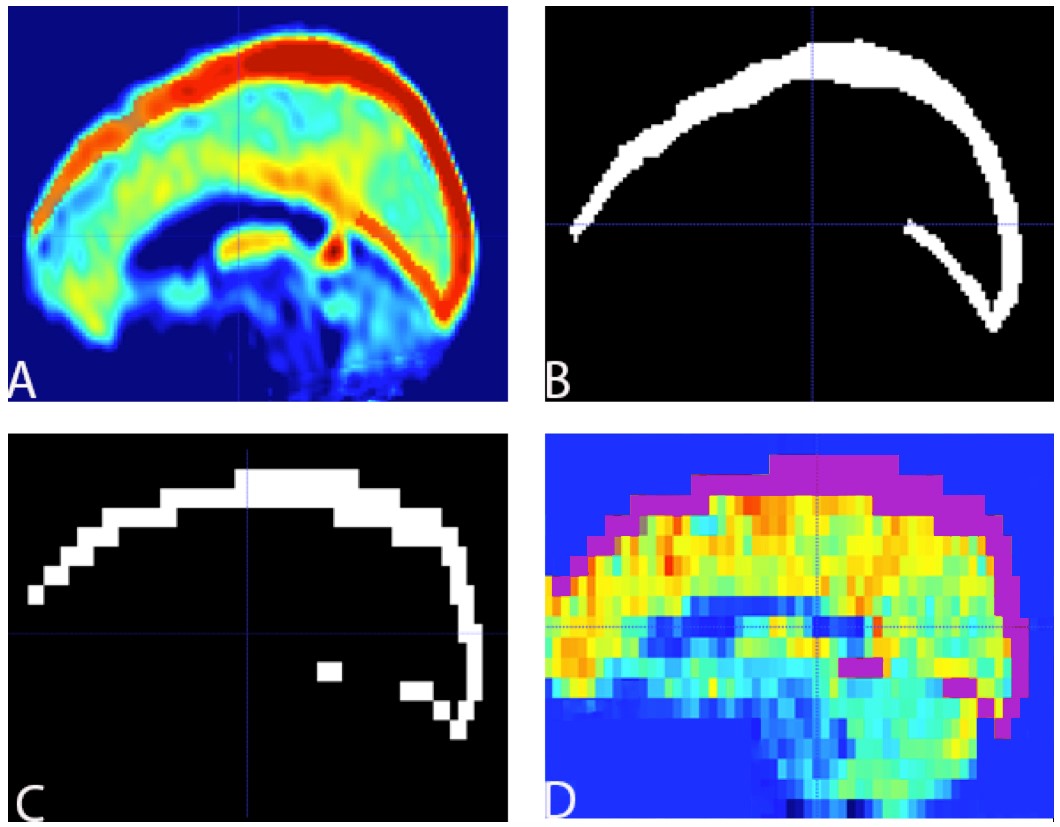
Analysis: Image processing was performed with ExploreASL5. Control-label ASL images were subtracted and converted to CBF images by applying the single compartment perfusion model6. ASL images were visually assessed for the presence or absence of the bright signal in the sagittal sinus. SaS was manually segmented in two group-average images of all participants in standard space: one baseline average image and one after ACZ administration. The segmented images were resampled to the native ASL space of each participant (Figure 1). The relative change after ACZ administration was measured as follows: (ASL signalPostACZ - ASL signalPreACZ) / ASL signalPreACZ *100%. Results were compared with the CBF values in gray matter of the participants. Univariate correlations were performed using Spearman’s correlation coefficient to find the association between ASL signal in SaS and clinical and demographic parameters.
Results
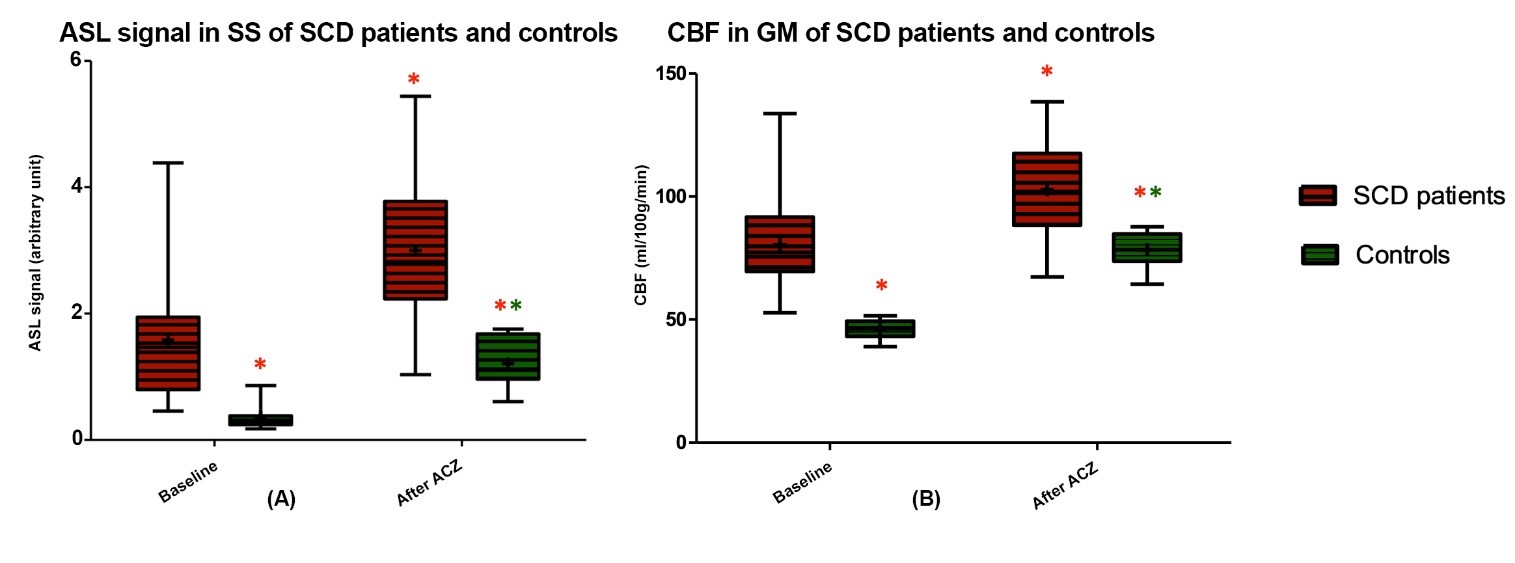
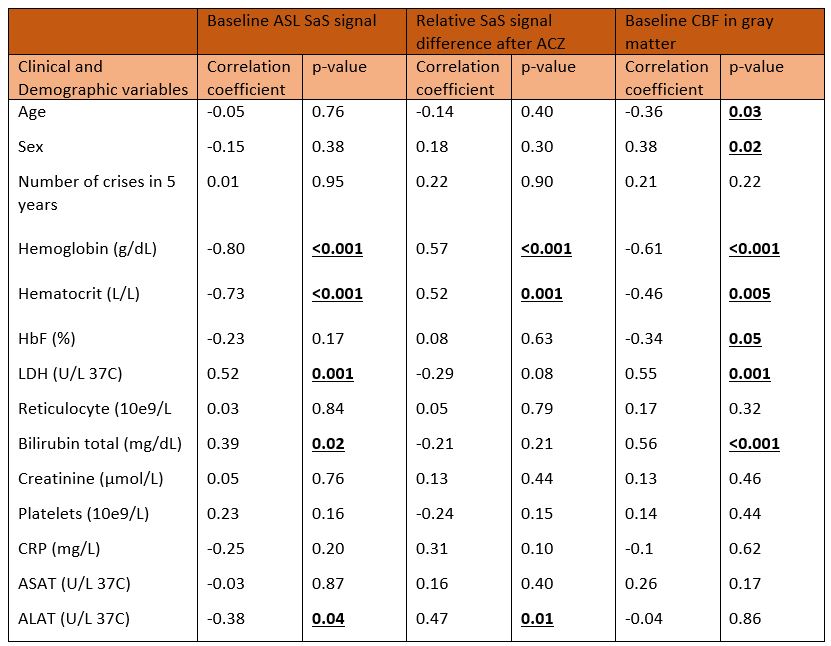
Bright appearance of the SaS was visible in 35/37 patients and 1/10 control before and in all participants after ACZ administration (Figure 2). After semi-automatic segmentation of SaS, the signal in SaS was significantly higher in patients compared to controls as shown in Figure 3A. The differences in signal between patients and controls were higher compared to gray matter CBF differences in these two groups higher (pre-ACZ ratio 2.6:1 and post-ACZ ratio 1.9:1) as showed in Figure 3A and B. Baseline SaS signal in patients with SCD was significantly correlated with hemoglobin, hematocrit, LDH, bilirubin and ALAT levels (Table 1), whereas only hemoglobin, hematocrit and ALAT were significantly correlated with the relative signal difference after ACZ administration (Table 1). Interestingly, SaS baseline signal showed a stronger correlation with hemoglobin levels and hematocrit than baseline CBF in GM.Discussion
We measured a higher ASL signal in SaS of patients with SCD that correlated with several clinical parameters including hemolysis markers bilirubin and LDH. Future studies should investigate how this affects the CBF quantification in gray and white matter. Previous studies showed higher ASL signal in SaS in patients with intracranial arteriovenous shunting and cerebral venous thrombosis7,8. In patients with SCD, our results are perhaps less likely to be a vascular consequence and more likely to relate to functional shunting9. The SaS ASL parameter could be used in future research focusing on shunting as a cause of reduced oxygen extraction in patients with SCD.Conclusion
ASL signal in the SaS is associated with hemoglobin and hemolysis parameters that are related with the severity of sickle cell disease. Our results suggest that SaS label can be used as a proxy parameter of hemodynamic arterial-venous transit efficiency.Acknowledgements
This work is funded by NIH R01 grant HL136484-01A1 and Fonds Nuts Ohra grant 1303-055.References
1. Kato GJ, Gladwin MT, Steinberg MH. Deconstructing sickle cell disease: Reappraisal of the role of hemolysis in the development of clinical subphenotypes. Blood Rev. 2007.
2. Helton KJ, Glass JO, Reddick WE, et al. Comparing segmented ASL perfusion of vascular territories using manual versus semiautomated techniques in children with sickle cell anemia. J Magn Reson Imaging. 2015.
3. Bush AM, Borzage MT, Choi S, et al. Determinants of resting cerebral blood flow in sickle cell disease. Am J Hematol. 2016.
4. Zhao MY, Václavů L, Petersen ET, et al. Quantification of cerebral perfusion and cerebrovascular reserve using Turbo‐QUASAR arterial spin labeling MRI. Magn Reson Med. 2019.
5. Mutsaerts HJMM, Petr J, Thomas DL, et al. Comparison of arterial spin labeling registration strategies in the multi-center GENetic frontotemporal dementia initiative (GENFI). J Magn Reson Imaging. 2018.
6. Alsop DC, Detre JA, Golay X, et al. Recommended implementation of arterial spin-labeled Perfusion mri for clinical applications: A consensus of the ISMRM Perfusion Study group and the European consortium for ASL in dementia. Magn Reson Med. 2015.
7. Amukotuwa SA, Marks MP, Zaharchuk G, Calamante F, Bammer R, Fischbein N. Arterial spin-labeling improves detection of intracranial dural arteriovenous fistulas with MRI. Am J Neuroradiol. 2018.
8. Kang JH, Yun TJ, Yoo RE, et al. Bright sinus appearance on arterial spin labeling MR imaging AIDS to identify cerebral venous thrombosis. Med (United States). 2017.
9. Juttukonda MR, Donahue MJ, Davis LT, et al. Preliminary evidence for cerebral capillary shunting in adults with sickle cell anemia. J Cereb Blood Flow Metab. 2019.
Figures