3270
Time-encoded ASL provides added value in differentiating healthy older from younger individuals compared to single time-point methods1Department of Radiology, Leiden University Medical Center, Leiden, Netherlands, 2Pasqual Maragall Foundation, Barcelonaβeta Brain Research Center (BBRC), Barcelona, Spain, 3Philips Iberia, Madrid, Spain, 4Philips, Best, Netherlands
Synopsis
Age is an important risk factor for cerebrovascular disease. ASL can lend different insights depending on the choice of read-out (3D or 2D) and post-label-delay (PLD) for instance. We assessed differences in cerebral blood flow (CBF), and investigated the added value of arterial transit time (ATT) for differentiating older from younger healthy volunteers. Single-PLD 2D-pCASL and time-encoded (te-)ASL had almost identical CBF, while multi-PLD te-ASL offered the additional option to estimate ATT and blood volume. We found prolonged ATT despite unaffected CBF in older versus younger volunteers. TE-ASL could therefore provide ‘free’ information aside from perfusion in clinical settings.
Introduction
Age is the single most important risk factor for stroke and cerebrovascular disease. In fact, up to 28% of the healthy ageing population >65years are identified with subclinical features of stroke1. Therefore, the clinical relevance of cerebral perfusion imaging is increasing. Aside from providing non-invasive measures of perfusion, free-lunch time-encoded ASL (te-ASL)2 offers the ability to measure arterial transit time (ATT), allowing predictions of ischemic tissue outcome3,4, and arterial blood volume (aBV)5.Even after the consensus paper6, different (2D or 3D, single- or multi-time-point) implementations of ASL are still being employed. However, it is unknown whether perfusion maps acquired with these different measurement strategies differ among young and elderly populations. We hypothesised that since cerebral hemodynamics change with age, that different ASL-implementations would provide qualitatively different perfusion maps, particularly at more superior slices where the post-label delay is longer for 2D acquisitions. Furthermore, we assessed the added value of ATT maps from te-ASL.
Methods
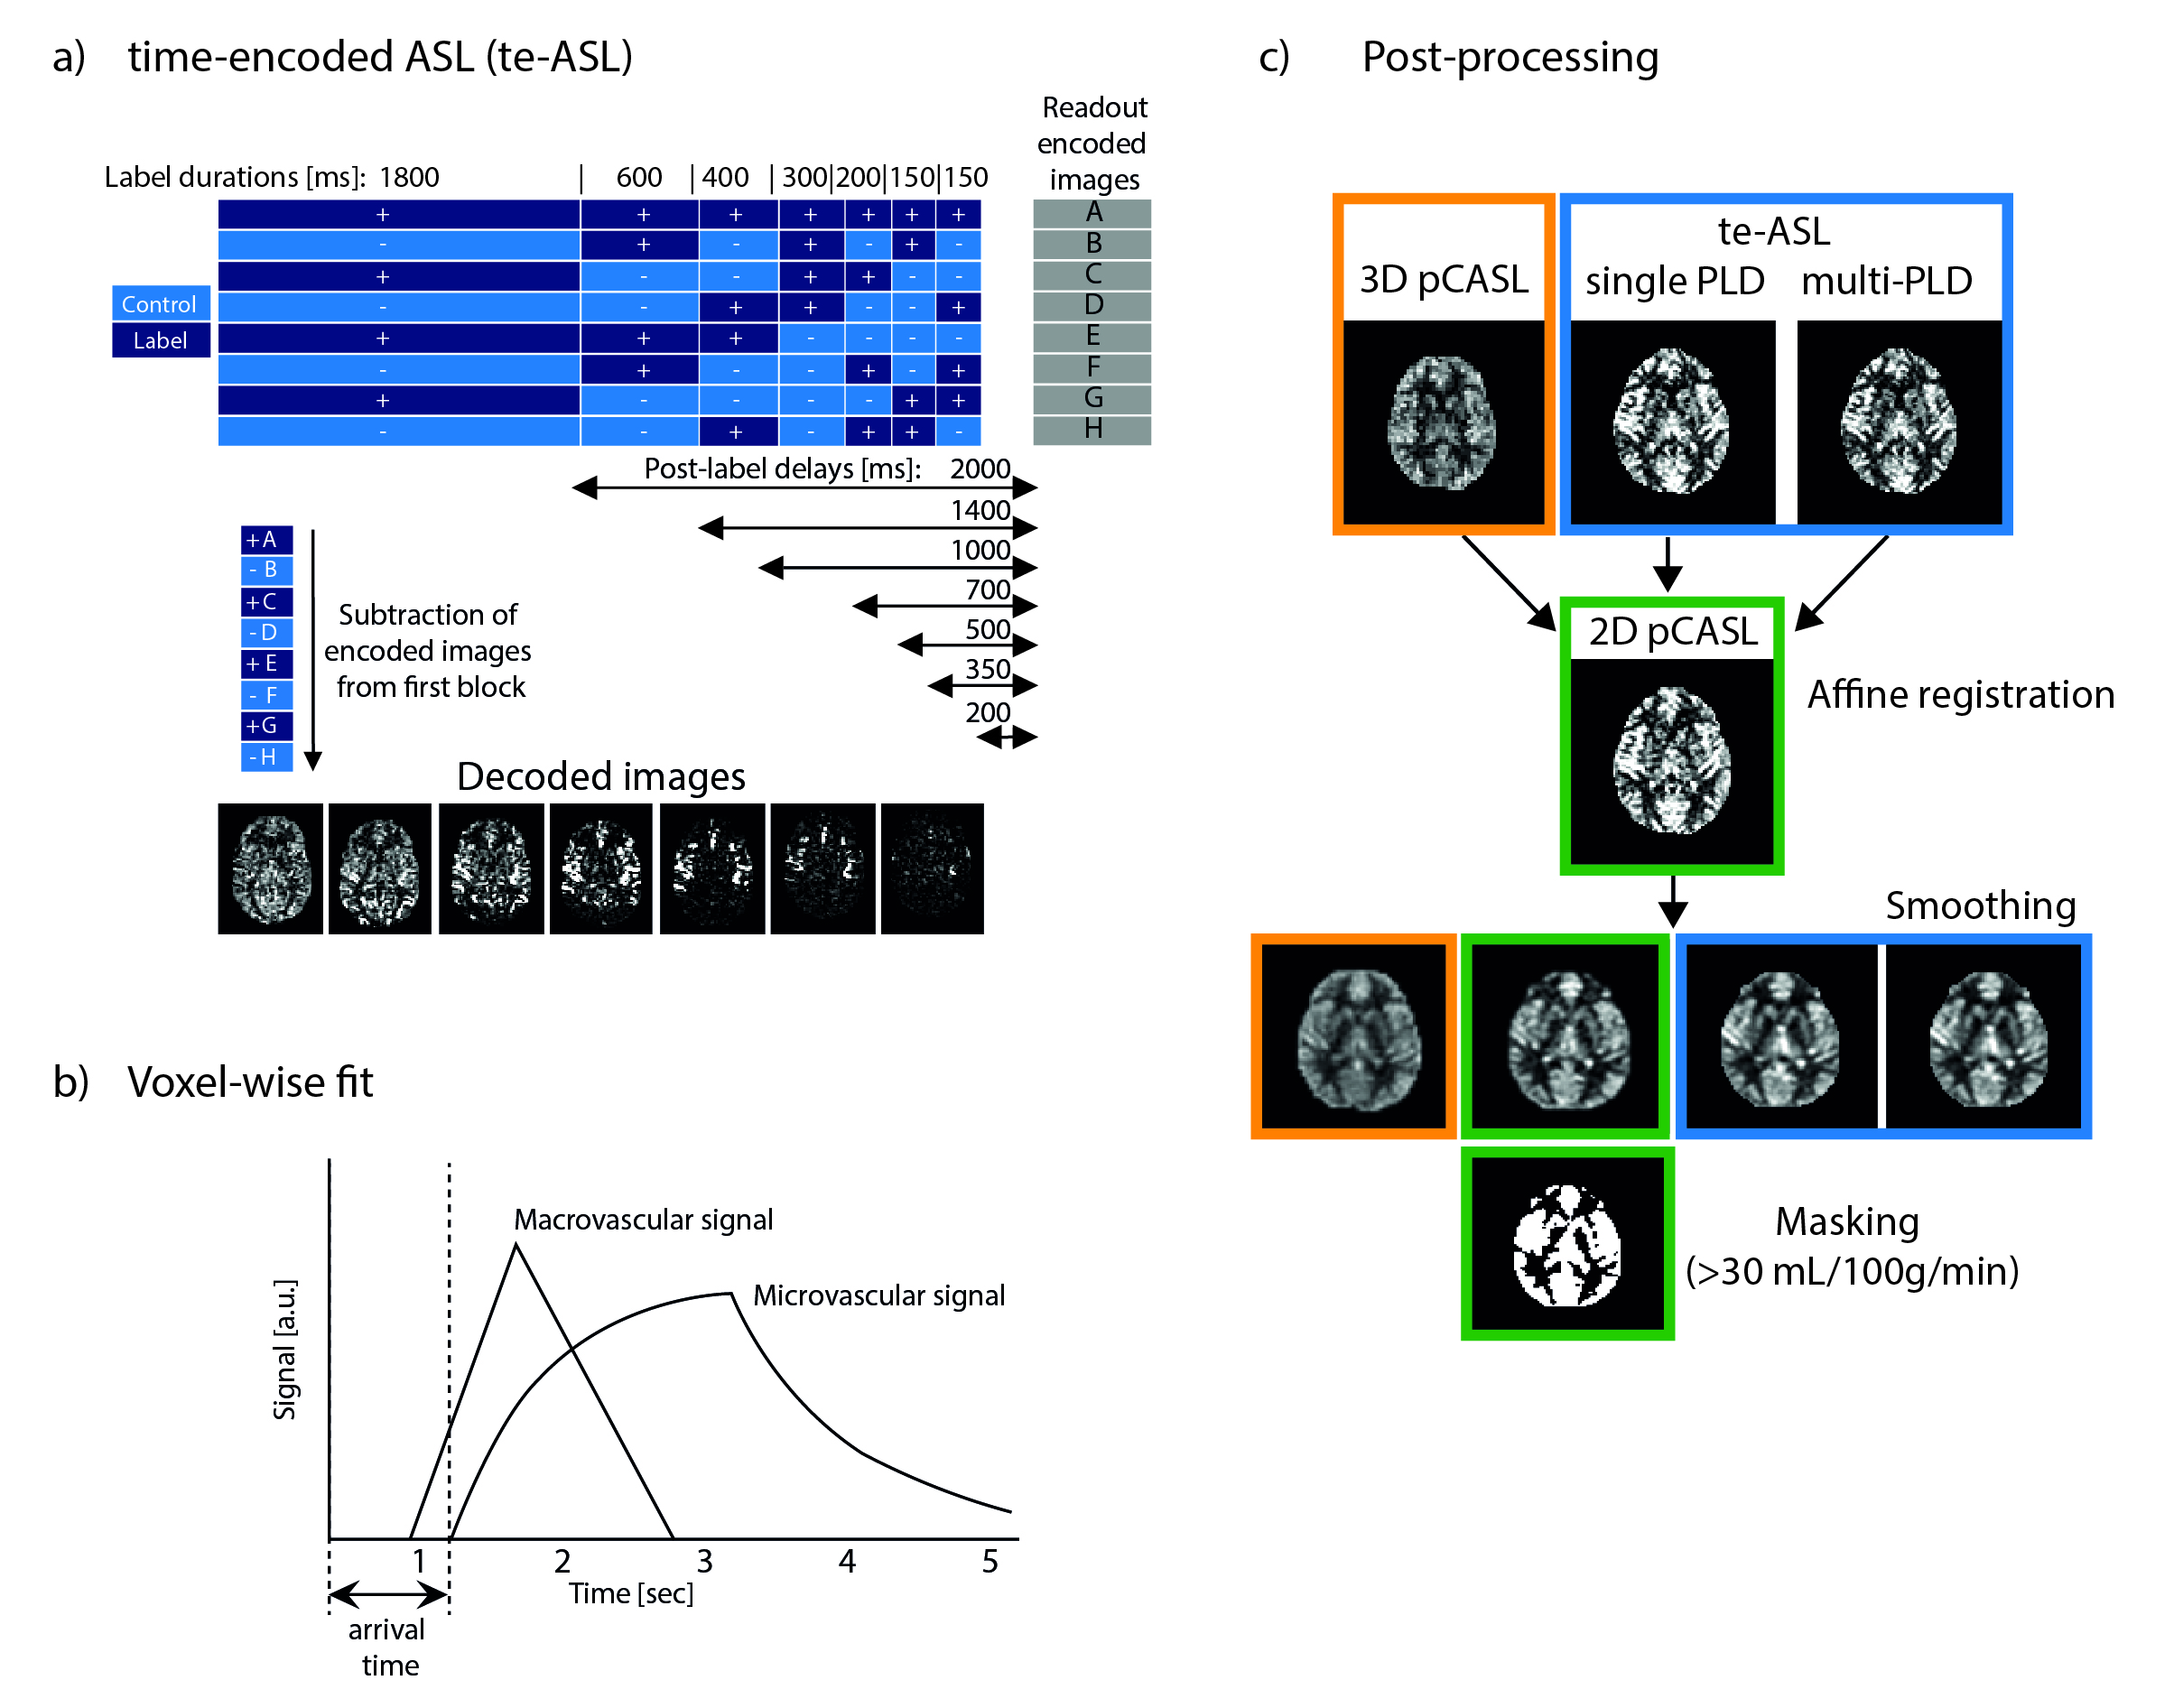
ImagingASL MR imaging was performed in 5 young volunteers (mean age: 35±3 years, 4 women) and 5 older volunteers (mean age: 70±1 years, 5 women) at 3T (Philips, Best, NL) with a 32-channel receive head-coil. 3D pCASL data were acquired with a multi-shot 3D GRASE sequence with TSE/EPI factor 18/15, FOV=240x240x120 mm3, voxel size=3.75x3.75x4 mm3, 3 dynamics including one dynamic for magnetization equilibrium (M0). 2D pCASL data were acquired using a single-shot FFE gradient-echo EPI sequence with SENSE=2.5, FOV=220x220x120 mm3, voxelsize=3.06x3.06x6 mm3, 30 dynamics. Time-encoded ASL (te-ASL) data were acquired using a 2D single-shot FFE gradient-echo EPI read-out with a SENSE factor=2.5, FOV=220x220x120 mm3, voxelsize=3.06x3.06x6 mm3, 7x8 Hadamard matrix with labelling durations and PLDs shown in FIG1a. 3D/2D/te-ASL sequences were matched on TR=4127/4600/4127, TE=10/12/10, flip angle=90°, labelling duration=1800ms (for te-ASL the first (perfusion-)block), PLD=2000ms, background suppression and total scan duration 5:22/5:07/5:52 mins. The 2D M0 scan had a TR/TE=2000/10ms, no background suppression and no labelling, and a total scan duration of 0:14 minutes.
Quantification and post-processing
Images were analysed in MATLAB (The MathWorks, Inc., Natick, Massachusetts, USA). Quantification of CBF including M0 and slice timing correction was done according to the ASL consensus paper6; this was also done for the perfusion-block of the te-ASL (which will be called single PLD te-ASL from now on). For te-ASL, CBF, ATT and aBV were fitted voxel-wise to the multi-PLD time-course(FIG1b). A macrovascular model was fitted for aBV-estimation7 and the resulting signal removed. Then a general kinetic model was fitted for CBF- and ATT-estimation8 (fminsearch, MATLAB9).
CBF images were co-registered to each subject’s 2D-pCASL CBF image using SPM12 (www.fil.ion.ucl.ac.uk/spm/software/spm12). The 2D volumes were smoothed (2mm FWHM 2D-Gaussian kernel) to visually match the blurring in the 3D volume(FIG1c). Grey matter (GM) was defined in each subject as voxels >30 mL/100g/min in the 2D-pCASL CBF.
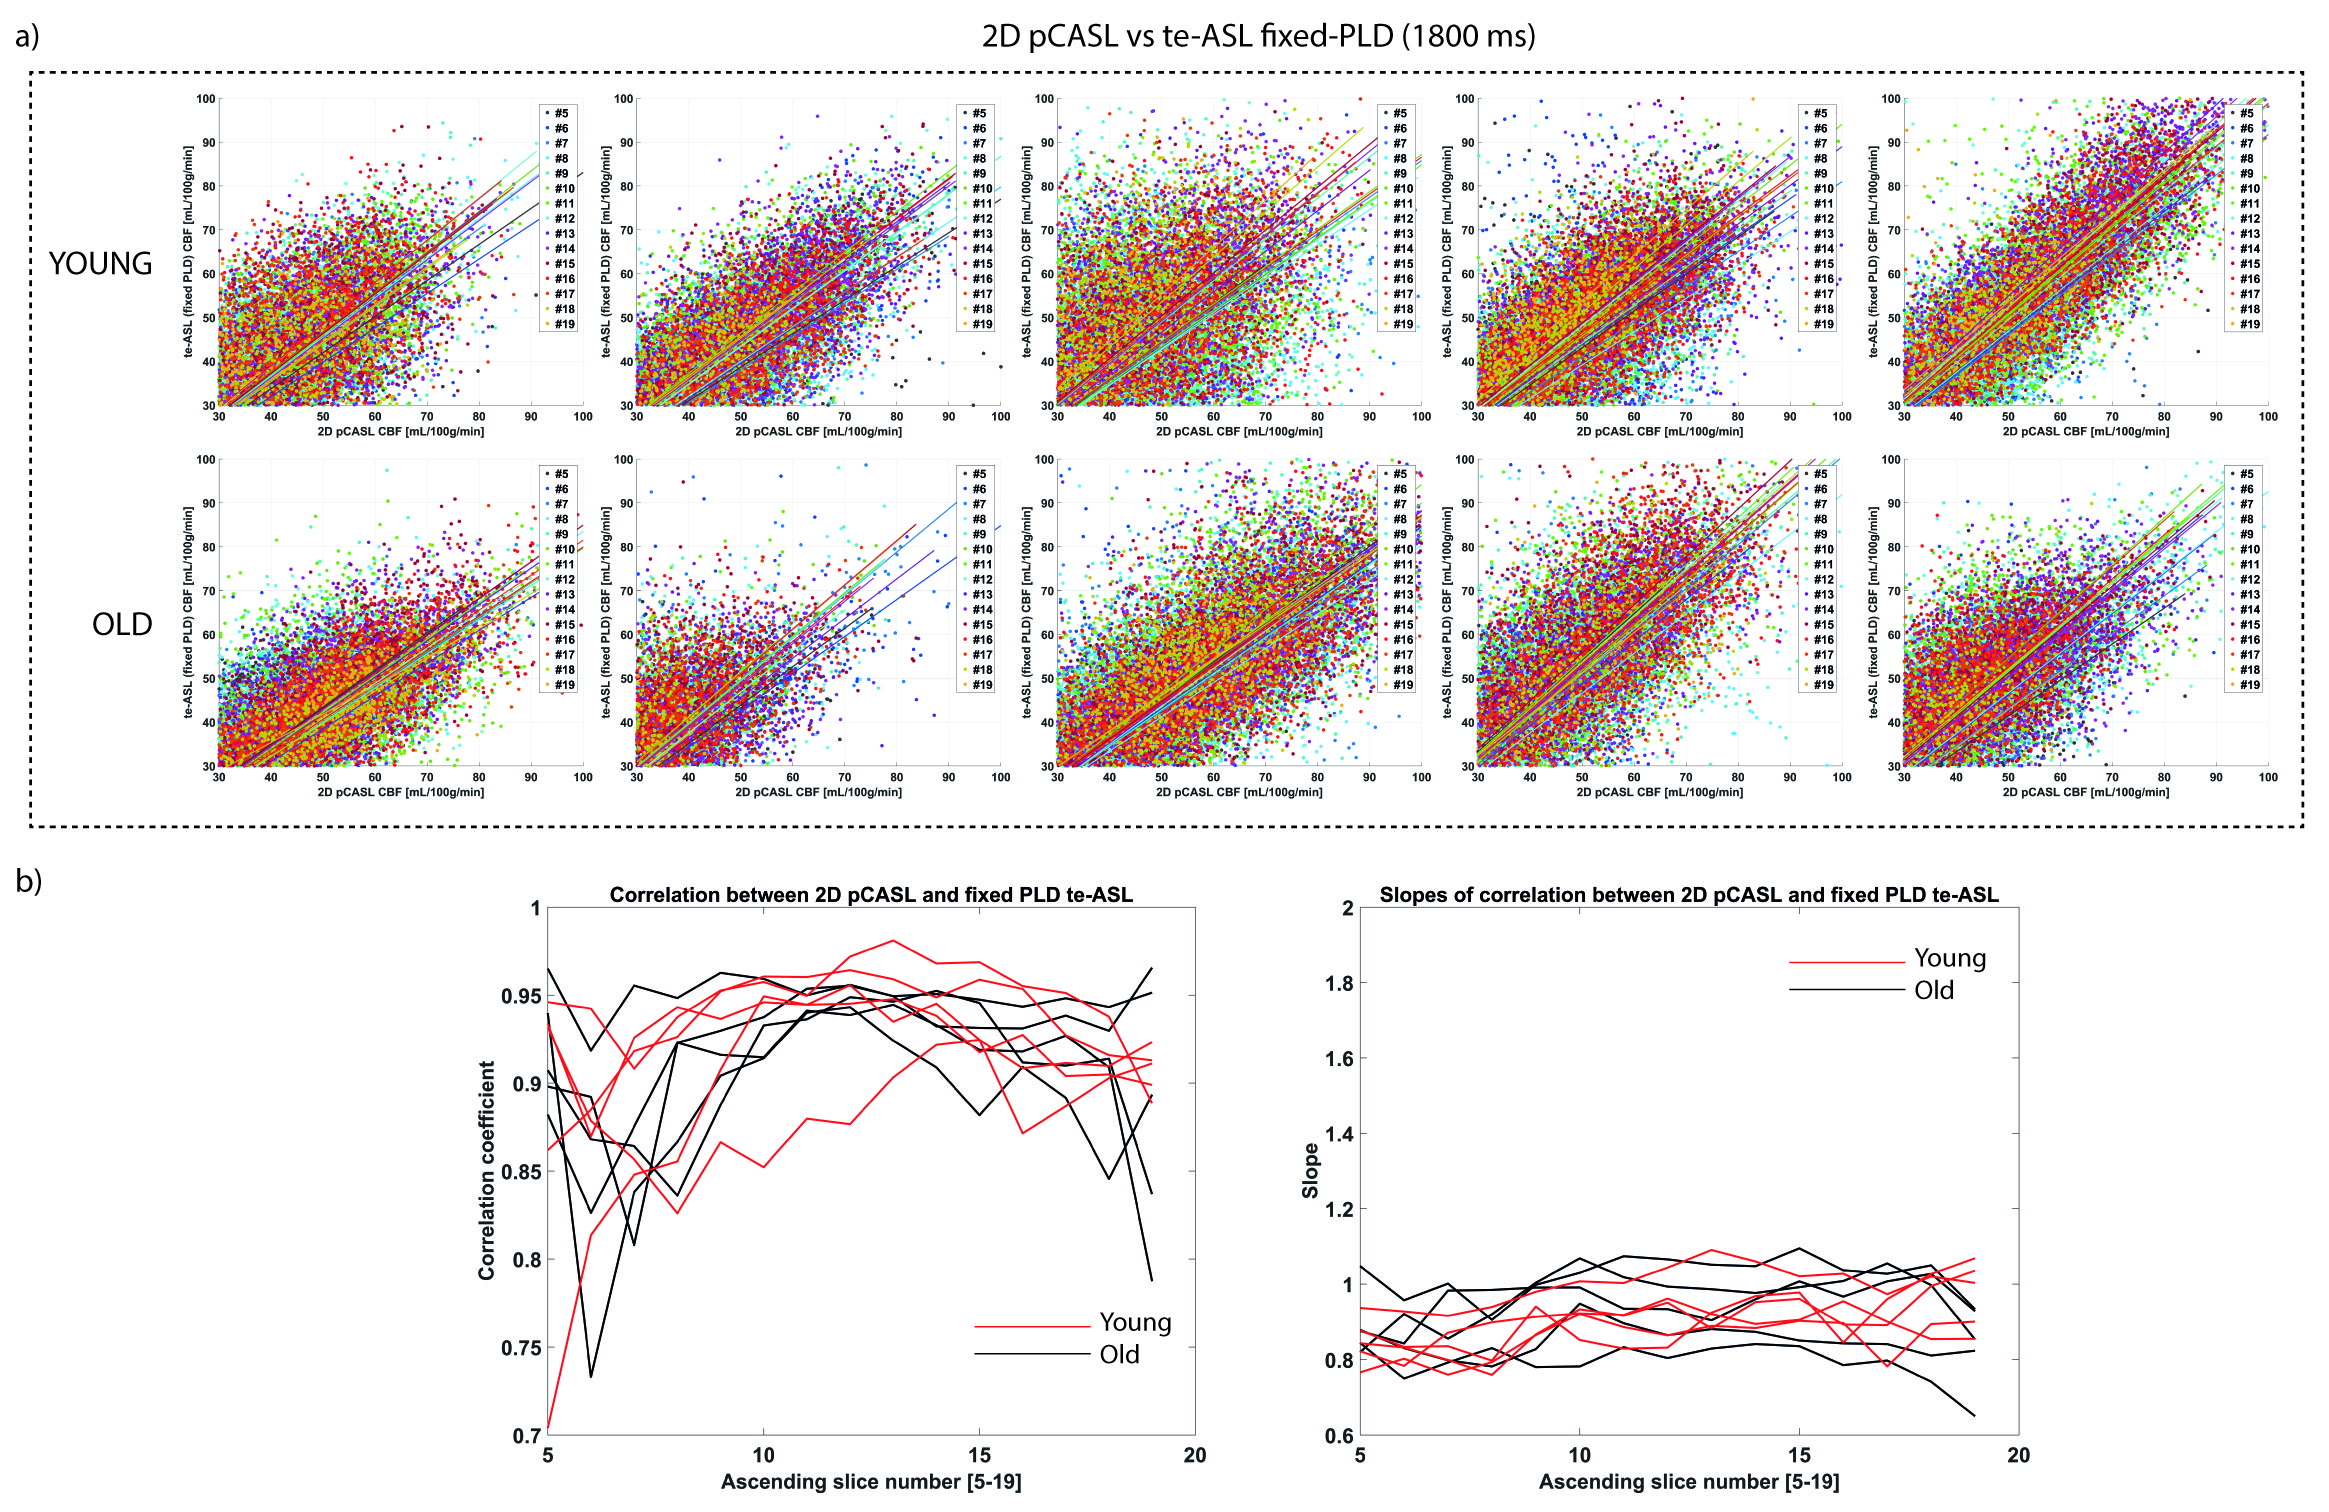
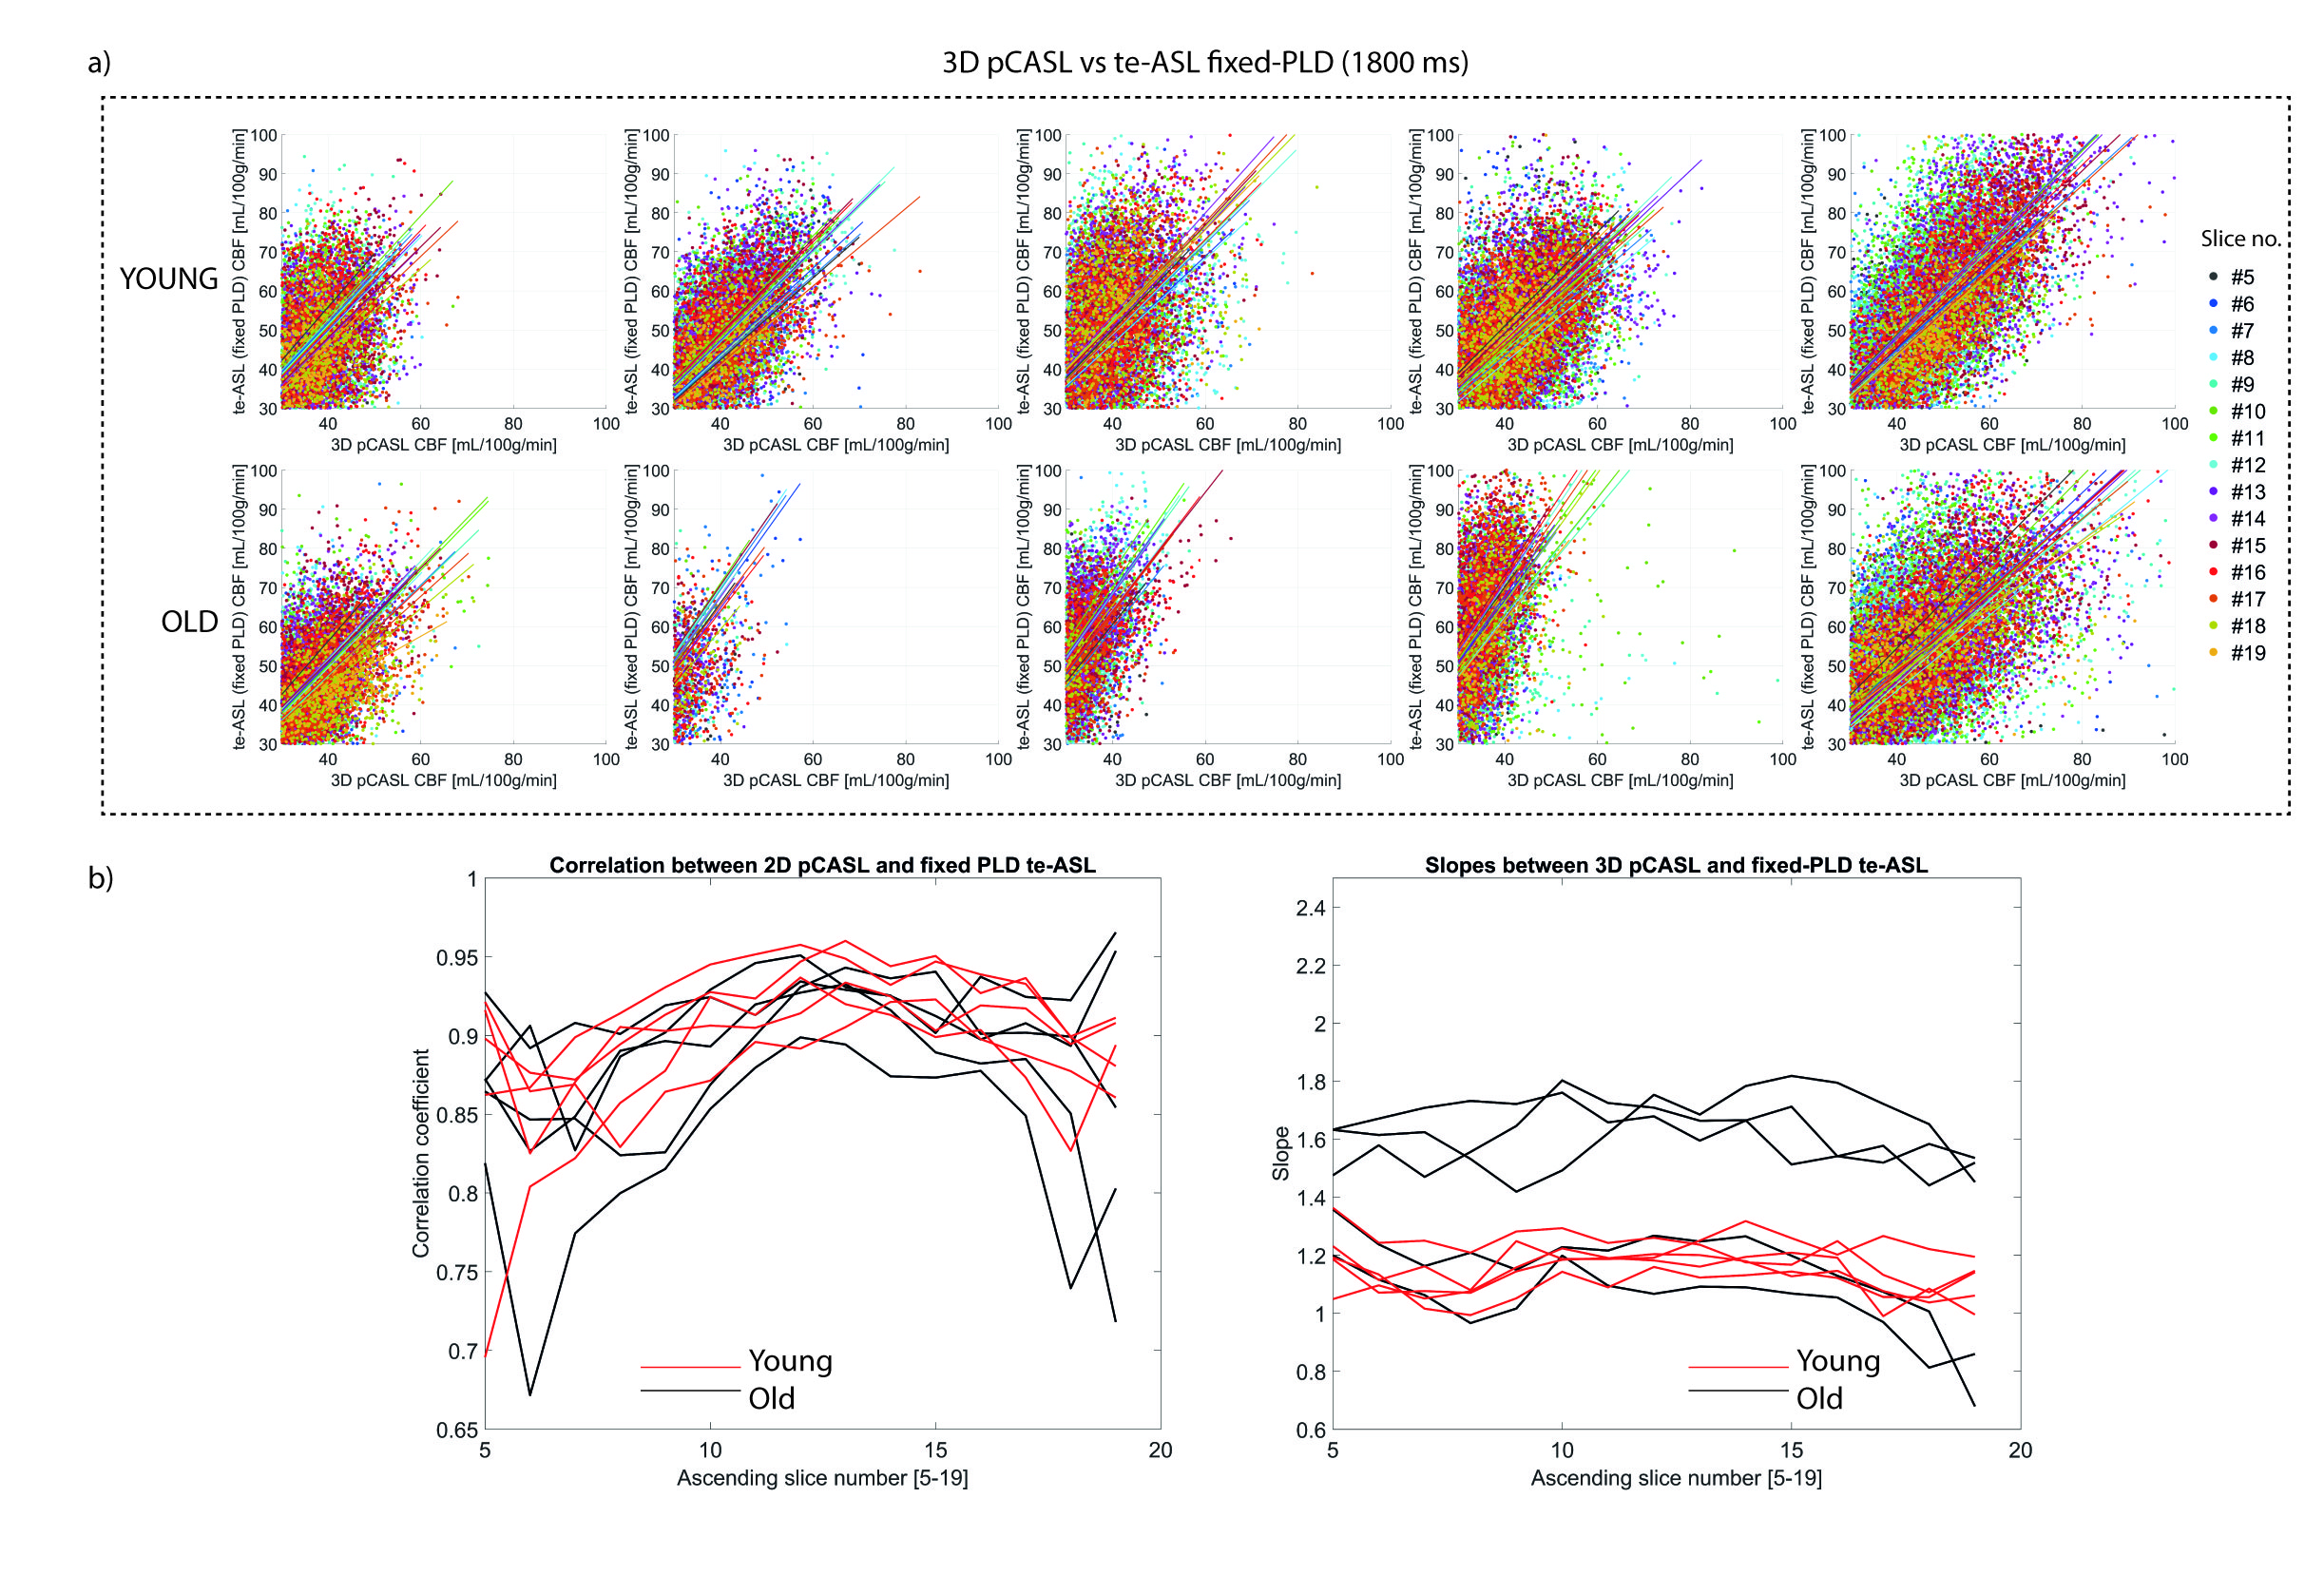
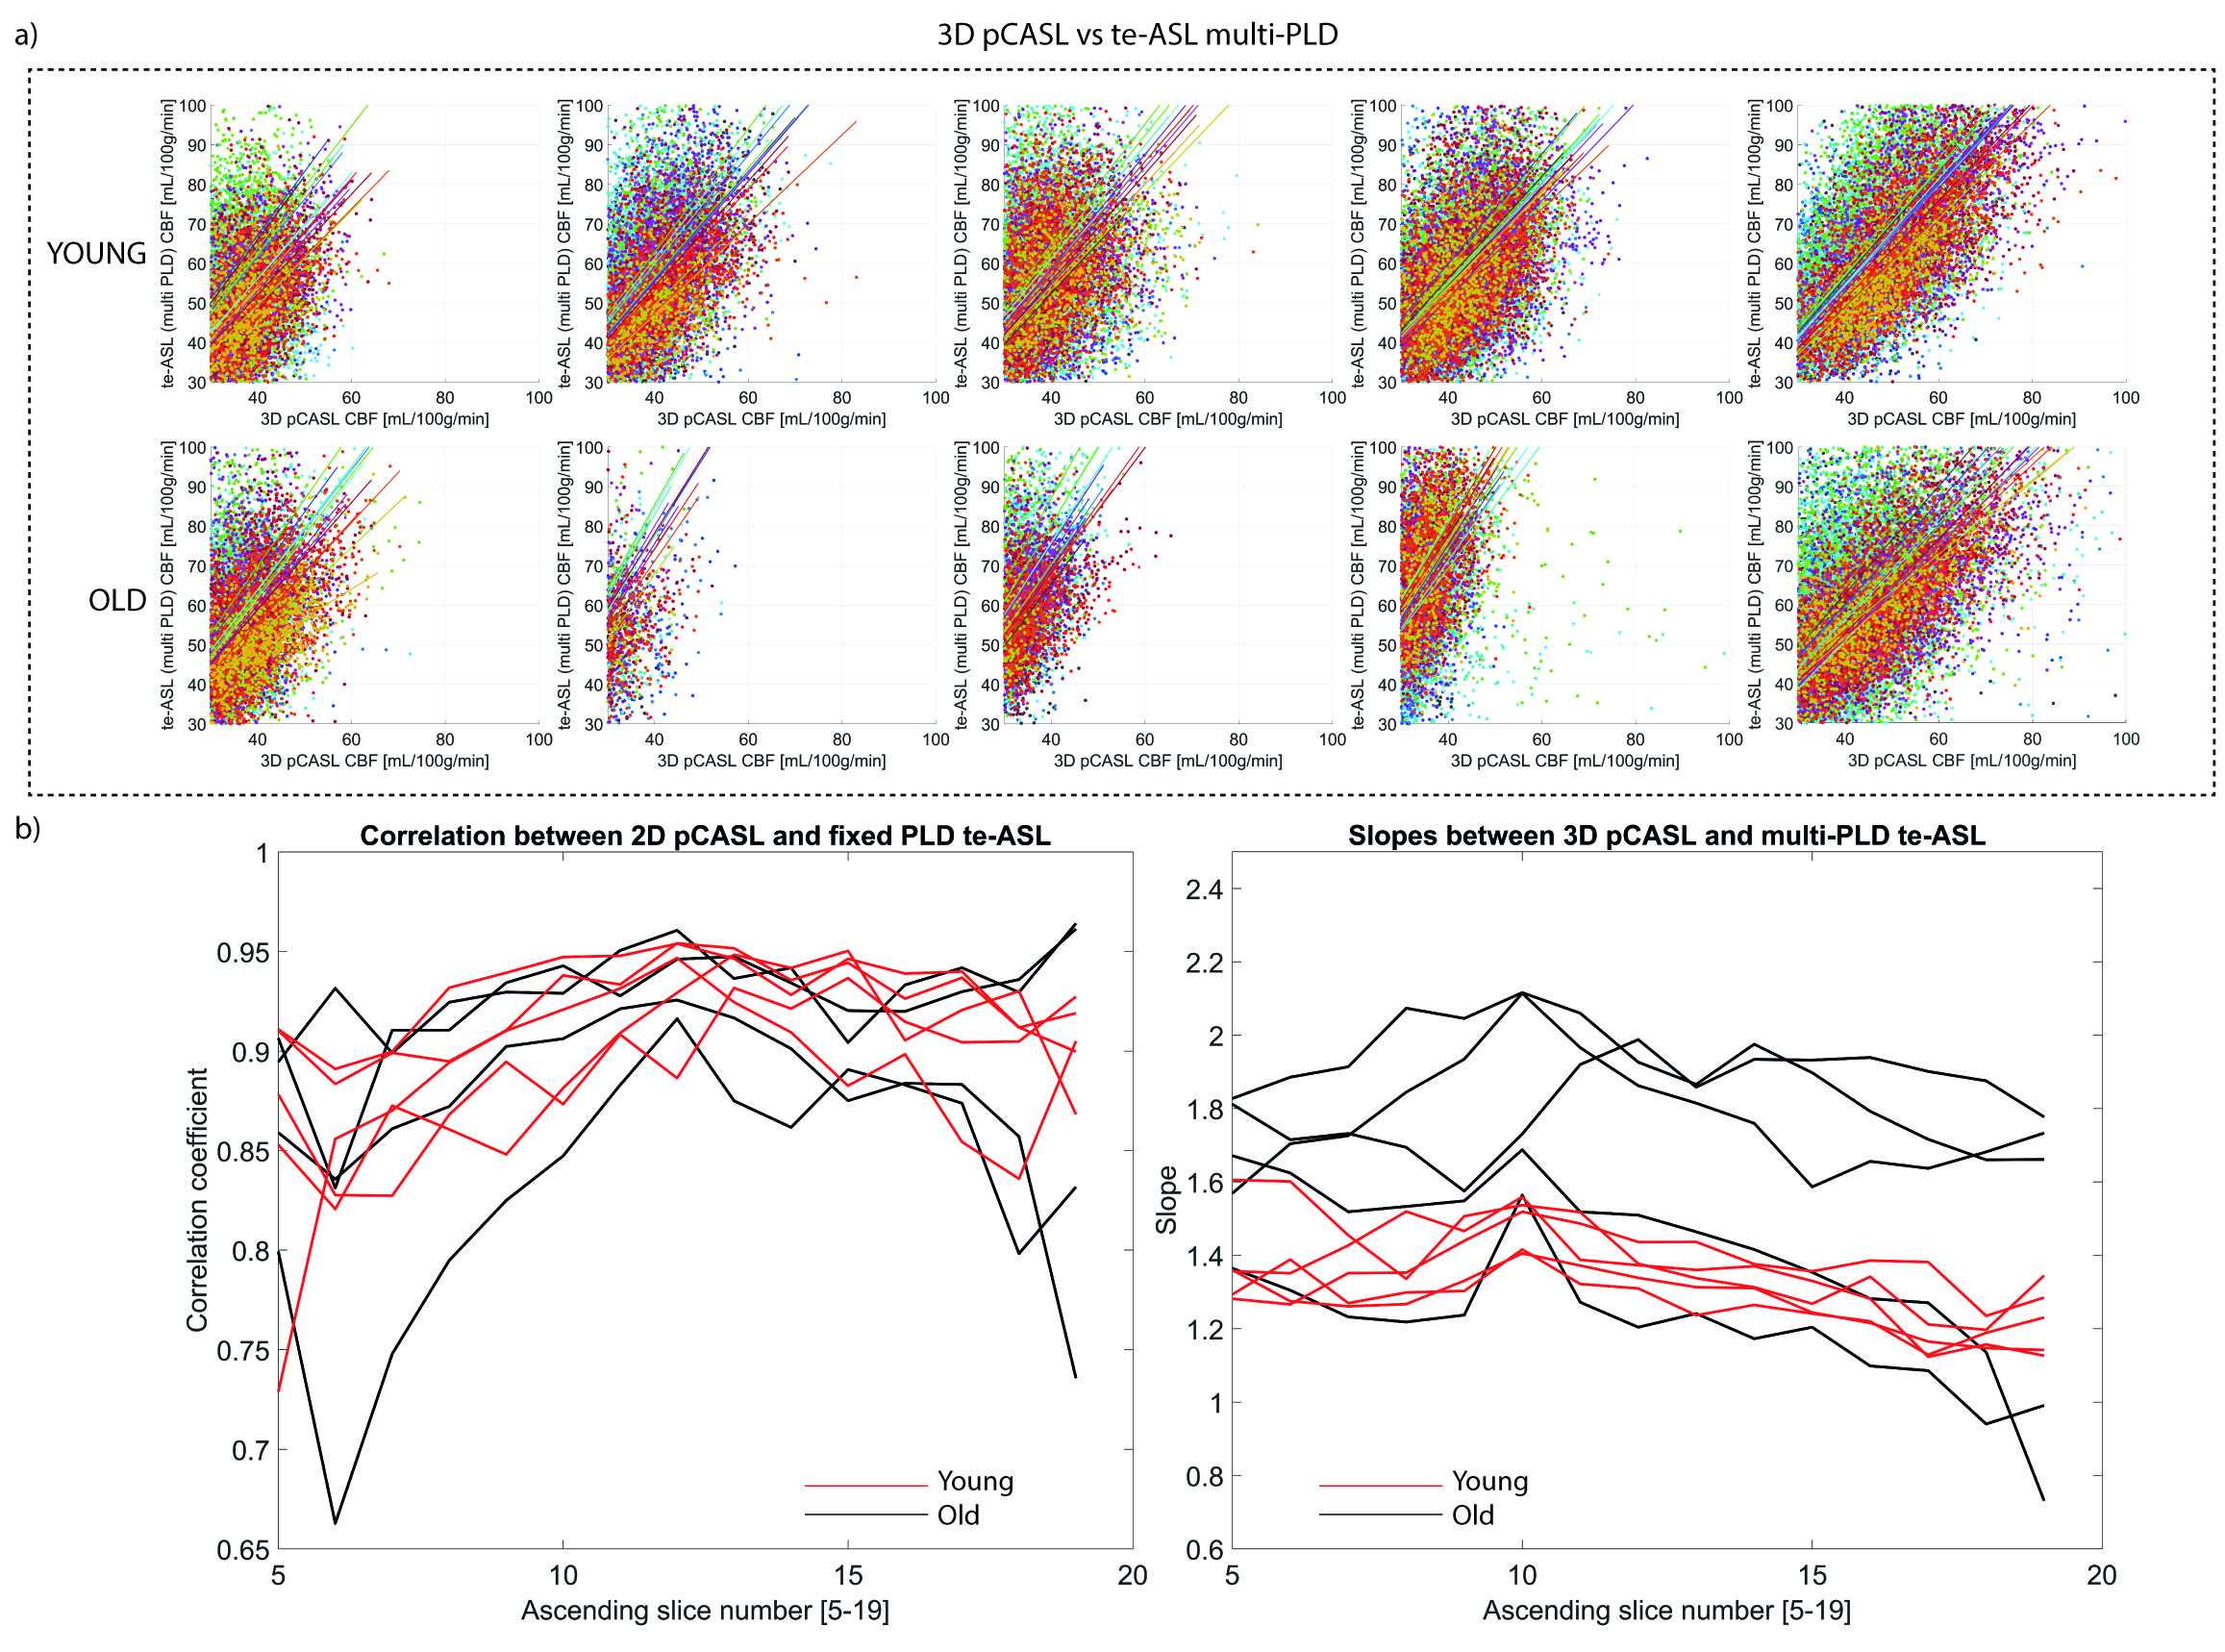
To compare sequences, voxel-wise scatter-plots of GM CBF-estimates were made for each participant with colour-coding of sequential slices. Least squares polynomial fits of the scatterplots yielded slopes, and Pearson’s correlation coefficients were compared for the following pairs: 1) 2D-pCASL vs single-PLD te-ASL), 2) 3D-pCASL vs single-PLD te-ASL, and 3) 3D-pCASL vs multi-PLD te-ASL.
Results
2D-pCASL versus single-PLD te-ASL CBF was comparable as shown by the scatterplots(FIG2a). Overall, both groups showed similar correlations and similar slopes for all acquired slices(FIG2b). We found similar whole-brain CBF for te-ASL (mean 35±26mL/100g/min) and 2D-pCASL (mean 35±27mL/100g/min) indicating excellent agreement.3D-pCASL versus single-PLD te-ASL (1800ms) showed a larger discrepancy in older subjects, as indicated by the steeper slopes particularly in 3 elderly participants(FIG3b).
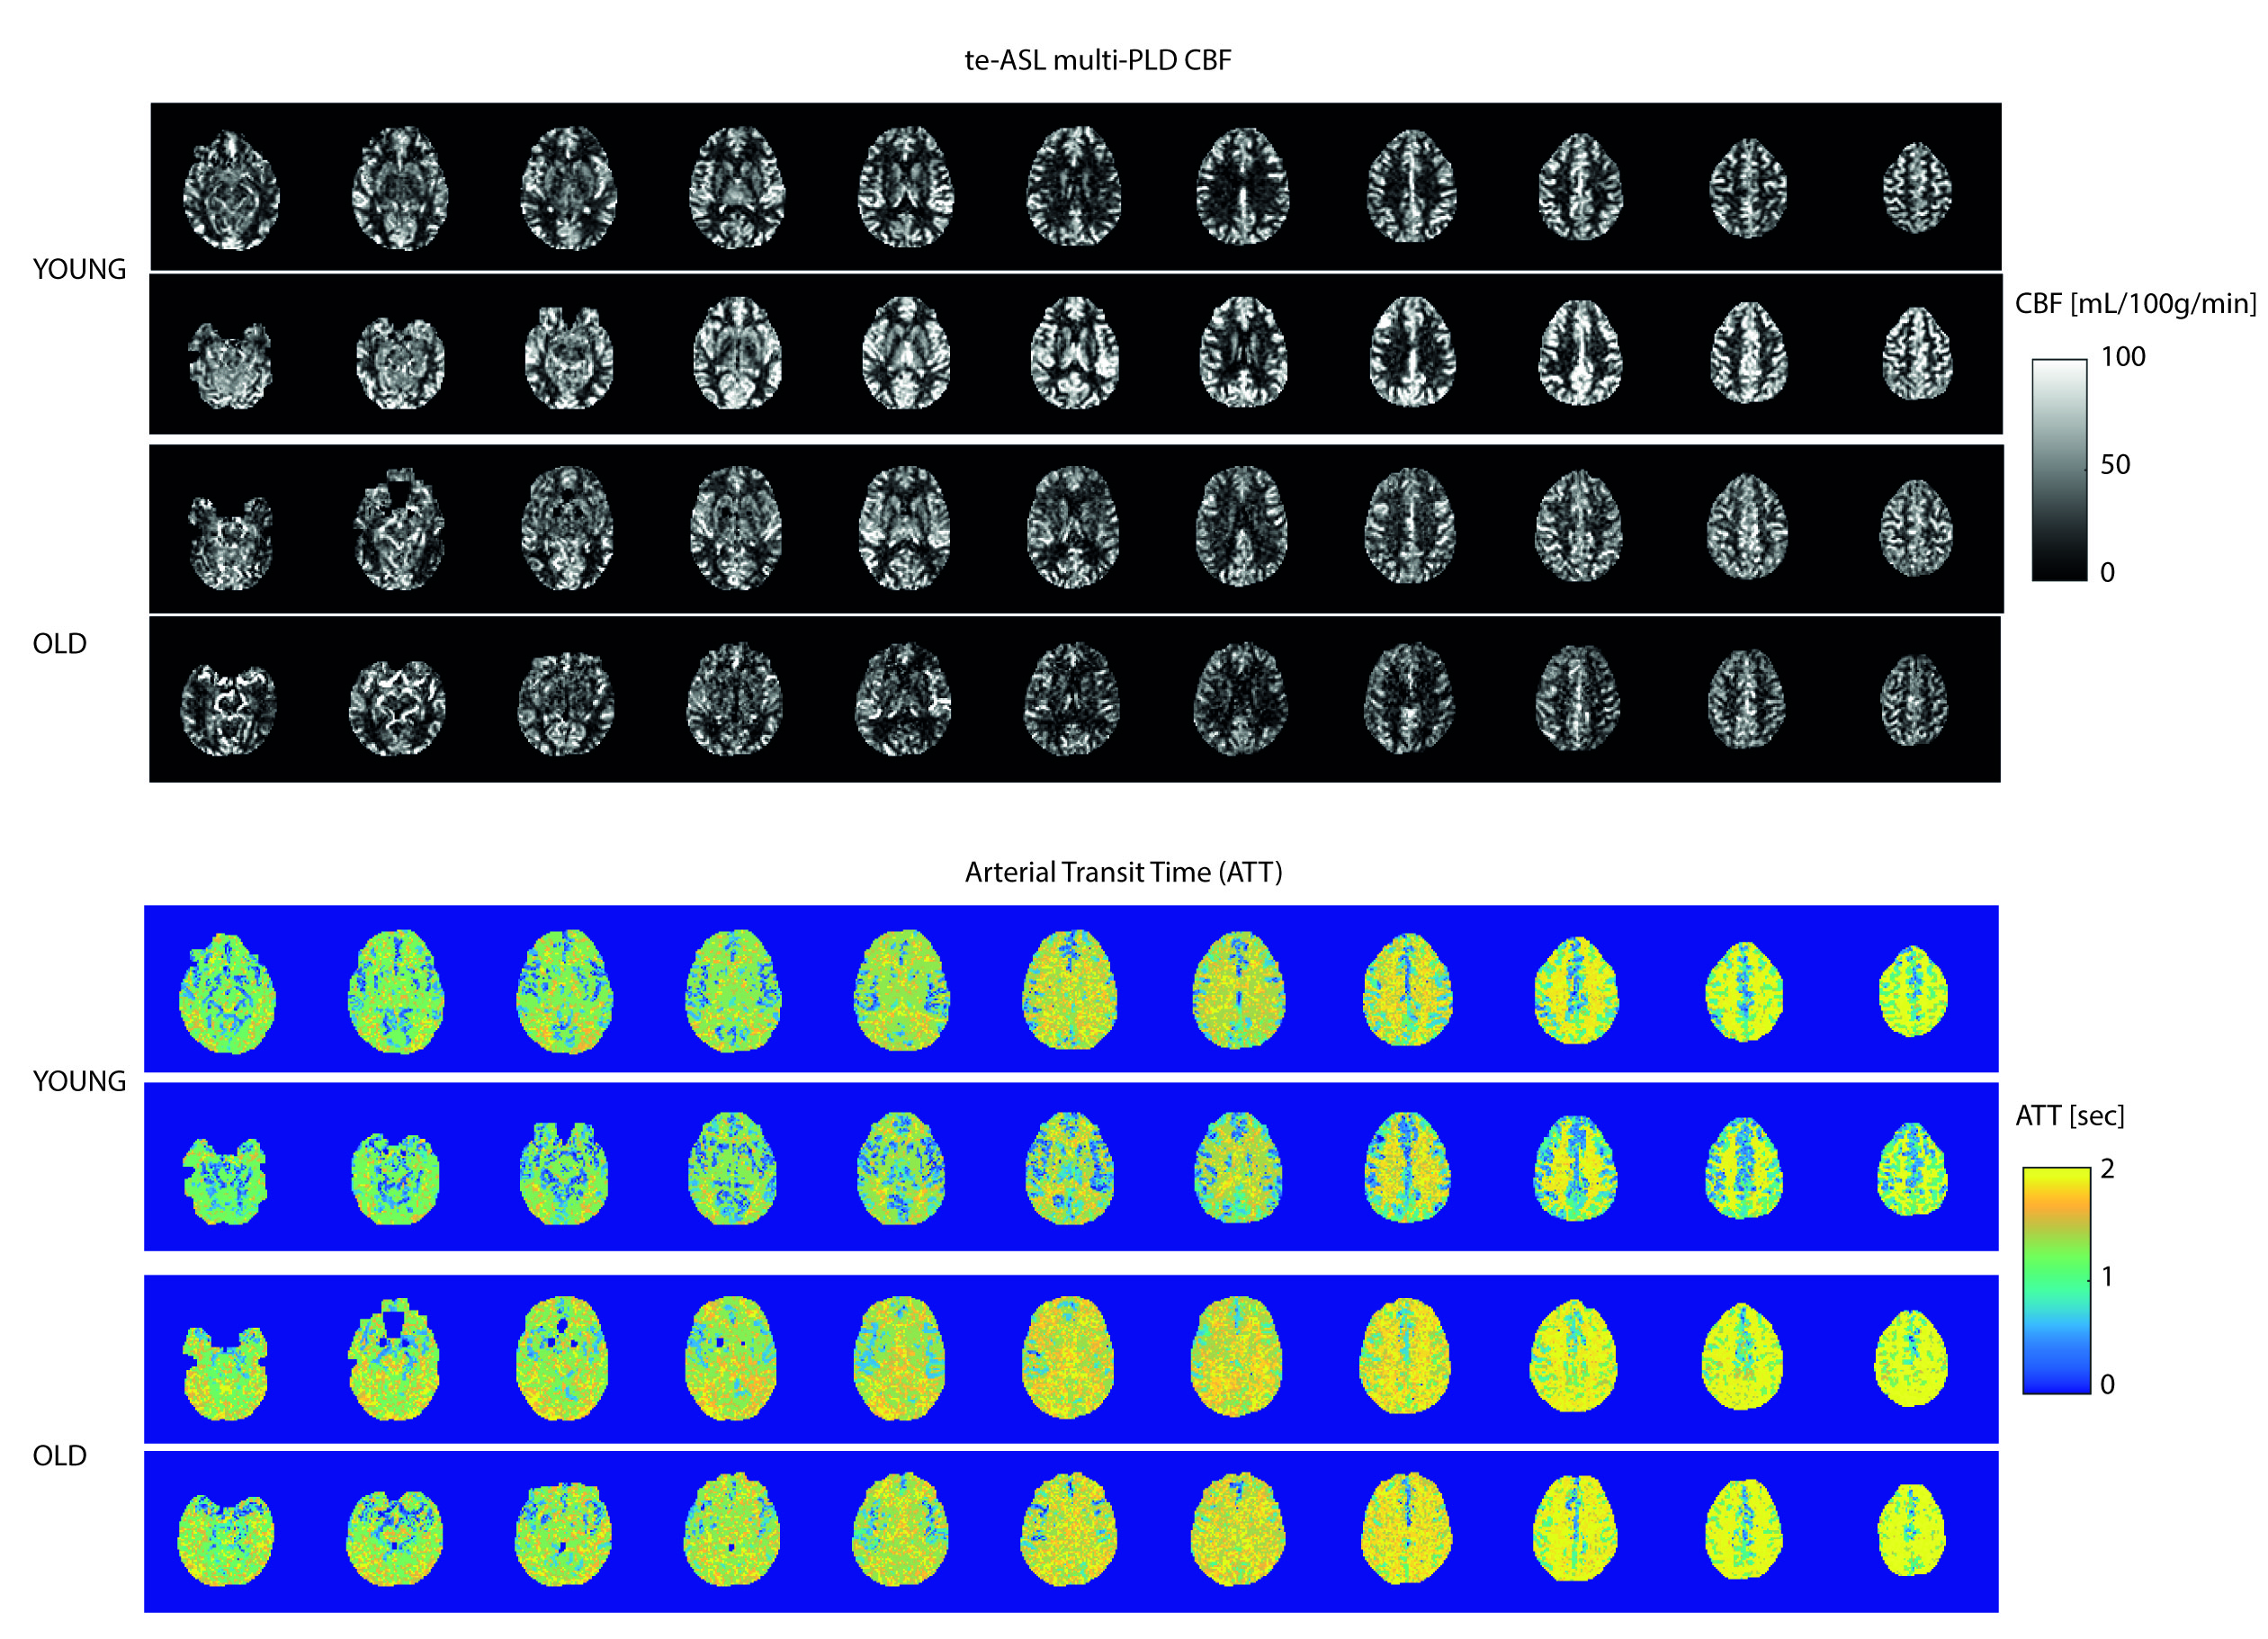
Multi-PLD te-ASL fitted CBF showed higher CBF than single-PLD, but agreement with 3D pCASL was similar to single-PLD te-ASL as indicated by the similar Pearson’s correlation coefficients (>0.85) and slopes (>1)(FIG4). Whole-brain multi-PLD te-ASL CBF was not significantly different in older participants (43 ±30mL/100g/min) versus younger participants (43±33mL/100g/min, P=0.65). However, ATT was longer in the older (1.45±0.52s) versus younger participants (1.29 ± 0.54s, P<0.01)(FIG5).
Discussion
3D-,2D-, and te-ASL showed concordant results and slice-wise correlations differentiated older from younger individuals, particularly in 3D-pCASL versus te-ASL, which may be explained by the use of a single, on average shorter, PLD for the 3D GRASE readout. In elderly subjects with longer arrival times, this PLD may be too short to guarantee total delivery of labelled spins. In the 2D sequences, the effective longer PLD for the higher slices mitigate such effects. The almost identical CBF obtained from single-PLD te-ASL and 2D-pCASL indicates that te-ASL can offer additional parameters at no cost to CBF as proposed by Günther2. Higher vascular signal captured in lower slices may explain the steeper slopes observed for 3D-pCASL versus te-ASL, again showing that both sequences show distinct information. A limitation is that 3D-pCASL was not compared to 3D GRASE te-ASL. Second, low temporal resolution could underestimate aBV and ATT10,11, but since prolonged ATT is easier to detect, te-ASL should still be suitable for older clinical populations.Conclusion
In elderly populations single-PLD pCASL may underestimate CBF if the PLD is not known a priori. Te-ASL provides additional ATT information, which we found to be prolonged in older volunteers, even though CBF was the same. Hence, ATT could be a more sensitive marker for risk profiling in clinical settings.
Acknowledgements
This research was supported by the EU under the Horizon2020 program (project: CDS-QUAMRI), and by Philips, Best, The Netherlands.References
1. Vermeer et al. Lancet Neurol. 2007
2. Gunther ISMRM, 2007
3. Ford et al. Blood 2018
4. Christensen et al. Stroke 2009
5. van Westen et al. MAGMA 2011
6. Alsop et al. MRM 2015
7. Chappell et al. MRM 2010
8. Buxton et al. MRM 1998
9. Lagarias et al. SIAM 1998
10. van der Plas et al. MRM 2019
11. Guo et al. JMRI 2018
Figures