3269
Untangling Perfusion from Atrophy in Fronto-Temporal Dementia using Multimodal Correlation and Machine Learning1Department of Medical Physics and Biomedical Engineering, University College London, London, United Kingdom, 2Department of Radiology and Nuclear Medicine, Erasmus Medical Centre, Rotterdam, Netherlands, Rotterdam, Netherlands, 3Centre for Clinical Brain Sciences, University of Edinburgh, Edinburgh, United Kingdom, 4King's College London, London, United Kingdom, 5University College London, London, United Kingdom, 6Dementia Research Centre, University College London, London, United Kingdom, 7Neuroradiological Academic Unit, Department of Brain Repair and Rehabilitation, Institute of Neurology, University College London, London, United Kingdom, 8Wellcome Centre for Human Neuroimaging, Institute of Neurology,, University College London, London, United Kingdom
Synopsis
Partial volume correction (PVC) is often applied to analyse cerebral blood flow (CBF) in dementia, in order to isolate perfusion changes from atrophy of grey matter. But PVC inevitably results in spatial smoothing of CBF, which may weaken the informative spatial pattern of CBF changes.
Here, machine learning was used to detect Fronto-Temporal Dementia (FTD), considering spatial patterns in CBF from Arterial Spin Labelling, with and without PVC. Also, multimodal voxel concordance analysis untangled the spatial relationship between GM atrophy and CBF. This information was used with CBF PVC to improve the FTD detection accuracy without the atrophy signature.
Introduction
Arterial Spin Labelling (ASL) is a non-invasive MRI method to measure cerebral blood flow (CBF) [1]. Partial volume correction (PVC) is often applied in analysis of CBF in dementia, in order to isolate perfusion changes not directly related to atrophy of grey matter (GM). However, the additive effects of atrophy and CBF changes may be beneficial as a sensitive early biomarker for the disease. Also, PVC inevitably results in spatially smoothing of the CBF maps, which may weaken the informative spatial pattern of CBF changes.Here, Support Vector Regression (SVR) based machine learning [2] was used to identify abnormalities in patients with Fronto-Temporal Dementia (FTD) relative to controls, by considering spatial patterns in GM volume density and CBF from ASL, with and without PVC. Also, multi-modal voxel concordance analysis was used to analyse the spatial relationship between GM atrophy and CBF. This information was then used with PVC to improve the SVR accuracy when detecting FTD based upon CBF without the atrophy signature.
Also, multi-modal voxel concordance analysis was used to analyse the spatial relationship between GM atrophy and CBF. This information was then used with PVC to improve the SVR accuracy when detecting FTD based upon CBF without the atrophy signature.
Methods
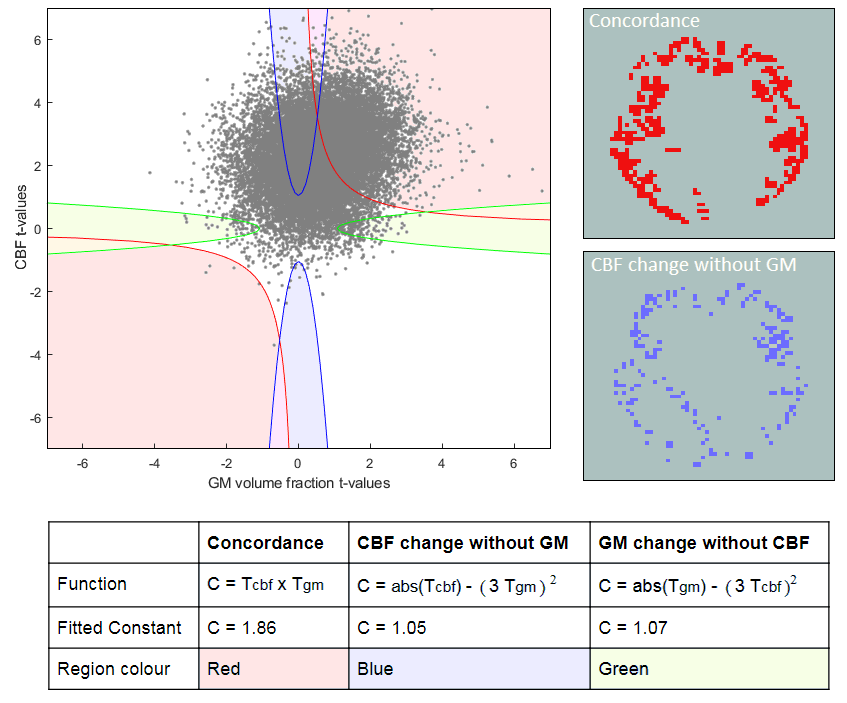
The Iris cohort [3] (age 51–71) included 18 healthy controls and 21 patients with FTD scanned on a 3T GE Discovery MR750 (pCASL, 3D axial stack of spirals readout, 3.75×3.75×4.0mm3 interpolated in plane x2, label duration/post-labelling delay 1.45/1.53s, 5 repeats). For CBF quantification, M0 images were acquired using a long TR matched stack of spirals readout without labelling. T1-weighted structural images were acquired using IR-FSPGR 1mm3 , TI=0.45s).Group-wise registration was performed using NiftyReg [4], and CBF quantification was performed using FSL’s BASIL [5]. 3D T1w data was segmented using Geodesic Information Flows [6] to estimate GM volume fraction.Voxelwise PVC [7] of the ASL data was performed using a 3x3x3 kernel. The non-parametric multi-modal voxel concordance analysis method [8] firstly requires t-statistics for each voxel from Welch’s two-sample t-test, where the samples are the set of voxel values from the control and FTD groups. Each considered voxel in could then be represented as a 2D t-space point corresponding to its CBF and GM volume fraction t-statistic. The t-space was then segmented into regions corresponding to relationships between CBF and GM changes (figure 1). To demarcate these, the boundary functions were fitted so voxels had a 5% chance of crossing into them when the class labels were randomised. This means that for voxels falling within these boundaries, the relationship is significant at the p <= 0.05 level.
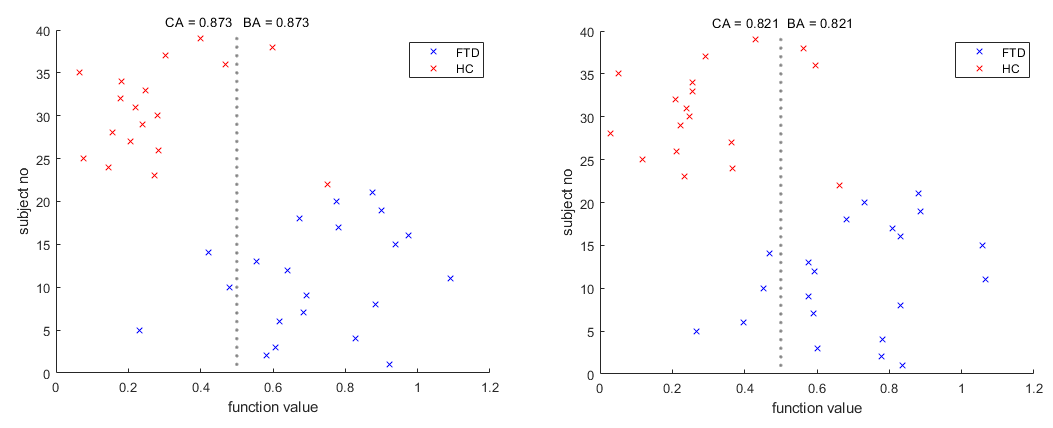
Support Vector Regression machine (SVR) analysis was achieved using the MATLAB deep learning toolbox [9]. Voxels in common space were selected to act as features if the GM fraction was >50% in >=90% of the subjects. The Classification Accuracy (CA) for each SVR was calculated by leave-one-out cross validation, whilst the Balanced Accuracy (BA) was the mean classification accuracy of both groups to account for differences in their size. P values were obtained by repeatedly retraining the classifiers with randomly perturbed class labels, to estimate the probability of the accuracy occuring by chance. SVRs were trained using the ASL CBF maps, with and without PVC, and GM volume fraction maps. After the multi-modal voxel concordance analysis, an SVR was trained using CBF values only from voxels found to be significantly decoupled from GM atrophy. Finally, an SVR was trained using CBF maps with PVC applied in voxels where CBF was coupled with GM atrophy, and, without PVC where CBF and GM atrophy was not coupled. Hence the spatial smoothing associated with PVC was only applied where GM atrophy had a significant impact.
Results
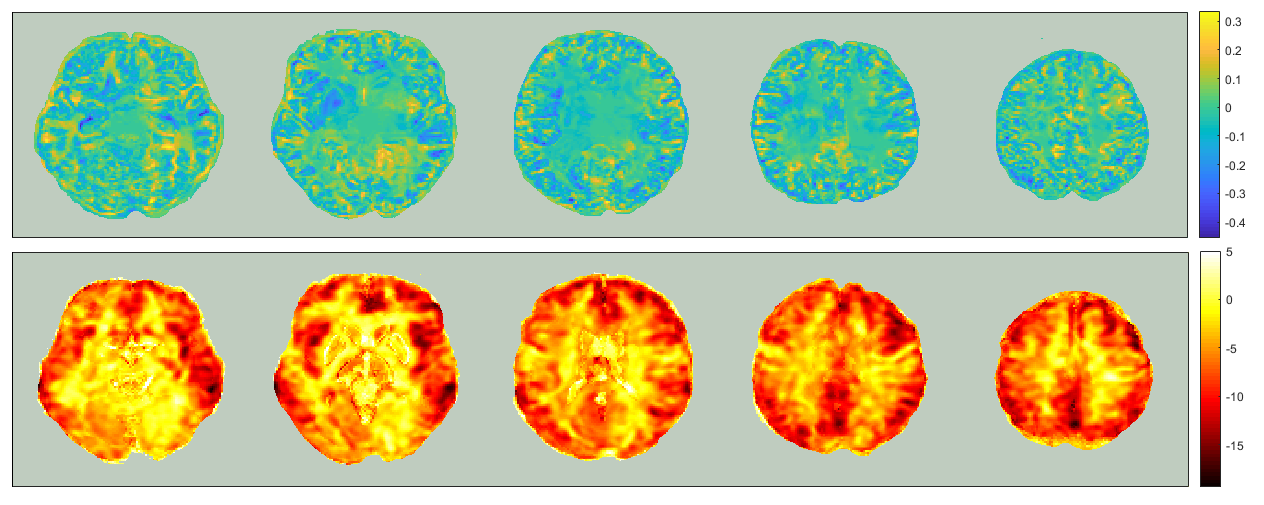
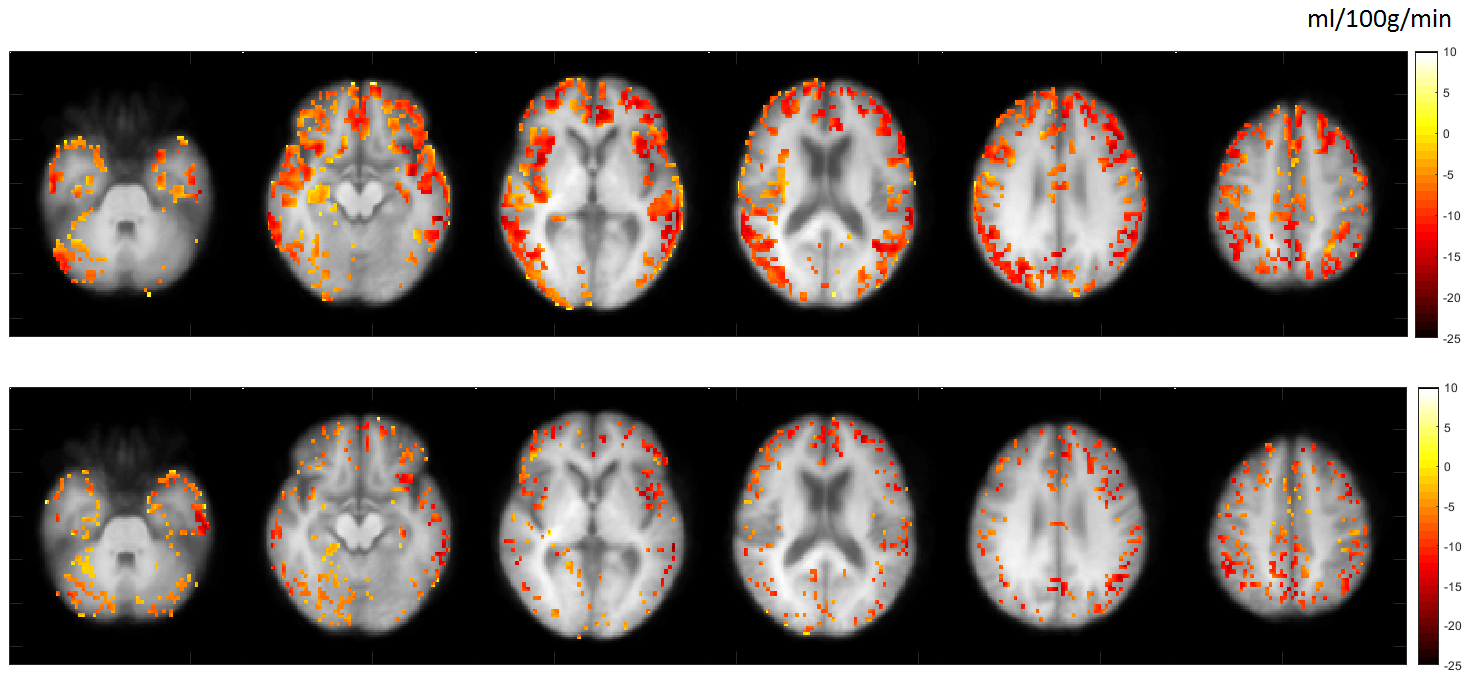
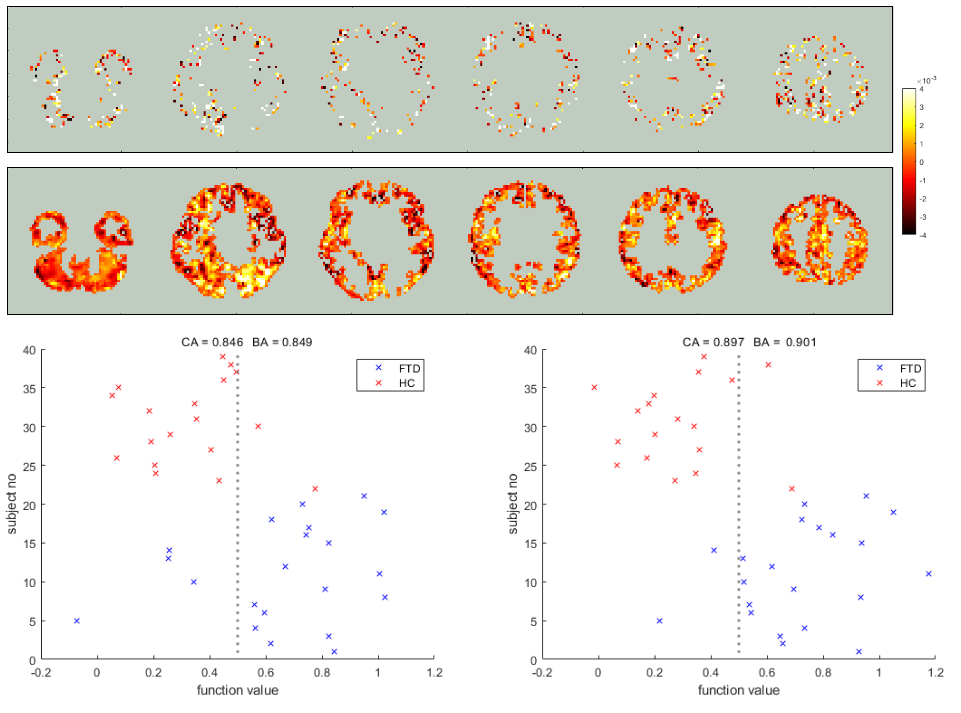
In figure 2, hypoperfusion can be seen in the frontal and temporal lobes as expected, but the spatial pattern of grey matter atrophy is not clear and increases are seen in some areas which appear to be associated with collapsing sulci. Figure 3 shows that CBF changes in FTD were linked to GM atrophy in most voxels, but there was a substantial minority where CBF changes were statistically uncoupled from GM changes, distributed evenly around cerebral regions.Figure 4 shows that not applying PVC results in more accurate classification of FTD using an SVR. Figure 5 shows that training on voxels without statistical concordance with GM atrophy also allowed good accuracy, but combining these selected CBF voxels with partial volume corrected CBF voxels in regions without concordance produced the strongest classifier (BA>90%).
Discussion
It has been shown that in a study of FTD, the CBF maps measured using ASL contained more useful information for distinguishing between patients and controls than GM volume measurements from structural images, according to machine learning analysis.Applying PVC weakened the classification accuracy, which may have been due to kernel smoothing and/or removal of the atrophy signature in the CBF data. Accuracy was still higher without PVC even when only voxels with CBF changes decoupled from GM atrophy were included, which suggests the smoothing effect was primarily responsible for reducing classification accuracy.
The most accurate SVR was trained using data preprocessed using a novel combination of PVC and non-parametric multi-modal voxel concordance analysis, where PVC was only applied to voxels without significant decoupling between CBF and atrophy. This is therefore suggested as a method to minimise the decay in data quality if researchers wish to remove the GM atrophy signature in ASL studies of dementia.
Acknowledgements
No acknowledgement found.References
[1] Alsop DC, Detre JA, Golay X, Günther M, Hendrikse J, Hernandez-Garcia L, Lu H, MacIntosh BJ, Parkes LM, Smits M, van Osch MJ, Wang DJ, Wong EC, Zaharchuk G. Recommended implementation of arterial spin-labeled perfusion MRI for clinical applications: A consensus of the ISMRM perfusion study group and the European consortium for ASL in dementia. Magn Reson Med. 2015 Jan; 73(1): 102–116.
[2] Basak D, Pal S, Ch D, Patranabis R. Support Vector Regression. 2007; Neural Information Processing Letters and Reviews: 203-224.
[3] Bron EE, Steketee RM, Houston GC et al (2014) Diagnostic classification of arterial spin labeling and structural MRI in presenile early stage dementia. Hum Brain Mapp 35:4916–4931
[4] Modat M, Cash DM, Daga P, Winston GP, Duncan JS, Ourselin S. Global image registration using a symmetric block-matching approach. J Med Imaging (Bellingham). 2014;1(2):024003.
[5] Chappell MA, et al. Variational Bayesian Inference for a Nonlinear Forward Model. IEEE TRANSACTIONS ON SIGNAL PROCESSING. 2009;57(1):223–236.
[6] Cardoso 2015: M. Jorge Cardoso, Marc Modat, Robin Wolz, Andrew Melbourne, David Cash, Daniel Rueckert, and Sebastien Ourselin.Geodesic Information Flows: Spatially-Variant Graphs and Their Application to Segmentation and Fusion. IEEE Transactions on Medical Imaging, 34(9), 1976-1988. (2015)
[7] Asllani I, Borogovac A, Brown TR. Regression algorithm correcting for partial volume effects in arterial spin labeling MRI. Magnetic Resonance in Medicine: An Official Journal of the International Society for Magnetic Resonance in Medicine. 2008 Dec;60(6):1362-71.
[8] Shimizu S, Zhang Y, Laxamana J, et al. Concordance and discordance between brain perfusion and atrophy in frontotemporal dementia. Brain Imaging Behav. 2010;4(1):46–54. doi:10.1007/s11682-009-9084-1
[9] Deep Learning Toolbox — Functions. https://uk.mathworks.com/help/deeplearning/referencelist. 1994-2019 The MathWorks, Inc. Retrieved 30/10/2019.
Figures