3268
Machine Learning to Improve Compatibility of Multi Centre Arterial Spin Labelling Data to Characterise Dementia Spatial Perfusion Abnormality1Department of Medical Physics and Biomedical Engineering, University College London, London, United Kingdom, 2Department of Radiology and Nuclear Medicine, Erasmus Medical Centre, Rotterdam, Netherlands, Rotterdam, Netherlands, 3Centre for Clinical Brain Sciences, University of Edinburgh, Edinburgh, United Kingdom, 4Institute of Neurology, University College London, London, United Kingdom, 5Dementia Research Centre, University College London, London, United Kingdom, 6King's College London, London, United Kingdom, 7University College London, London, United Kingdom, 8Neuroradiological Academic Unit, Department of Brain Repair and Rehabilitation, Institute of Neurology,, University College London, London, United Kingdom, 9Wellcome Centre for Human Neuroimaging, Institute of Neurology, University College London, London, United Kingdom
Synopsis
Arterial Spin Labelling (ASL) is a non-invasive MRI method to measure cerebral blood flow (CBF). Here, Support Vector Machine (SVM) based machine learning was used to identify spatial patterns of CBF abnormality in patients with Alzheimer’s Disease from two cohorts scanned at different centers. Support Vector Machine Regression models were found to be more accurate than conventional SVMs previously used for dementia classification. Then, motivated by the lack of ASL standardisation, an SVM based method was used to improve the compatibility of the two studies by removing differences in spatial patterns likely caused by differences in hardware and acquisition protocol.
Introduction
Arterial Spin Labelling (ASL) is a non-invasive MRI method to measure cerebral blood flow (CBF) [1]. Here, Support Vector Machine (SVM) based machine learning [2] was used to identify spatial patterns of CBF abnormality in patients with Alzheimer’s Disease from two cohorts scanned at different centers. Support Vector Machine Regression (SVR) models were compared against more conventional SVMs previously used for dementia classification [3].Following this initial analysis of the two cohorts separately, the possibility of using SVM based methods to improve the compatibility of the two studies was investigated, by identifying and removing differences in spatial patterns between the two control groups which are likely to be caused by differences in the hardware and acquisition protocol. This was motivated by the particular issue of the lack of standardisation of ASL sequences across MR vendors [4].Methods
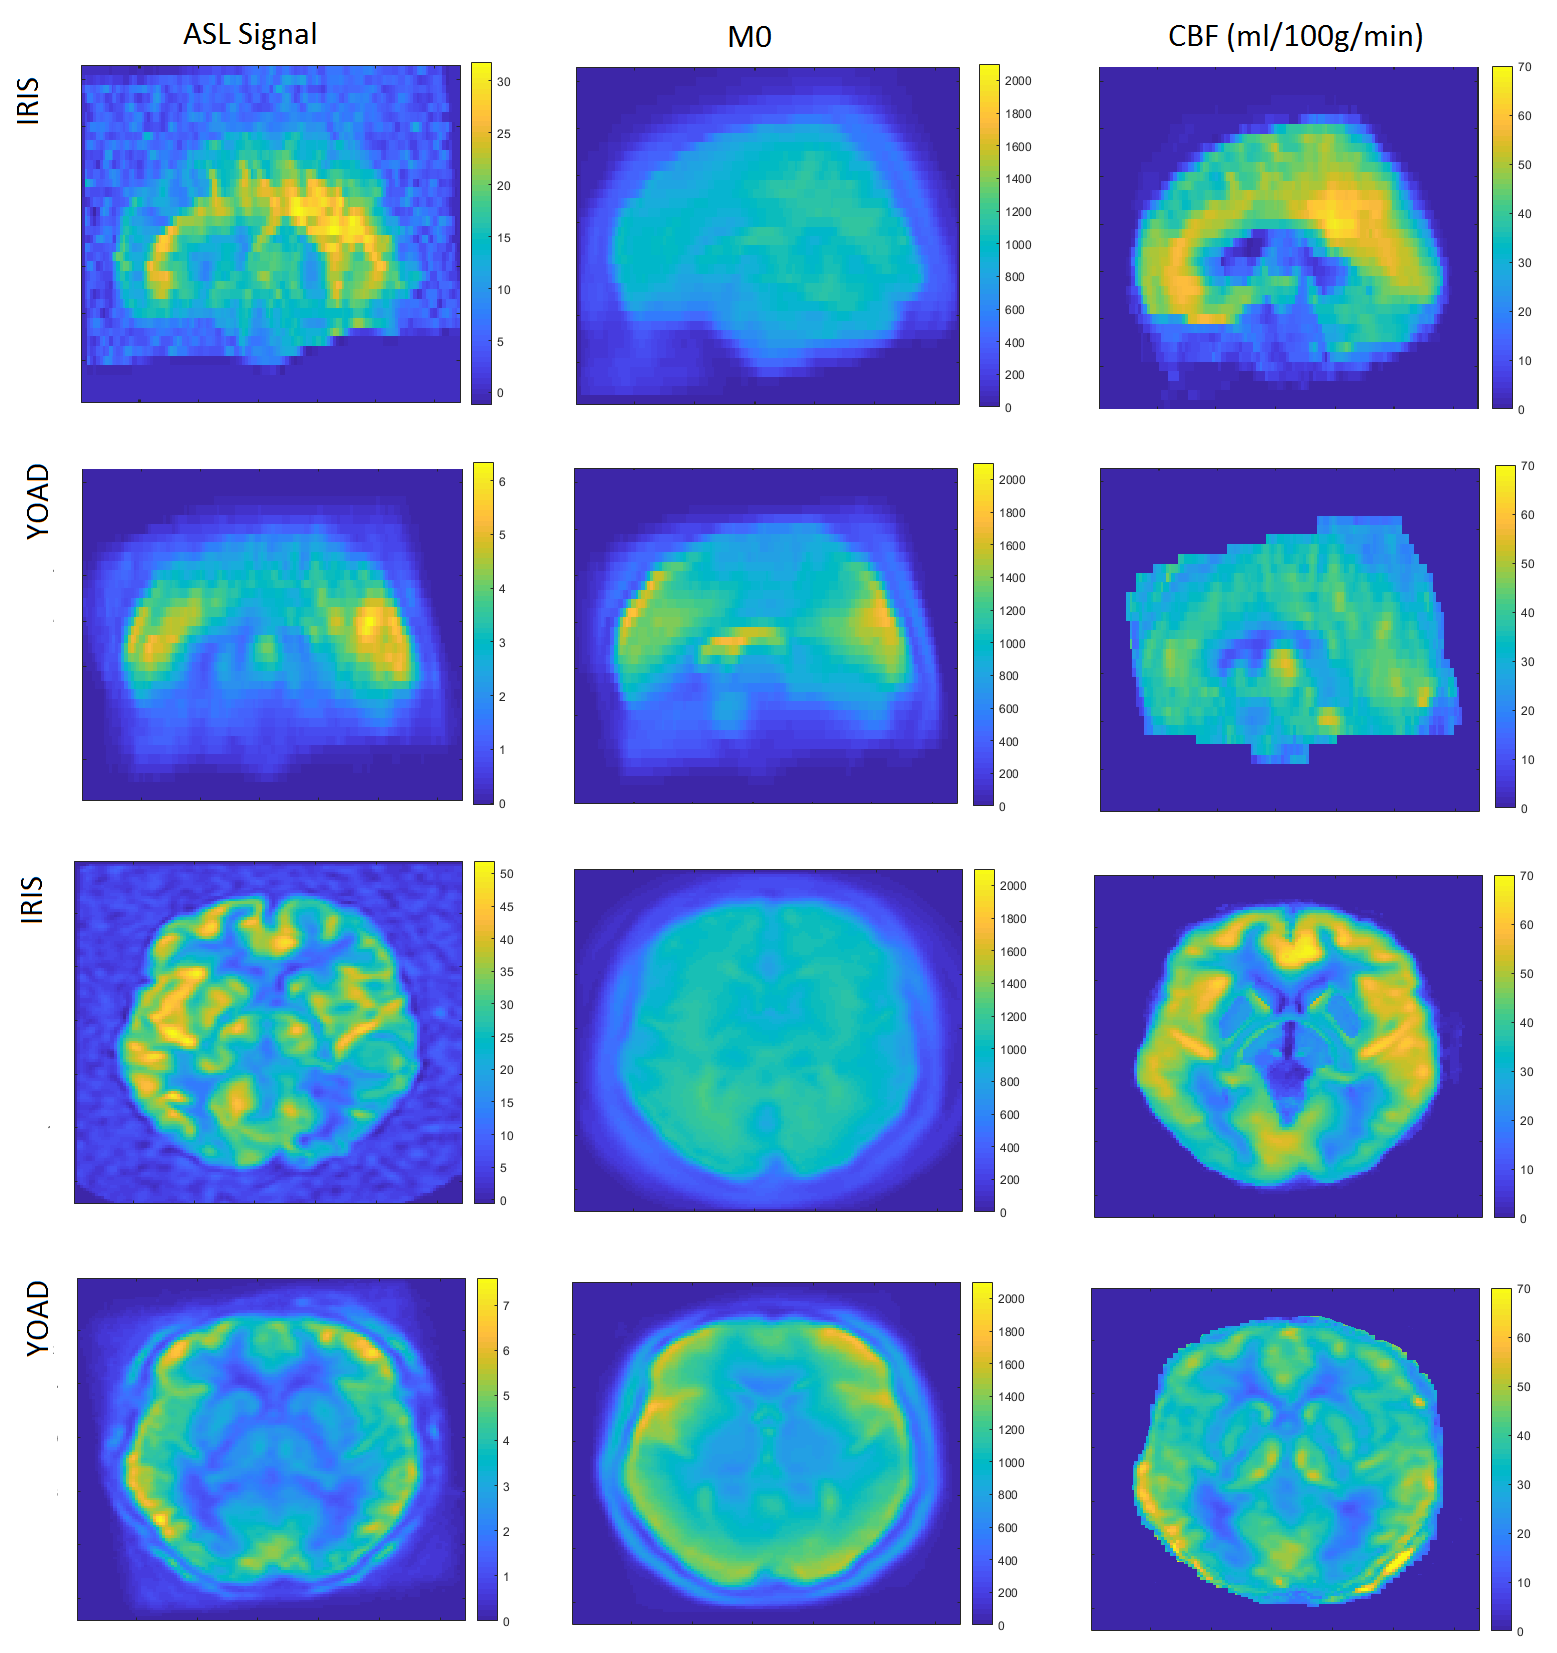
The young onset Alzheimer’s disease (YOAD) cohort (age 51-70) included 22 healthy controls and 23 patients with typical Alzheimer’s disease (AD) scanned on a 3T Siemens Trio (8-shot 3D GRASE, FAIR Q2-TIPS, 3.8×3.8×4.0mm3 before axial interpolation by factor 2, TI 2s, bolus length 0.8s, 5 repeats). Using the same acquisition scheme, saturation recovery (SR) images were acquired with TR of 1, 2 and 5s to fit M0 maps needed for calibration of the ASL data. The Iris cohort (age 51–71) included 18 healthy controls and 12 patients with typical AD scanned on a 3T GE Discovery MR750 (pCASL, 3D stack of spirals readout, 3.75×3.75×4.0mm3 before axial interpolation by factor 2, label duration/post-labelling delay 1.45/1.53s, 5 repeats). M0 images were acquired directly using a long TR stack of spirals readout without labelling. T1 weighted structural images were acquired in YOAD (MPRAGE, 1x1x1mm3, TR 2.2s, TI 0.9s) and Iris (FSPGR, 1x1x1mm3 , TI 0.45S).For each cohort, group-wise registration was performed using NiftyReg [5], and CBF quantification was performed using FSL’s BASIL [6]. After segmentation of 3D T1w data using Geodesic Information Flows (GIF) [7], feature voxels in common space were identified as those with a grey matter fraction >50% in >=90% of the subjects. The MATLAB Deep Learning toolbox [8] was used to train a soft (cluster overlap tolerating) SVM or SVR, using CBF in each selected voxel as its features, to classify the AD cases against healthy controls.
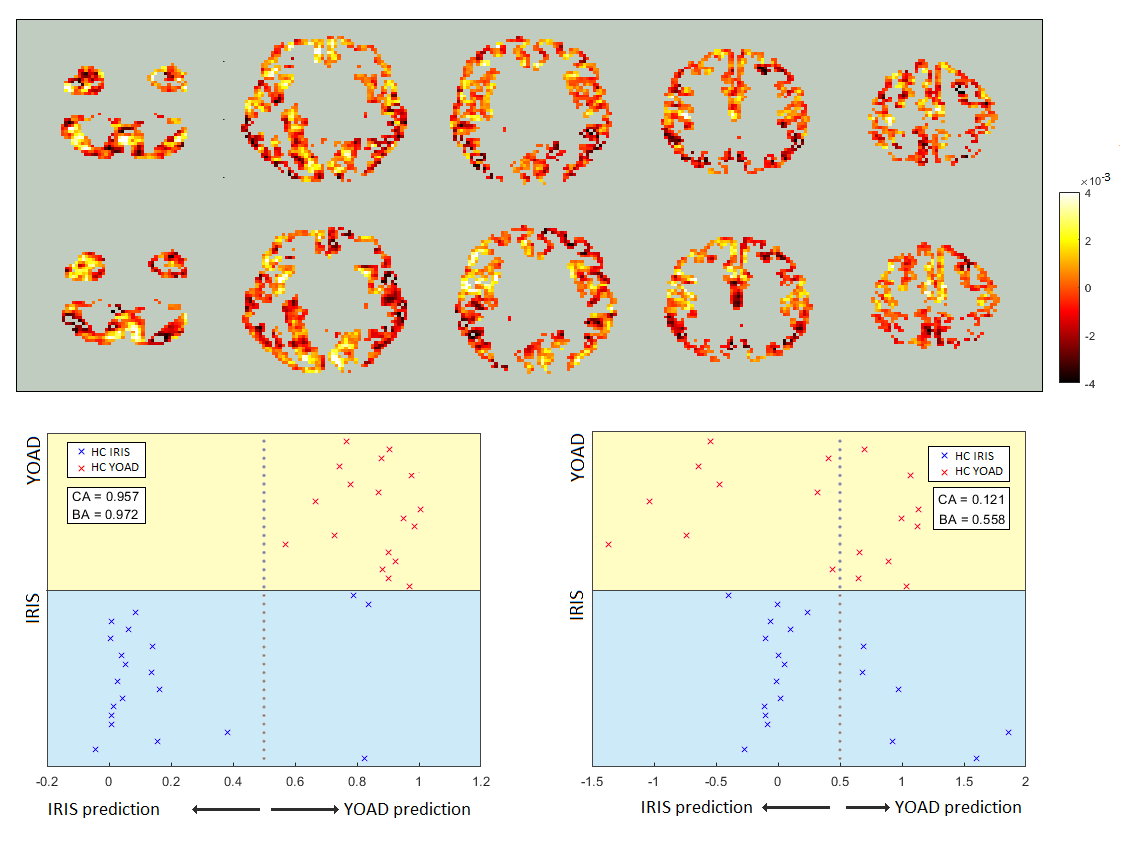
The effect of the different hardware and acquisition protocols on apparent CBF patterns was analysed, by (i) considering discrepancies in the voxelwise mean CBF measured in the control groups of the two studies (Figure 1), and (ii) training a SVR to distinguish between them. The output weights map from the latter was then used to pre-process the data so that discernible differences between the two control groups were minimized (Figure 2). This pre-processed data was then used to train a single SVR to distinguish controls from patients in both cohorts combined.
Results
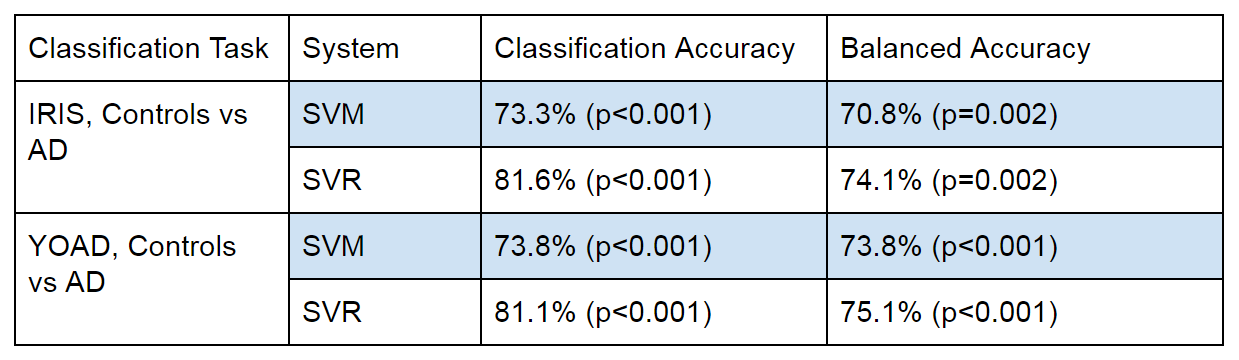
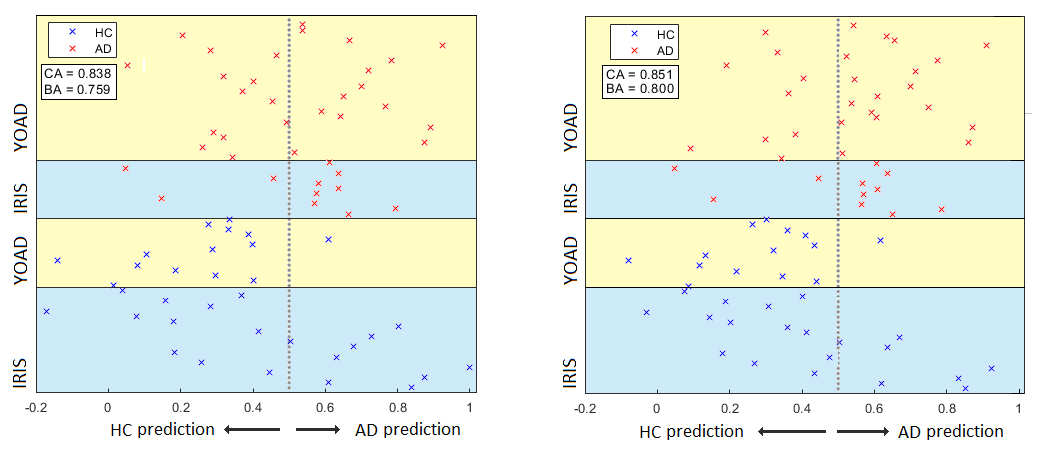
The SVR was able to return slightly better balanced accuracy and better overall classification accuracy than the SVM, when trained to distinguish between controls and AD cases in both the YOAD and Iris studies separately (Table 1). Classification and balanced accuracies were similar for the 2 cohorts.Although qualitatively agreeing on the importance of hypoperfusion in the parietal and occipital lobes, the weights maps from the SVRs visibly differed for the 2 cohorts (Figure 3). When combining the data for a single analysis, the study of origin bias was removed by the feature harmonisation pre-processing (Figure 3). Using the feature space translation parameters generated by this process, the YOAD data (control and AD cases) were transformed to be combinable with the Iris data. This resulted in higher classification and balanced accuracies for the SVR analysis of the combined data set (Figure 4).
Discussion and Conclusions
The potential benefit of Support Vector Machine Regression (SVR) over more conventional classification Support Vector Machines (SVM) for voxelwise machine learning analysis of ASL data has been demonstrated. This may be explained by the different cost function, where SVR minimises the square error in the position of training data in feature space relative to the class predicting hyperplane, whereas SVM only minimise the number of training points incorrectly classified by the hyperplane [2]. The SVR cost function may have performed better because it gives extra weight to the especially strong condition related divergence of local perfusion seen in some subjects.Although the enhancement of the compatibility of the two studies using the SVR feature suppression was modest, the particular problem with the lack of standardisation of ASL protocols between centers [3] means that this data processing approach is of significant interest. Methods involving improved feature selection or cluster analysis will be explored in future work.
Acknowledgements
No acknowledgement found.References
[1] Alsop DC, Detre JA, Golay X, Günther M, Hendrikse J, Hernandez-Garcia L, Lu H, MacIntosh BJ, Parkes LM, Smits M, van Osch MJ, Wang DJ, Wong EC, Zaharchuk G. Recommended implementation of arterial spin-labeled perfusion MRI for clinical applications: A consensus of the ISMRM perfusion study group and the European consortium for ASL in dementia. Magn Reson Med. 2015 Jan; 73(1): 102–116.
[2] Basak D, Pal S, Ch D, Patranabis R. Support Vector Regression. 2007; Neural Information Processing Letters and Reviews: 203-224.
[3] Bron EE, Smits M, Papma JM, et al. Multiparametric computer-aided differential diagnosis of Alzheimer's disease and frontotemporal dementia using structural and advanced MRI. Eur Radiol. 2017;27(8):3372–3382
[4] Wierenga CE, Hays CC, Zlatar ZZ. Cerebral blood flow measured by arterial spin labeling MRI as a preclinical marker of Alzheimer's disease. J Alzheimers Dis. 2014;42 Suppl 4(Suppl 4):S411–S419. doi:10.3233/JAD-141467.
[5] Modat M, Cash DM, Daga P, Winston GP, Duncan JS, Ourselin S. Global image registration using a symmetric block-matching approach. J Med Imaging (Bellingham). 2014;1(2):024003.
[6] Chappell MA, et al. Variational Bayesian Inference for a Nonlinear Forward Model. IEEE TRANSACTIONS ON SIGNAL PROCESSING. 2009;57(1):223–236.
[7] Cardoso 2015: M. Jorge Cardoso, Marc Modat, Robin Wolz, Andrew Melbourne, David Cash, Daniel Rueckert, and Sebastien Ourselin.Geodesic Information Flows: Spatially-Variant Graphs and Their Application to Segmentation and Fusion. IEEE Transactions on Medical Imaging, 34(9), 1976-1988. (2015)
[8] Deep Learning Toolbox — Functions. https://uk.mathworks.com/help/deeplearning/referencelist. 1994-2019 The MathWorks, Inc. Retrieved 30/10/2019.
Figures