3267
ASL perfusion imaging predicts cognitive impairment in cerebral small vessel disease1ISR-Lisboa/LARSyS and Department of Bioengineering, Instituto Superior Técnico – Universidade de Lisboa, Lisboa, Portugal, 2Neurology Department, Hospital Egas Moniz, Centro Hospitalar de Lisboa Ocidental; CEDOC - Nova Medical School, New University of Lisbon, Lisboa, Portugal, 3Faculdade de Medicina, Universidade de Lisboa, Lisboa, Portugal, 4Imaging Department, Hospital da Luz, Lisboa, Portugal
Synopsis
Cerebral small vessel disease (SVD) is one of the most common vascular causes of dementia, and a major contributor of age-related cognitive decline. We evaluated cerebral perfusion using arterial spin labeling (ASL), in terms of its predictive power of cognitive impairment in a group of SVD patients. We employed a multiple-delay pulsed ASL acquisition and fitted an extended kinetic model to the signal in order to derive cerebral blood flow (CBF) as well as bolus arrival time (BAT) maps. Regression analysis demonstrated that CBF in gray matter (GM) significantly contributed to explaining cognitive impairments in processing speed.
Introduction
Cerebral small vessel disease (SVD) encompasses all pathological processes affecting the small vessels of the brain, being a major vascular contributor to dementia and age-related cognitive decline. White matter hyperintensities (WMH) detected on structural MRI are a hallmark of SVD, but they reflect macroscopic lesions secondary to the disease. This has motivated the search for biomarkers that more directly probe vascular integrity, including perfusion, which may be more sensitive to disease progression. To date only a few studies have investigated perfusion measures as potential SVD biomarkers using arterial spin labeling (ASL) MRI, with somehow discordant results1; and the predictive power of cognitive impairment remains to be explored. Here, we investigate the potential of ASL perfusion imaging to provide sensitive biomarkers of SVD, by evaluating their predictive power of cognitive impairment in processing speed tasks2.Methods
17 patients with SVD patients (50 ± 9 yrs) were studied on a 3T Siemens Verio system. Structural images included T1-weigthed MPRAGE (1 mm isotropic) and T2-weighted FLAIR (0.7 × 0.7 × 3.3 mm3). Image segmentation was performed and regions of interest (ROIs) were extracted for gray matter (GM), normal appearing white matter (NAWM), WMH and cerebrospinal fluid (CSF). The normalized brain volume (nBV) and normalized WMH lesion load (nWMHLL) were estimated. ASL data were acquired using a PASL PICORE-Q2TIPS sequence, with 2D multi-slice GE-EPI readout (TR/TE = 2500/11 ms, 28 contiguous slices, 3.5 × 3.5 × 5.0 mm3 resolution). Eleven inversion times (TI) were sampled, between 400 and 2400 ms, in steps of 200 ms, and 8 label/control repetitions were performed for each TI. Q2TIPS saturation limited the labeling bolus width to τ = 750 ms.All data were analyzed using FSL3 and MATLAB. ASL data pre-processing steps included: motion correction; control magnetization averaging at each TI (control time series); control-label magnetization subtraction and averaging at each TI (difference time series); and correction for off-resonance effects caused by imperfect inversion slice profile in 2D multi-slice imaging. Maps of equilibrium magnetization of tissue, M0t, were obtained by fitting a saturation-recovery curve to the control time series. An extended kinetic model with intravascular arterial compartment was fitted to the difference time series using BASIL4, with T1a = 1.65 s, T1t = 1.3 s, τ = 750 ms, in order to estimate cerebral blood flow (CBF) and bolus arrival time (BAT). Calibration was then performed voxelwise, using the equilibrium magnetization of arterial blood (M0a) map obtained by smoothing M0t (FWHM = 10.5 mm) and dividing by the brain average water partition coefficient between blood and tissue, λ=0.9. Both CBF and BAT were averaged across GM and NAWM.
The patients’ cognitive function was evaluated using a battery of neuropsychological tests, including assessment of processing speed using the Trail Making Test - Part A5. The Pearson correlation was computed between the processing speed scores and each of the four perfusion metrics considered (CBF and BAT in GM and NAWM), as well as the following covariates: age, nBV and nWMHLL. Multiple linear regression was performed by best subset regression, using R (https://www.r-project.org/), including the perfusion metrics and covariates.
Results
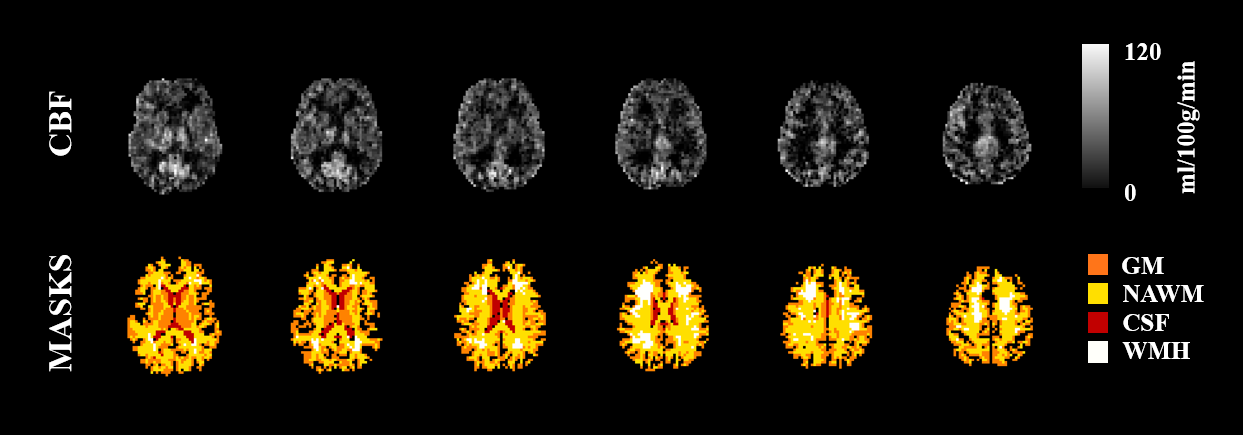
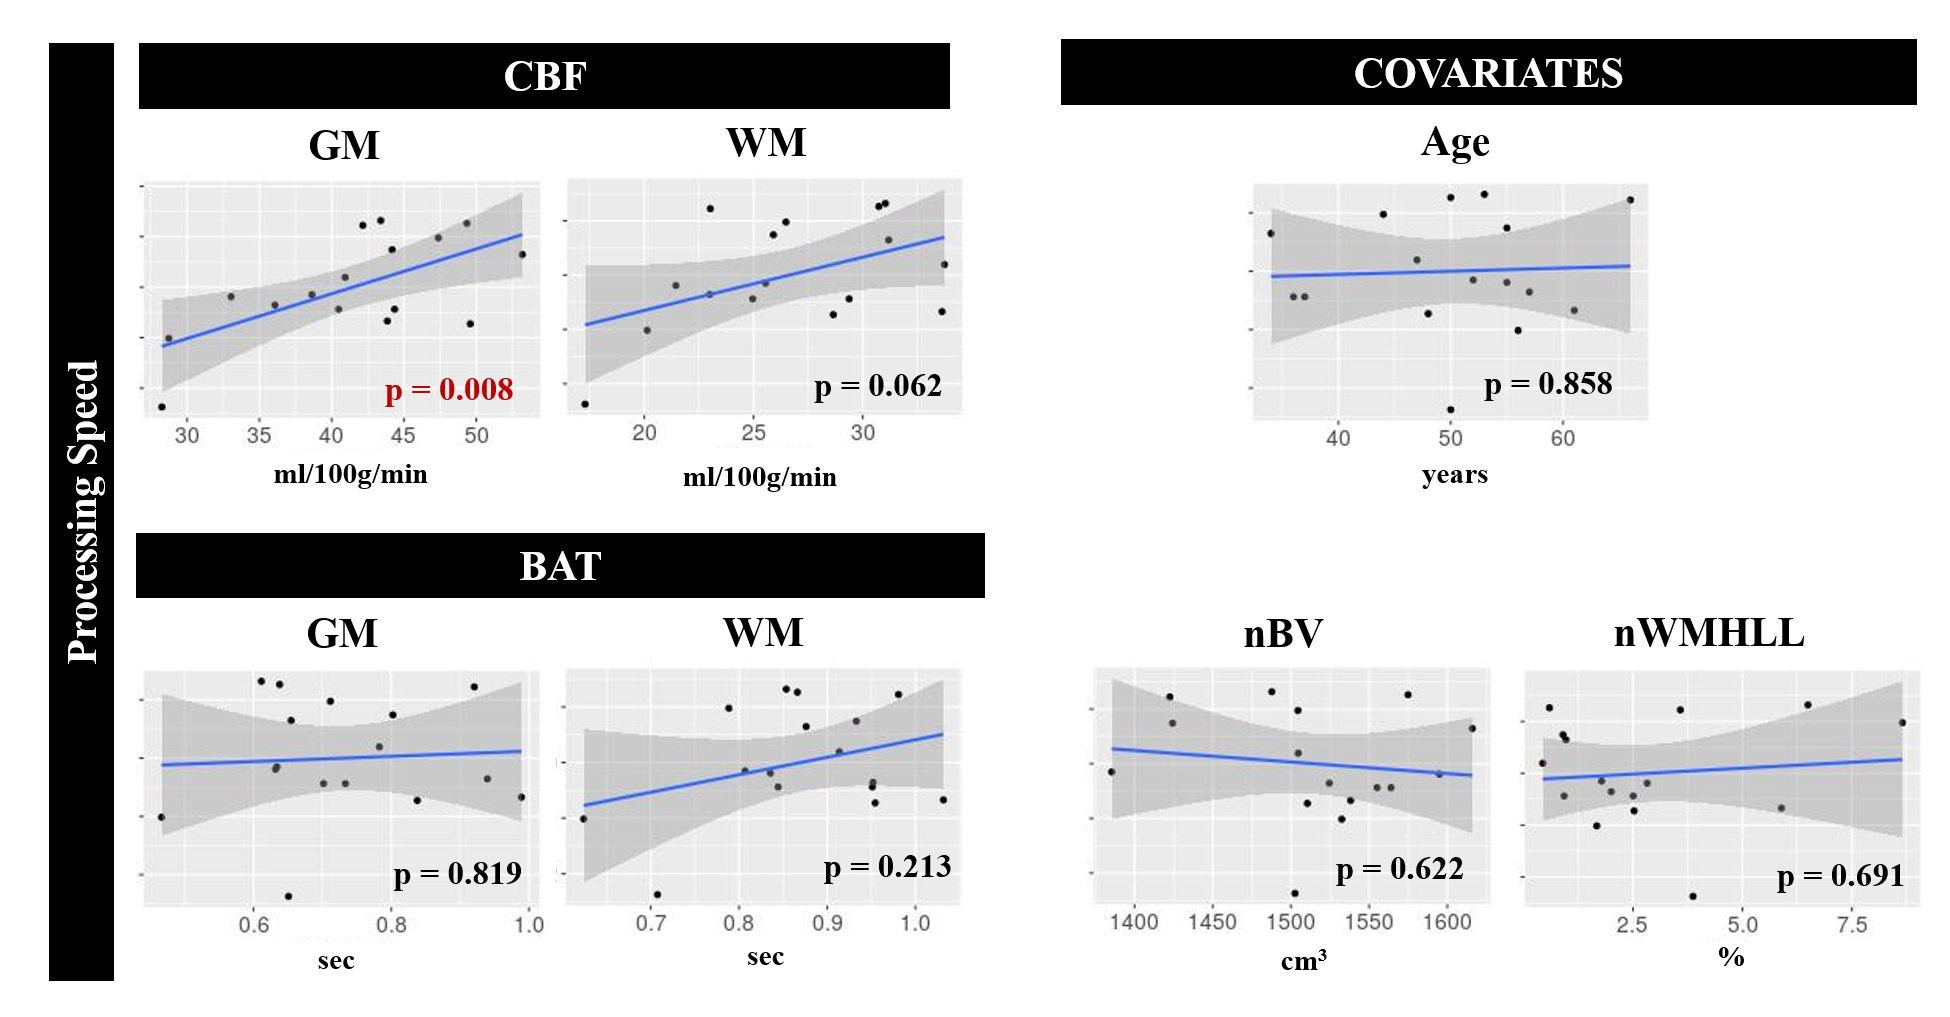
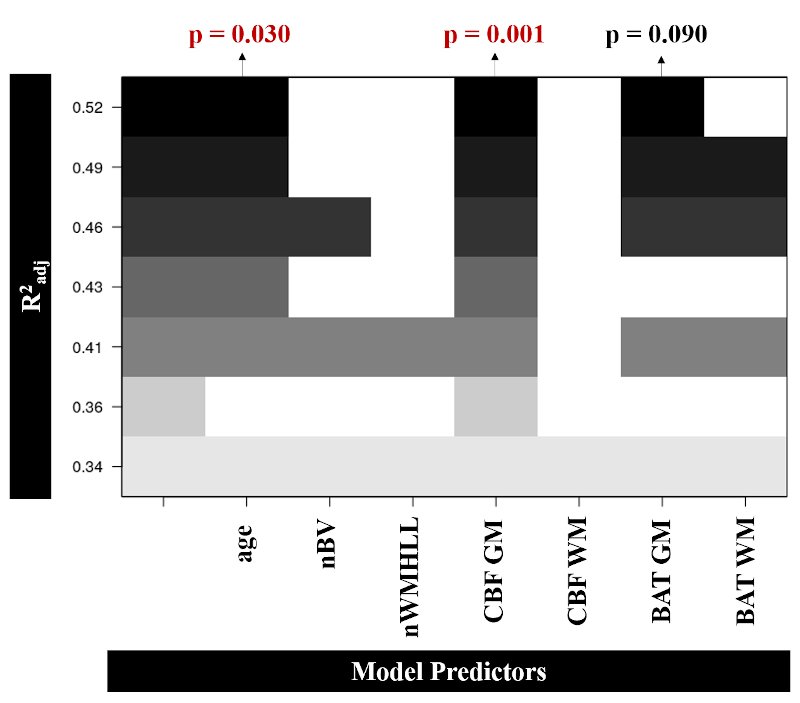
An illustrative example of CBF and BAT maps obtained for one patient is displayed in Fig. 1. The average CBF and BAT in GM/NAWM were 40.4±8.2/25.9±5.5 and 0.74±0.14/0.87±0.10, respectively. Pearson correlation analysis between the processing speed scores and each of the four metrics considered (CBF and BAT in GM and NAWM), as well as the covariates, is shown in Fig. 2. Only CBF in GM was significantly correlated with processing speed scores (p=0.008). Fig. 3 displays the subsets of regressors that best explain the processing speed scores. The best subset model includes as predictors: age (p = 0.030), CBF in GM (p = 0.001), and BAT in GM (p = 0.090). Although only CBF in GM exhibited a significant correlation with processing speed, when considering multiple regression, age and BAT in GM further contribute to explaining the cognitive scores, yielding a total explained variance of ~52%. Nevertheless, CBF in GM is the only regressor that is consistently selected by all subsets.Conclusions
Our results provide the first evidence that CBF measurements obtained by non-invasive ASL perfusion imaging have the potential to predict cognitive decline in SVD, and therefore further support the hypothesis that it may provide sensitive SVD biomarkers. In particular, CBF in GM is significantly correlated with processing speed, the cognitive domain that has more specifically been associated with SVD2. Previous work has reported relationships of other advanced MRI parameters with processing speed in SVD patients, including microstructural changes measured by diffusion-weighted imaging (DWI)6 and arterial pulsatility measured by the amplitude of low frequency fluctuations using resting-state BOLD-fMRI7. Future studies should investigate the relationship between different MRI parameters, namely perfusion, arterial pulsatility and microstructure, among others. Our preliminary results should be expanded by testing larger patient cohorts, and in longitudinal studies, in order to further investigate the potential of ASL to provide SVD biomarkers.Acknowledgements
This work was funded by FCT grants PD/BD/135114/2017, PTDC/BBB-IMG/2137/2012, and UID/EEA/50009/2019.References
1. Shi Y, et al. Cerebral blood flow in small vessel disease: A systematic review and meta-analysis. JCBFM 2016, 36, 1653-1667
2. Baykara E, et al. A Novel Imaging Marker for Small Vessel Disease Based on Skeletonization of White Matter Tracts and Diffusion Histograms. Annals of Neurology 2016, 80, 4, 581-592
3. Jenkinson M, et al. FSL. Neuroimage 2012; 62, 782–790.
4. Chappell MA, et al. Variational Bayesian inference for a non-linear forward model. IEEE Transactions on Signal Processing 2009, 57, 1, 223-236
5. Jouvent E, et al. Longitudinal changes of cortical morphology in CADASIL. Neurobiology of Aging 2012, 33, 5
6. Fouto A, et al. Systematic comparison of DTI metrics as potential biomarkers in cerebral small vessel disease. Proc. of the Joint Annual Meeting ISMRM-ESMRMB 2018, Paris, France
7. Moreira J, et al. Amplitude of low-frequency fluctuations in resting-state BOLD-fMRI is associated with cognitive decline in cerebral small vessel disease. Proc. of the ISMRM 27th Annual Meeting 2019, Montréal, Quebec, Canada
Figures