3265
Dynamic arterial spin labeling MRI of cerebrovascular perfusion during exercise1Human Movement Sciences, Vrije Universiteit van Amsterdam, Amsterdam, Netherlands, 2Radiology and Nuclear Medicine, Amsterdam UMC, Amsterdam, Netherlands
Synopsis
Pathophysiological changes in cerebrovascular reactivity can remain undetectable at rest, and may only become apparent during a cerebrovascular challenge. We evaluated the feasibility of dynamically measuring the cerebrovascular response to exercise using pseudo-continuous arterial spin labeling (pCASL) at 3 Tesla during a bicycle exercise-recovery stress test. We observed a transient increase in cerebrovascular blood flow (CBF) during exercise in four volunteers, demonstrating that pCASL-MRI can capture dynamic changes in CBF during physiological bicycle exercise. This approach may become an important quantitative tool to noninvasively investigate the cerebrovascular reactivity in health and disease.
Purpose
A reduced cerebrovascular reactivity has been linked to cognitive decline found in aging and type 2 diabetes. Any hemodynamic changes can remain undetectable at rest, and may only become apparent during a cerebrovascular challenge. Spatial maps of the cerebrovascular reactivity upon hypercapnia or a pharmacological vasodilator challenge can be obtained with MRI, using pseudo-continuous arterial spin labeling (pCASL).1 However, such artificially-induced vasodilation does not reflect daily life physiology. Instead, aerobic exercise can be used as a physiological stress challenge. Here, we evaluated the feasibility of dynamically measuring the cerebrovascular response to exercise using pCASL-MRI at 3 Tesla during a bicycle exercise-recovery stress test.Methods
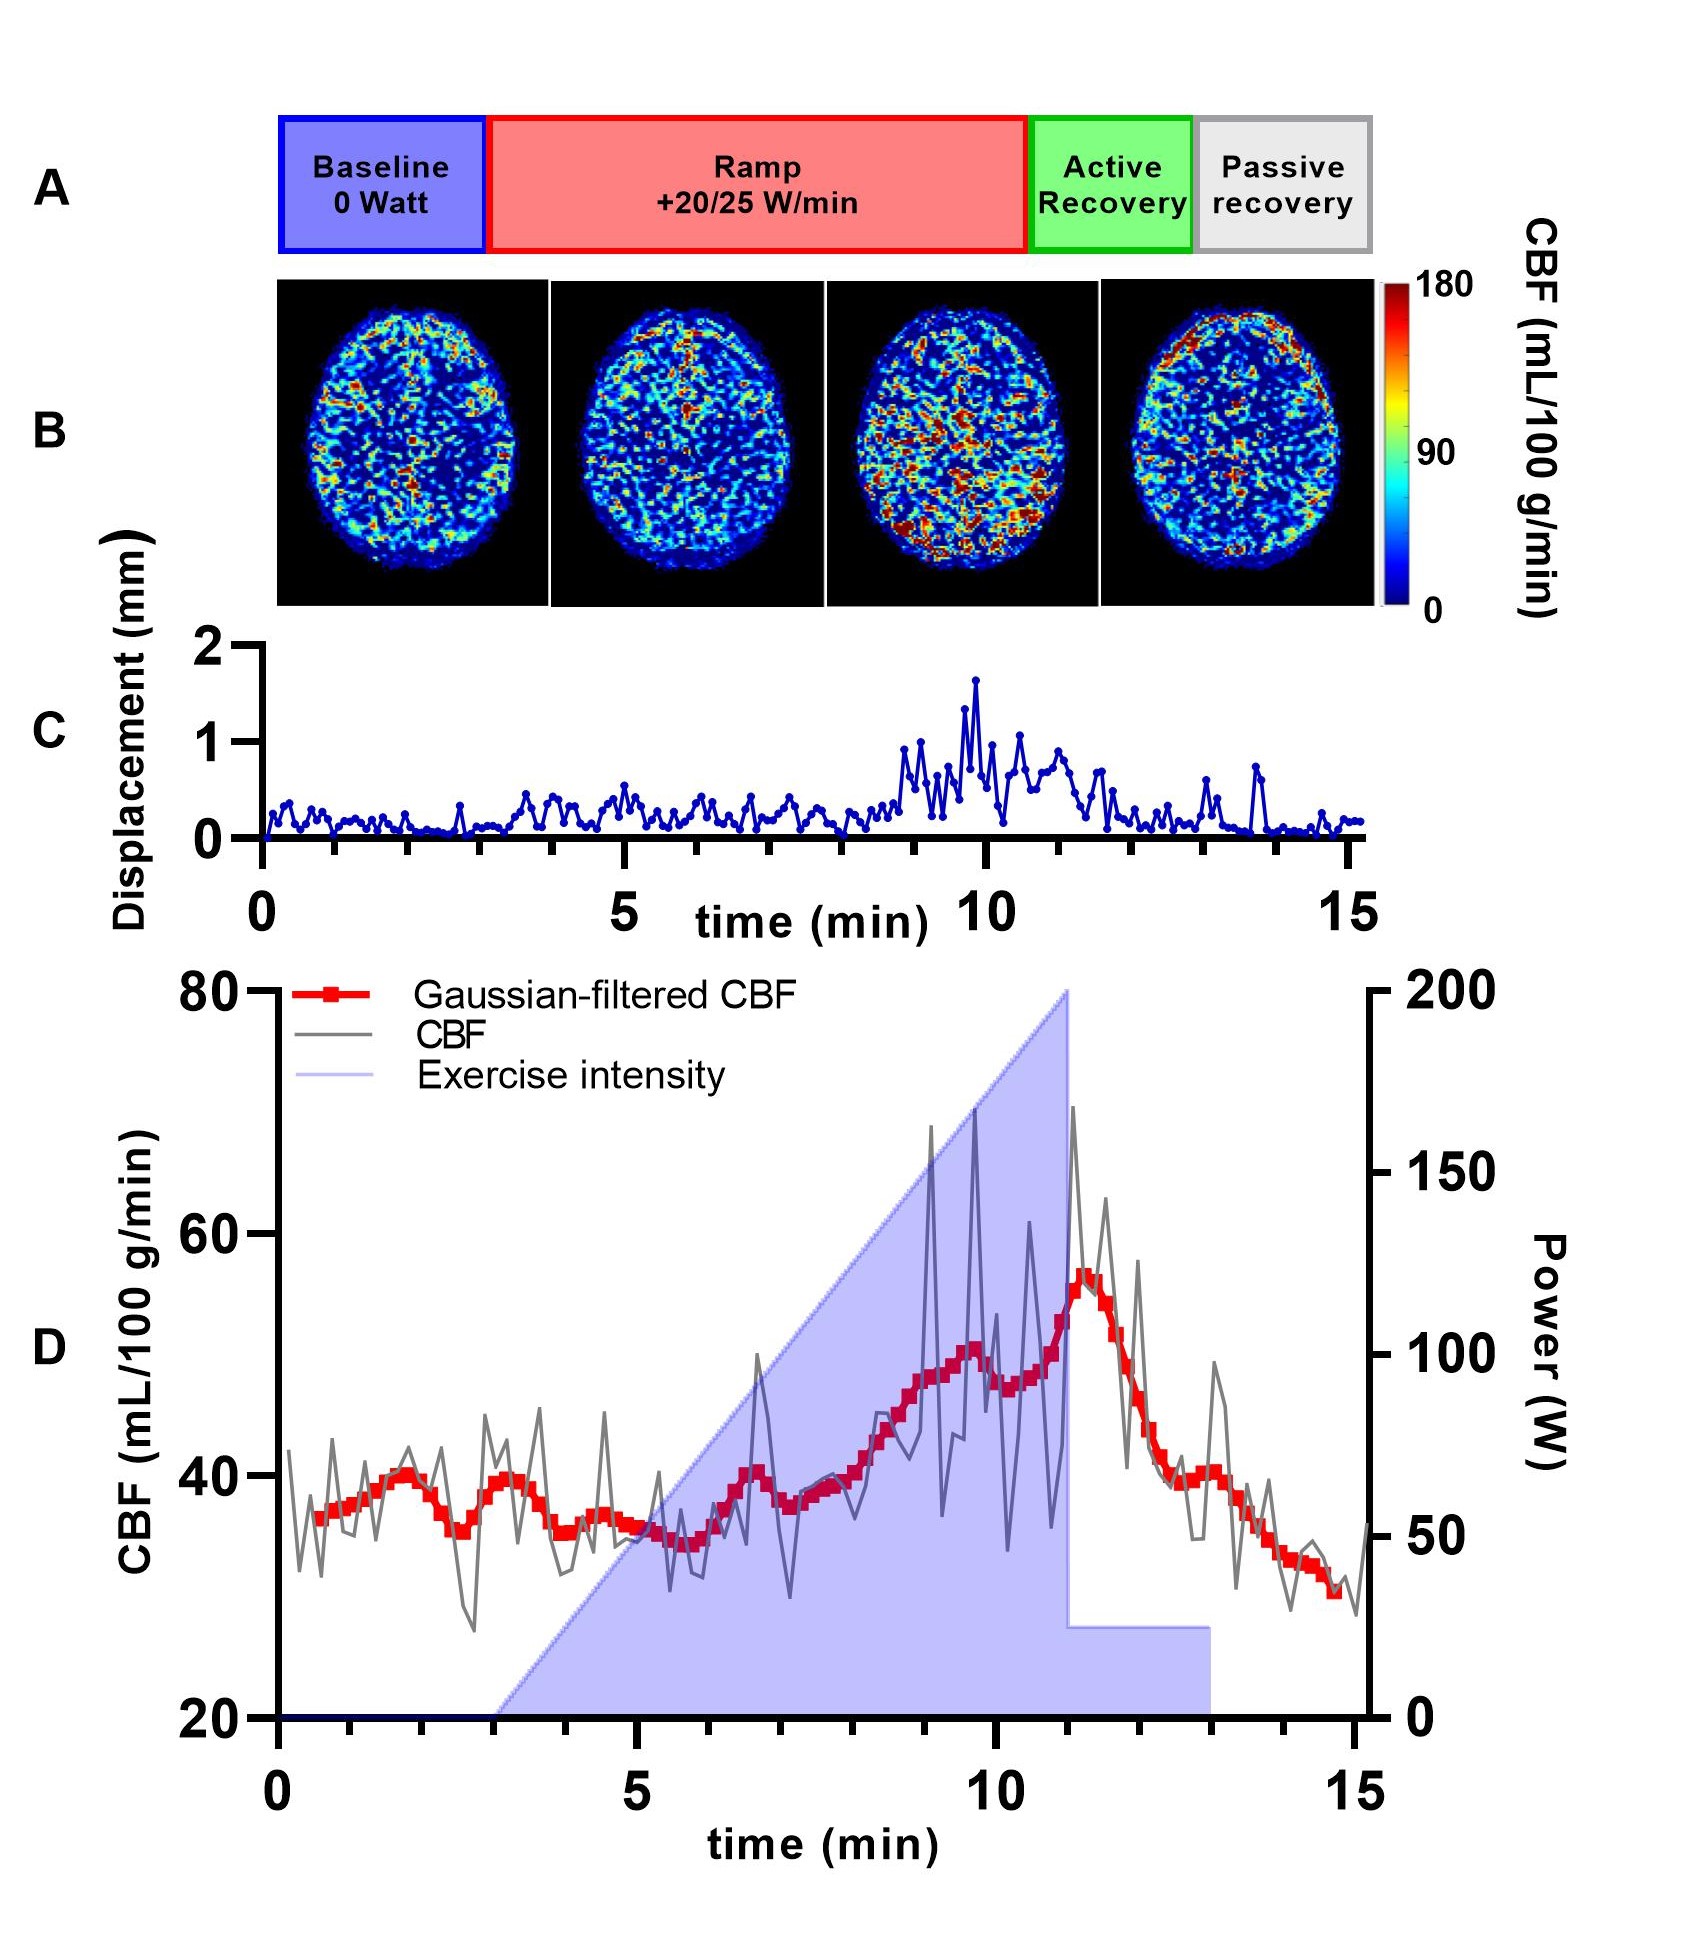
Exercise protocol - Four volunteers (2/2 male/female; age 23.5 ± 1.5 years; BMI 22.8 ± 1.3 kg/m2) were scanned during incremental exercise on an MR-compatible bicycle ergometer (Lode BV, Groningen, The Netherlands). The 15-minute exercise-recovery protocol (Figure 1a) consisted of 1) three minutes unloaded bicycling exercise, followed by 2) up to 8 minutes of loaded exercise with gradual increments of 20 (female) or 25 (male) W/min until exhaustion, 3) two minutes of cycling at 25 W for active recovery, and 4) two minutes of rest for passive recovery. The participants were guided to maintain a cycling rate of 60-70 RPM. To reduce motion, the participant’s head was fixated with small foam cushions.MR measurements - Imaging was performed on a 3 Tesla MR system (Ingenia; Philips, Best, The Netherlands) using a 32-channel transmit-receive head coil. Throughout the exercise session, the cerebrovascular blood flow (CBF) was measured dynamically using pCASL with a 2D EPI readout.2 Label duration and post-label delay were 1800 ms, and two background suppressions were used. pCASL imaging parameters were: TR/TE 4550/16 ms, voxel size 2.75/2.75 mm, number of slices 16, slice thickness 5 mm. A total of 100 control/label pairs were acquired over 15 minutes. Post-processing was performed using the ExploreASL toolbox,3 individually quantifying each control/label image pair.4 Motion correction was performed by registering consecutive images using statistical parametric mapping (SPM12; Functional Imaging Laboratory, UK) using rigid-body rotation and translation, before voxel-wise calculation of tissue perfusion. Control/label pairs were excluded using a similar method as described by Shirzadi et al.5 The ExploreASL implementation employs the median gray matter voxel-wise temporal SNR (tSNR) as the criterion for signal stability,6 regularized by an empirically-defined minimum tSNR improvement of 5%. Whole brain (WB) CBF [mL/100 g tissue/min] was calculated based on an anatomical T1-weighted reference scan. The CBF was then plotted against time, and a Gaussian filter (width 10 time points) was applied to smoothen the WB CBF time curve.
Results
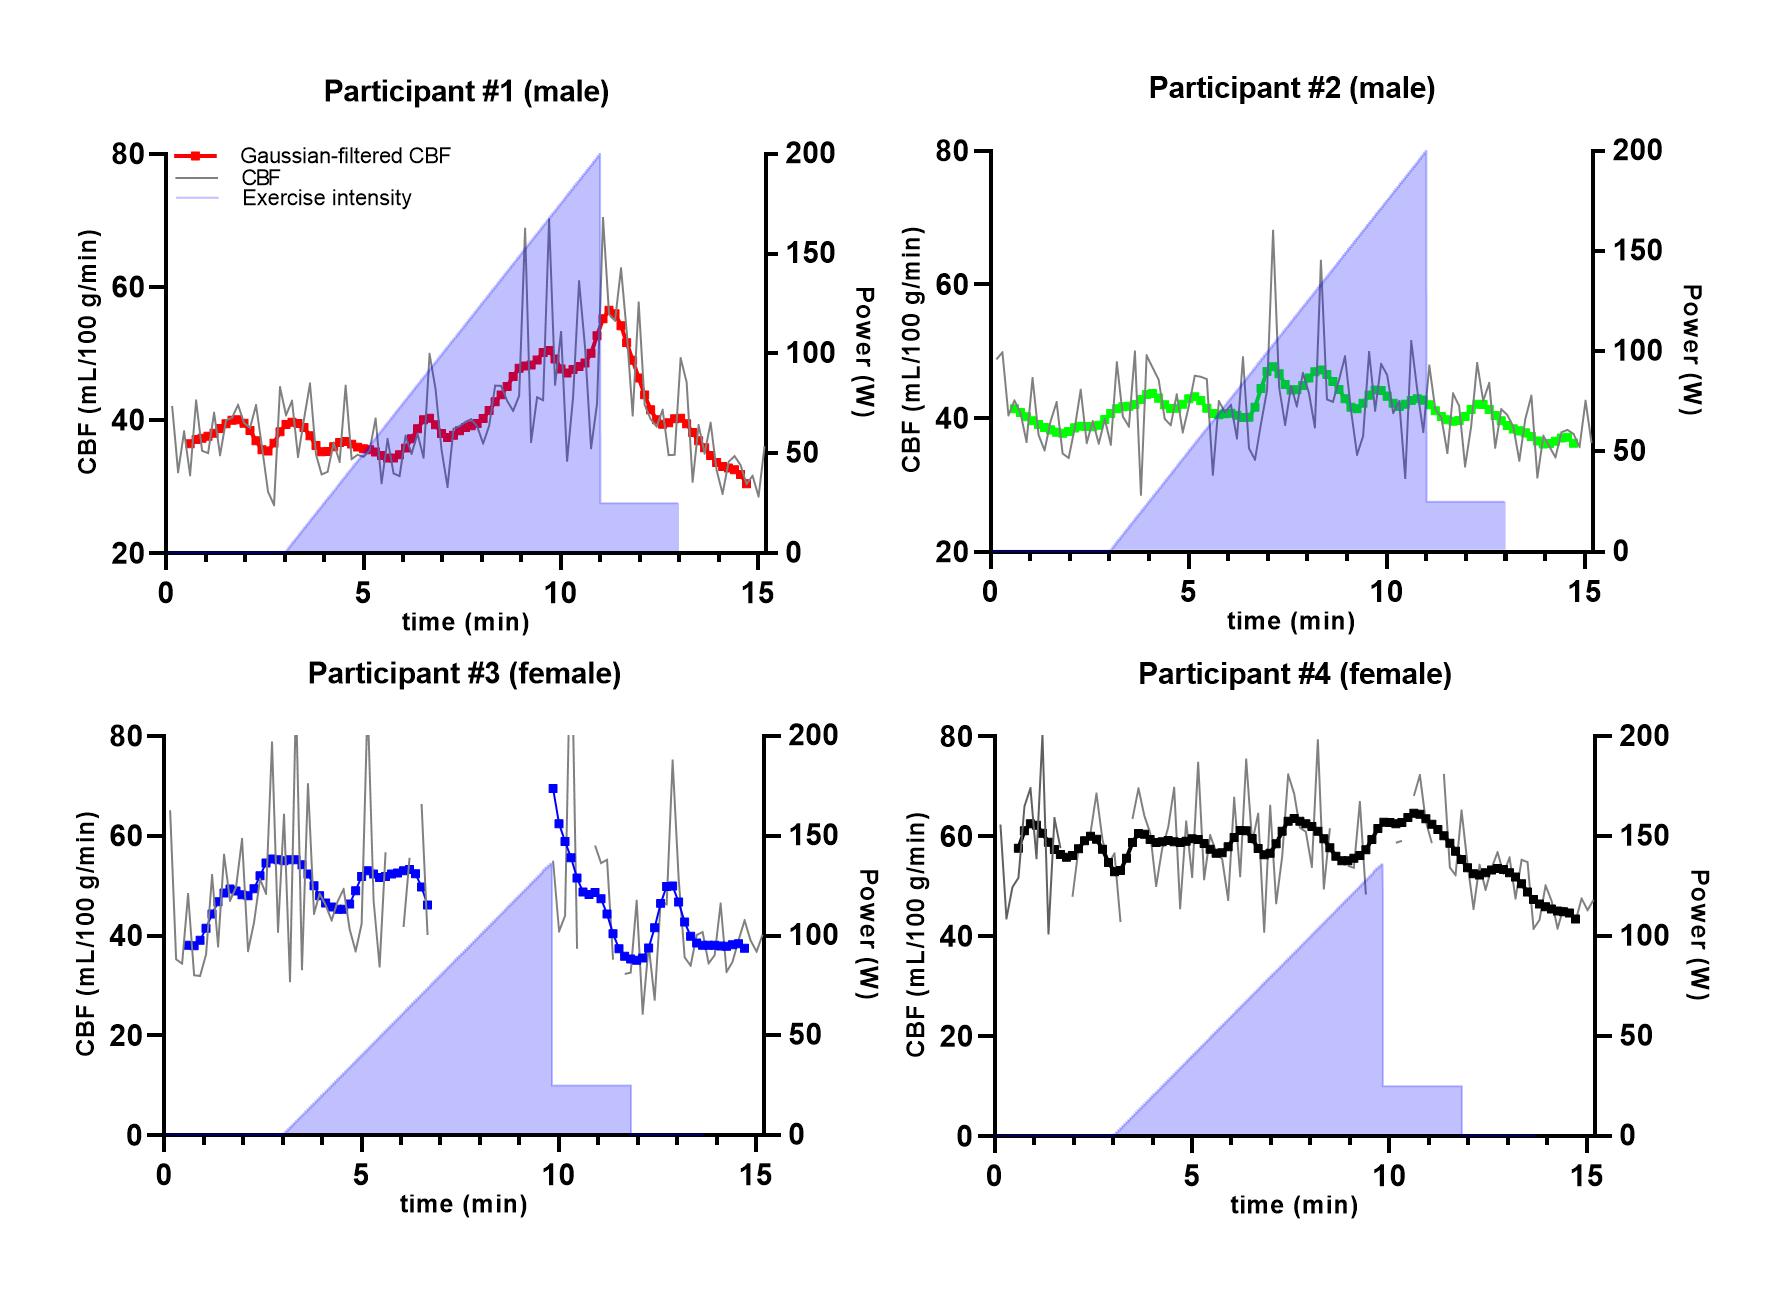
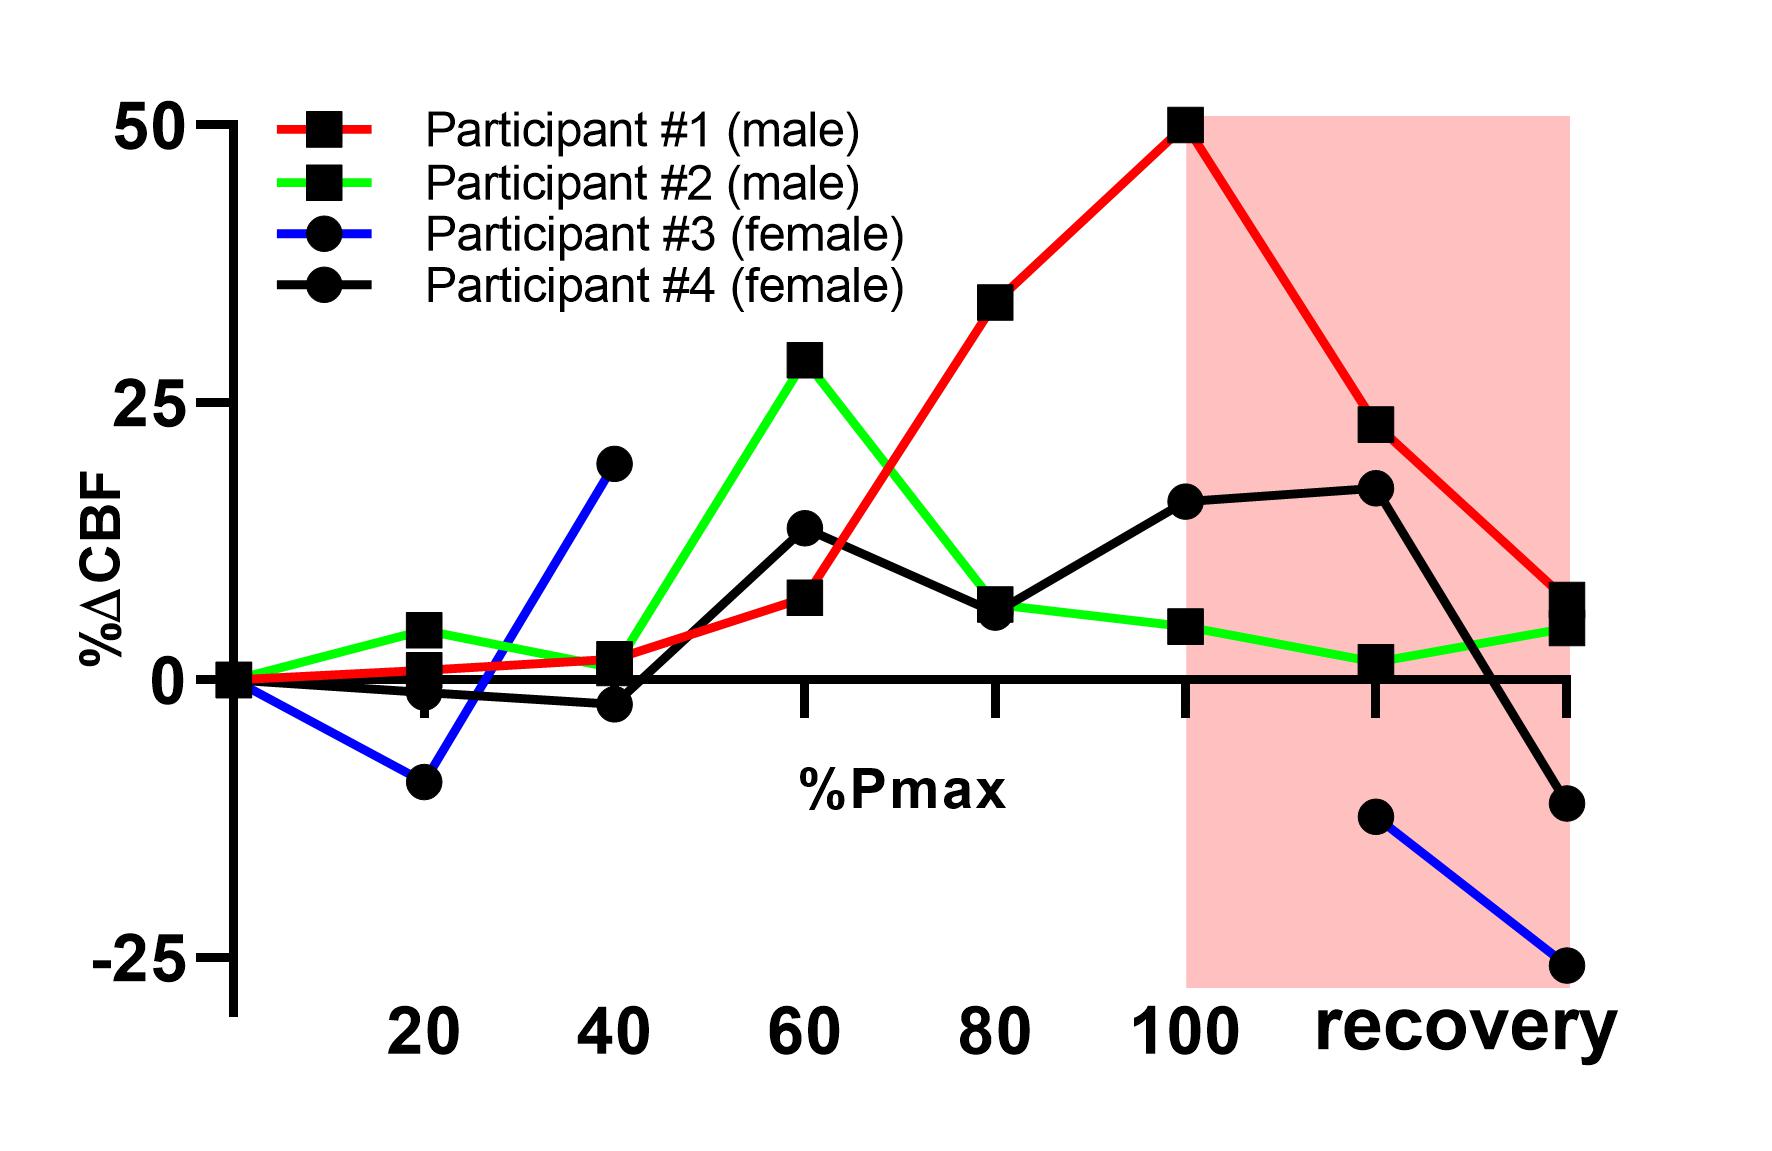
Data of a representative measurement are displayed in Figure 1. Individual control/label-quantified pCASL-MR images (Figure 1b) revealed an increase in CBF during exercise. This effect was also visible in the CBF measurements over time (Figure 1d), showing a pronounced increase in WB CBF at maximal exercise intensity and a subsequent decrease during recovery. Although the exercise-induced changes in WB CBF were rather heterogeneous across volunteers (Figure 2), we observed a transient increase in CBF during exercise in all participants. In Figure 1c, the displacement relative to the first frame is plotted over time during the different exercise stages. In two of the four participants, 25 and 10 control/label pairs were excluded due to excessive motion. Relative differences compared to baseline WB CBF (mean of 3 minutes unloaded cycling) are shown in Figure 3. An increase of at least 10% in WB CBF was observed in all participants after reaching 60% of their achieved maximum power.Discussion
We performed pCASL measurements of the CBF during incremental exercise in four volunteers. Although some control/label pairs were affected by displacements of the head, particularly during high-intensity exercise, motion distortions generally appeared to be well-solved by motion correction through image registration. With observed WB CBF changes of >50% (Figure 3), we believe that these changes are indeed a physiological response to exercise, and not just resting-state fluctuations in the ASL signal.7 Standardization of the exercise protocol, tailored to individual participant characteristics, as well as measurements in a larger cohort of volunteers are needed to establish reference values for pCASL-MRI of the cerebrovascular response to exercise.Conclusion
Our pilot experiments demonstrate that pCASL-MRI can detect dynamic changes in CBF during a bicycle exercise stress test inside a 3 Tesla MR system. This physiological stress test may become a valuable, quantitative tool for noninvasive investigations of the cerebrovascular reactivity in health and disease.Acknowledgements
The purchase of the MR-compatible ergometer was supported by an Amsterdam Movement Sciences Innovation Grant 2017.References
1. Václavů L, Meynart BN, Mutsaerts HJ, Petersen ET, Majoie CB, VanBavel ET, Wood JC, Nederveen AJ, Biemond BJ. Hemodynamic provocation with acetazolamide shows impaired cerebrovascular reserve in adults with sickle cell disease. Haematologica. 2019 Apr 1;104(4):690-9.
2. van Osch MJ, Teeuwisse WM, Chen Z, Suzuki Y, Helle M, Schmid S. Advances in arterial spin labelling MRI methods for measuring perfusion and collateral flow. Journal of Cerebral Blood Flow & Metabolism. 2018 Sep;38(9):1461-80.
3. Mutsaerts HJ, Petr J, Thomas DL, De Vita E, Cash DM, van Osch MJ, Golay X, Groot PF, Ourselin S, van Swieten J, Laforce Jr R. Comparison of arterial spin labeling registration strategies in the multi‐center GENetic frontotemporal dementia initiative (GENFI). Journal of Magnetic Resonance Imaging. 2018 Jan;47(1):131-40.
4. Alsop DC, Detre JA, Golay X, Günther M, Hendrikse J, Hernandez‐Garcia L, Lu H, MacIntosh BJ, Parkes LM, Smits M, van Osch MJ. Recommended implementation of arterial spin‐labeled perfusion MRI for clinical applications: a consensus of the ISMRM perfusion study group and the European consortium for ASL in dementia. Magnetic Resonance in Medicine. 2015 Jan;73(1):102-16.
5. Shirzadi Z, Crane DE, Robertson AD, Maralani PJ, Aviv RI, Chappell MA, Goldstein BI, Black SE, MacIntosh BJ. Automated removal of spurious intermediate cerebral blood flow volumes improves image quality among older patients: a clinical arterial spin labeling investigation. Journal of Magnetic Resonance Imaging. 2015 Nov;42(5):1377-85.
6. Shirzadi Z, Stefanovic B, Chappell MA, Ramirez J, Schwindt G, Masellis M, Black SE, MacIntosh BJ. Enhancement of automated blood flow estimates (ENABLE) from arterial spin‐labeled MRI. Journal of Magnetic Resonance Imaging. 2018 Mar;47(3):647-55.
7. Gevers S, van Osch MJ, Bokkers RP, Kies DA, Teeuwisse WM, Majoie CB, Hendrikse J, Nederveen AJ. Intra-and multicenter reproducibility of pulsed, continuous and pseudo-continuous arterial spin labeling methods for measuring cerebral perfusion. Journal of Cerebral Blood Flow & Metabolism. 2011 Aug;31(8):1706-15.
Figures