3264
Optimization of Pseudo Continuous Arterial Spin Labeling for measuring perfusion in CKD patients1Radiology, Clinica Universidad de Navarra, Pamplona, Spain, 2Siemens Healthineers, Madrid, Spain, 3Nephrology, Clinica Universidad de Navarra, Pamplona, Spain
Synopsis
The main goal of this work was to optimize the robustness of pseudo continuous Arterial Spin Labeling (pCASL) to acquire renal images in CKD patients. The optimization was firstly carried out through numerical simulations, and a pCASL experiment in healhty volunteers to assess the veracity of the simulations. The results were in agreeement with the simulations (p-value = 0.04). For CKD patients, the numerical simulations were made to select the parameters that maximize the efficiency. The results for CKD patients and controls that show highest efficiencies are ratios 6-7 and Gave of 0.5-0.7 mT/m.
Introduction
Arterial Spin Labeling (ASL)1 is a non-invasive and non-contrast MR imaging technique which allows the quantification of renal blood flow (RBF). ASL has been used to measure tissue perfusion in the kidneys in patients with Chronic Kidney Disease (CKD), in which the renal function may be affected, showing a reduced RBF2,3.Pseudo-continuous ASL4-5 (pCASL), is the recommended labeling strategy in brain ASL6, as it provides higher SNR and a more controlled duration of the inverted bolus. However, pCASL might suffer from efficiency losses due to magnetic field variations at the labeling plane, in addition to being sensitive to pulsatile blood flows with high velocities7-10.
The main goal of this work was to improve the robustness of pCASL to measure RBF and detect dysfunctional changes in CKD patients.
The optimization procedure was divided in two sections, in the first one, pCASL labeling efficiency was optimized for young and healthy volunteers considering renal conditions9, employing numerical simulations and testing the results in an in-vivo experiment to assess the validity of the simulations, and in the second one, a study with CKD patients and age-matched controls was performed to select the pCASL parameters that can yield higher efficiencies.
Materials and Methods
All participants were scanned in a 3T Skyra system (Siemens, Erlangen, Germany), using an 18-channel body coil, after signing a written informed consent.Numerical Simulations validation
Blood Flow Characterization
Aortic blood flow was characterized in the same position as the labeling plane was located9, using a phase-contrast PC sequence (Fig. 1 c) in 15 volunteers (age=29±4y). Blood flow profiles were calculated and averaged after matching the systolic peaks across the volunteers. These data were used to compute the blood flow contribution of each velocity for spins traversing the labeling plane for the total duration of a complete cardiac cycle (Fig 2. a-b).
Numerical Simulation
Bloch equations were numerically integrated11 to compute the inversion efficiency over a wide range of pCASL parameters (Fig. 1 a) for spins flowing with the velocities previously measured and assuming field inhomogeneities, with off-resonance frequencies7-9 between 0 and 500 Hz. Longitudinal magnetization was measured at 250 ms after crossing the center of the labeling plane, corrected for T1 decay and used to compute inversion efficiency for each velocity. The overall inversion efficiency was obtained taking into account the blood flow contribution of each velocity and across off-resonance frequencies. Efficiency maps were computed.
In vivo ASL Experiment
Six healthy volunteers (age=31±8y) were scanned to test the results of the simulations. Eight unbalanced pCASL configurations were assessed resulting from the combination of four average gradients (Gave) (0.4, 0.6, 0.8, 1.0 [mT/m]) and two ratios (R=Gmax/Gave) (7, 10), with identical readout parameters (Fig. 1 b).
Images were registered using ANTS12, outliers were discarded and the mean signal was calculated in a bilateral ROI including the kidneys for each volunteer and pCASL configuration. A two-way analysis of variance (ANOVA) was performed to test if there were significant differences in perfusion signal across pCASL parameters.
pCASL Optimization for CKD Patients
Blood Flow Characterization and Numerical Simulation
Aortic flow was measured in 5 CKD patients stage 3-4 (age=78.6±6.6y) and 6 aged matched healthy controls (age=75±3.9y). Blood flow measurements were analyzed as previously described in young volunteers.
Numerical simulations were used to evaluate the pCASL efficiency for the blood flow measured in CKD patients and age-matched controls under off-resonance conditions. Efficiency maps were computed to select those pCASL parameters which maximized the efficiency.
Results
Numerical Simulations validationVelocity profiles in healthy volunteers are shown in (Fig. 2 a), in which peak velocities of 124 cm/s are reached in systole. Fig. 2 b shows the normalized contribution of each velocity to the total flow traversing the labeling plane. Efficiency maps for on-resonance (Fig. 2 c) and off-resonance (Fig. 2 d), show that the highest efficiencies are achieved for Gave values of 0.3-0.5 mT/m. On-resonance, the highest ratio yields the highest efficiency, however to obtain a high efficiency in presence of field inhomogeneities the ratio has to be reduced.
Perfusion maps in one volunteer are shown in Fig. 4 a, and Fig. 4 b, shows the averaged group results. These results are in agreement with the simulations. ANOVA showed significant differences across Gave values (p-value =0.04).
pCASL Optimization for CKD Patients
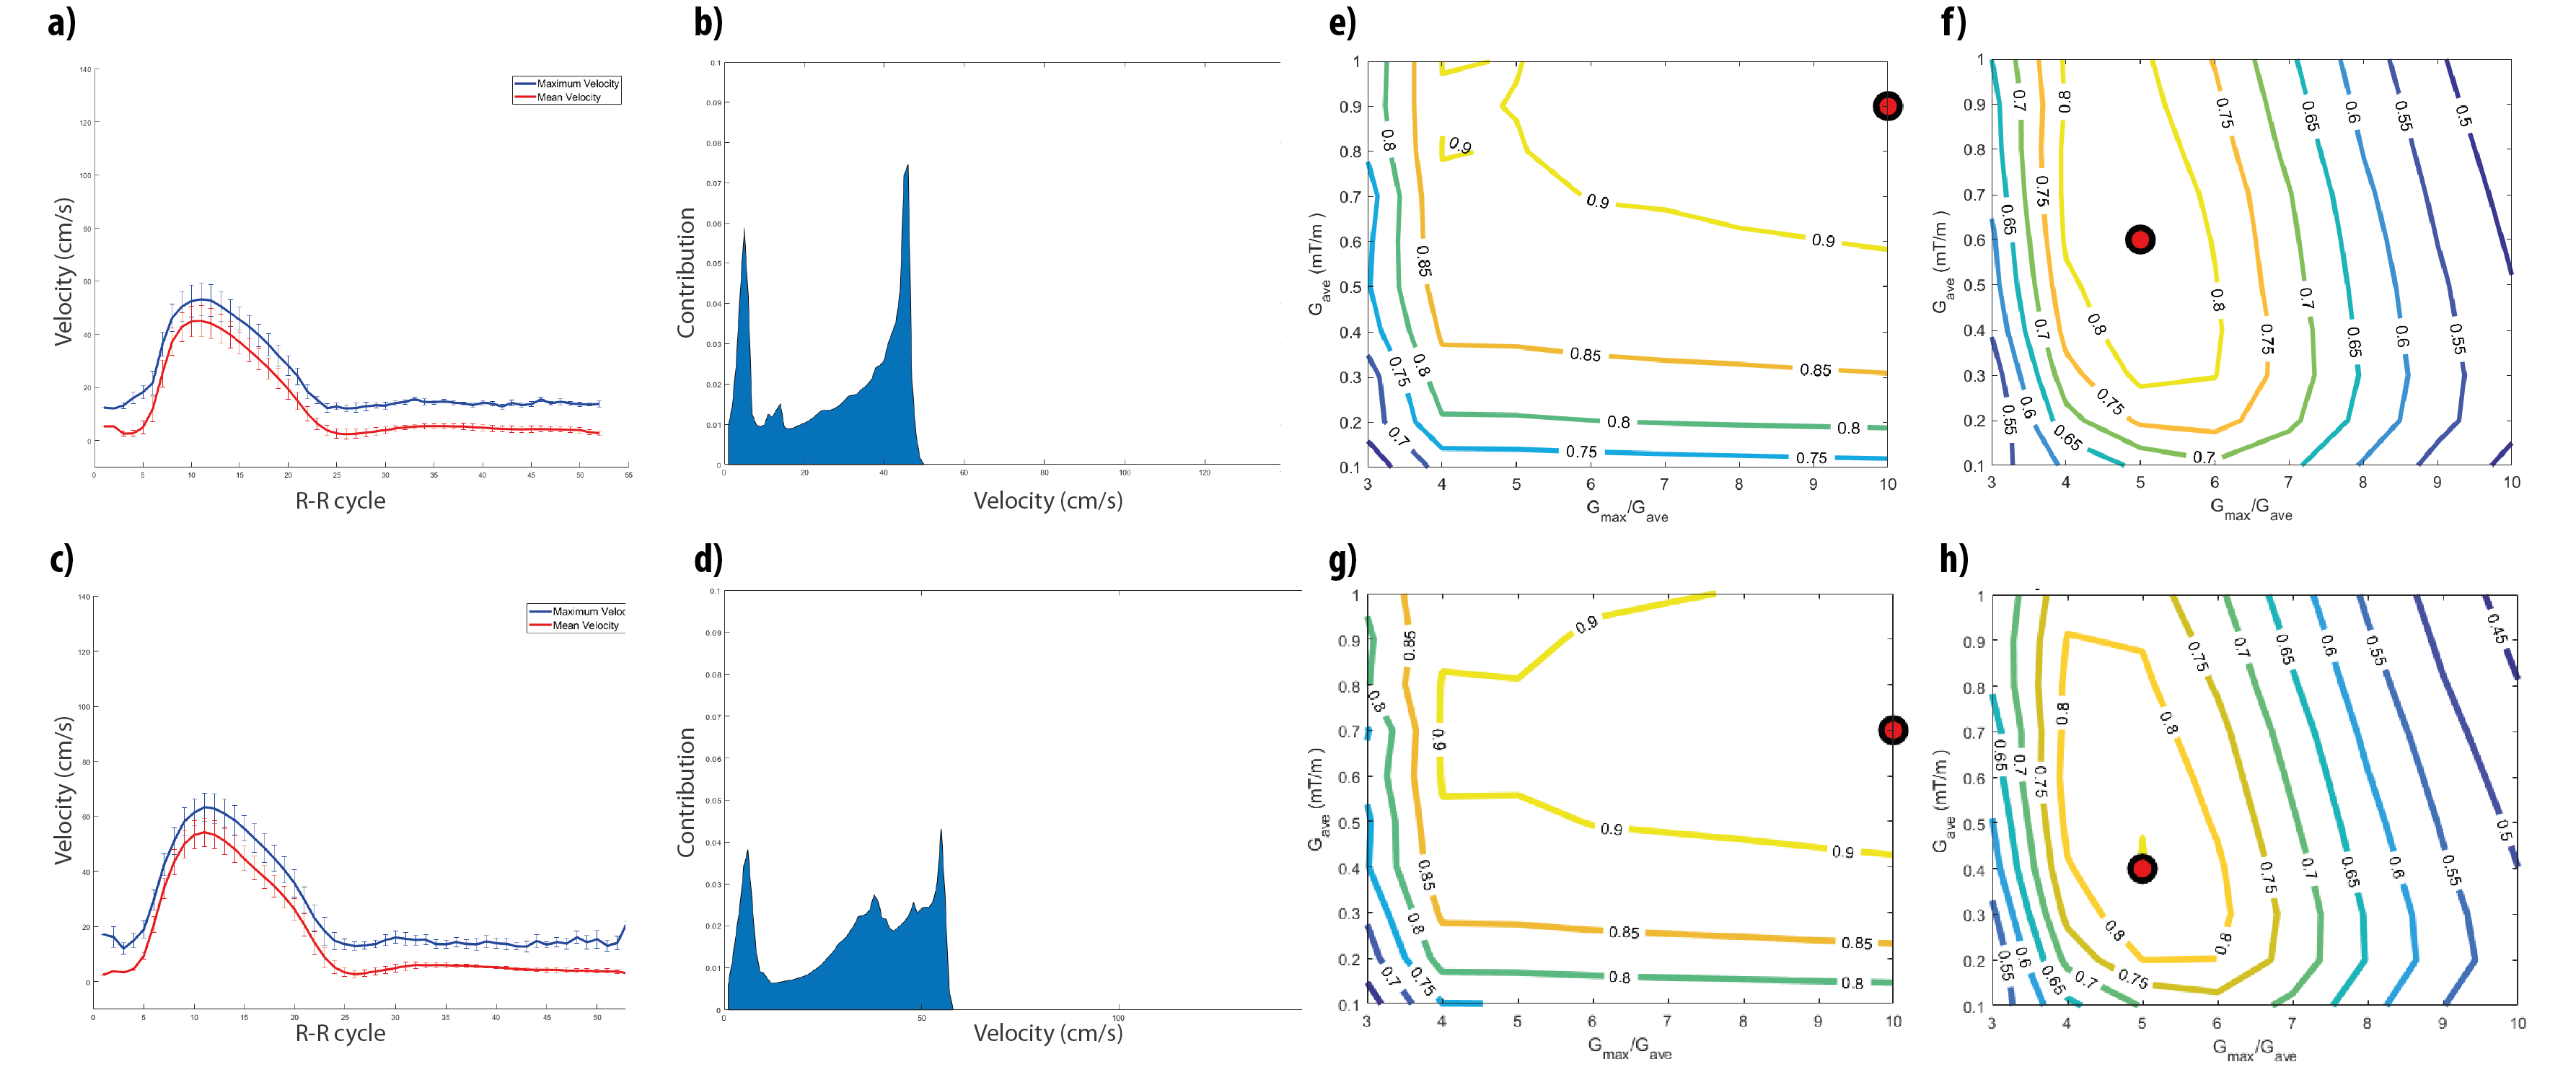
CKD and controls blood flow profiles and velocity contribution curves are shown in Fig 5. a-d. Both CKD patients and controls, have similar velocity profiles with peak velocities between 55 and 65 cms/s for each group, which are almost 50% of the peak velocities in young volunteers.
Efficiency maps (Fig. 5 e-h) show that on resonance, high efficiency values (over 0.8) are found for a wide range of parameters (ratios over 5 and Gave higher than 0.2-0.3 [mT/m]), whereas when considering off-resonance, the range of parameters that provide high efficiencies are narrower (ratios between 5-7 and Gave values of 0.5-0.7 [mT/m]), although, interestingly, compared to young volunteers, efficiency of pCASL is less sensitive to off-resonance, as the blood flow velocities are much lower.
Conclusion
To optimize the inversion efficiency of pCASL in studies of CKD, Gave should be set to 0.5-0.7mT/m and the ratio of Gmax to Gave should be 6-7.Acknowledgements
Rebeca Echeverria-Chasco received Ph.D. grant support from Siemens Healthcare Spain.References
1. Williams DS, Detre JA, Leigh JS, Koretsky AP. Magnetic resonance imaging of perfusion using spin inversion of arterial water. Proc Natl Acad Sci USA 1992; 89: 212– 216.
2. Nery, F.; Gordon, I.; Thomas, D.L. Non-Invasive Renal Perfusion Imaging Using Arterial Spin Labeling MRI: Challenges and Opportunities. Diagnostics 2018, 8, 2.
3. Aghogho Odudu, Fabio Nery, Anita A Harteveld, Roger G Evans, Douglas Pendse, Charlotte E Buchanan, Susan T Francis, María A Fernández-Seara, Arterial spin labelling MRI to measure renal perfusion: a systematic review and statement paper, Nephrology Dialysis Transplantation, Volume 33, Issue suppl_2, September 2018, Pages ii15–ii21
4. Dai W, Garcia D, De Bazelaire C, Alsop DC. Continuous flow-driven inversion for arterial spin labeling using pulsed radio frequency and gradient fields. Magn Reson Med. 2008;
5. Wu WC, Fernández-Seara M, Detre JA, Wehrli FW, Wang J. A theoretical and experimental investigation of the tagging efficiency of pseudocontinuous arterial spin labeling. Magn Reson Med. 2007;58(5):1020–7.
6. Alsop DC, Detre JA, Golay X, Günther M, Hendrikse J, Hernandez-Garcia L, et al. Recommended implementation of arterial spin-labeled Perfusion mri for clinical applications: A consensus of the ISMRM Perfusion Study group and the European consortium for ASL in dementia. Magn Reson Med. 2015;73(1):102–16.
7. Zhao L, Vidorreta M, Soman S, Detre JA, Alsop DC. Improving the robustness of pseudo-continuous arterial spin labeling to off-resonance and pulsatile flow velocity. Magn Reson Med. 2017;78(4):1342–51.
8. Jahanian H, Noll DC, Hernandez-Garcia L. B 0 field inhomogeneity considerations in pseudo-continuous arterial spin labeling (pCASL): Effects on tagging efficiency and correction strategy. NMR Biomed. 2011;24(10):1202–9.
9. Echeverria-Chasco R, Vidorreta M, Aramendia-Vidaurreta V, Bastarrika G, Fernández-Seara M.A. Optimization of Pseudo Continuous Arterial Spin Labeling for renal ASL. International Society for Magnetic Resonance in Medicine; 11-16 May, 2019; Montreal, QC, Canada. 4954
10. Greer J.S, Wang Y, Pedrosa I, and Madhuranthakam A.J. Pseudo-continuous arterial spin labeled renal perfusion imaging at 3T with improved robustness to off-resonance. International Society for Magnetic Resonance in Medicine; 11-16 May, 2019; Montreal, QC, Canada. 4959
11. Maccotta L, Detre J a, Alsop DC. The efficiency of adiabatic inversion for perfusion imaging by arterial spin labeling. NMR Biomed. 1997;10(4–5):216–21
12. Avants, B. B., Tustison, N., & Song, G. (2009). Advanced normalization tools (ANTS). Insight j, 2, 1-35.
Figures
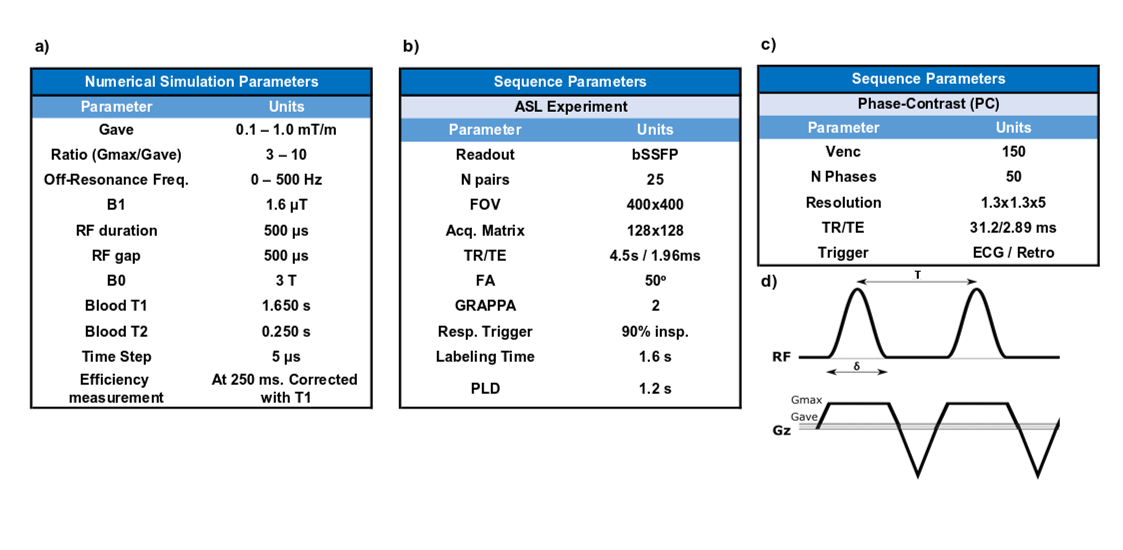
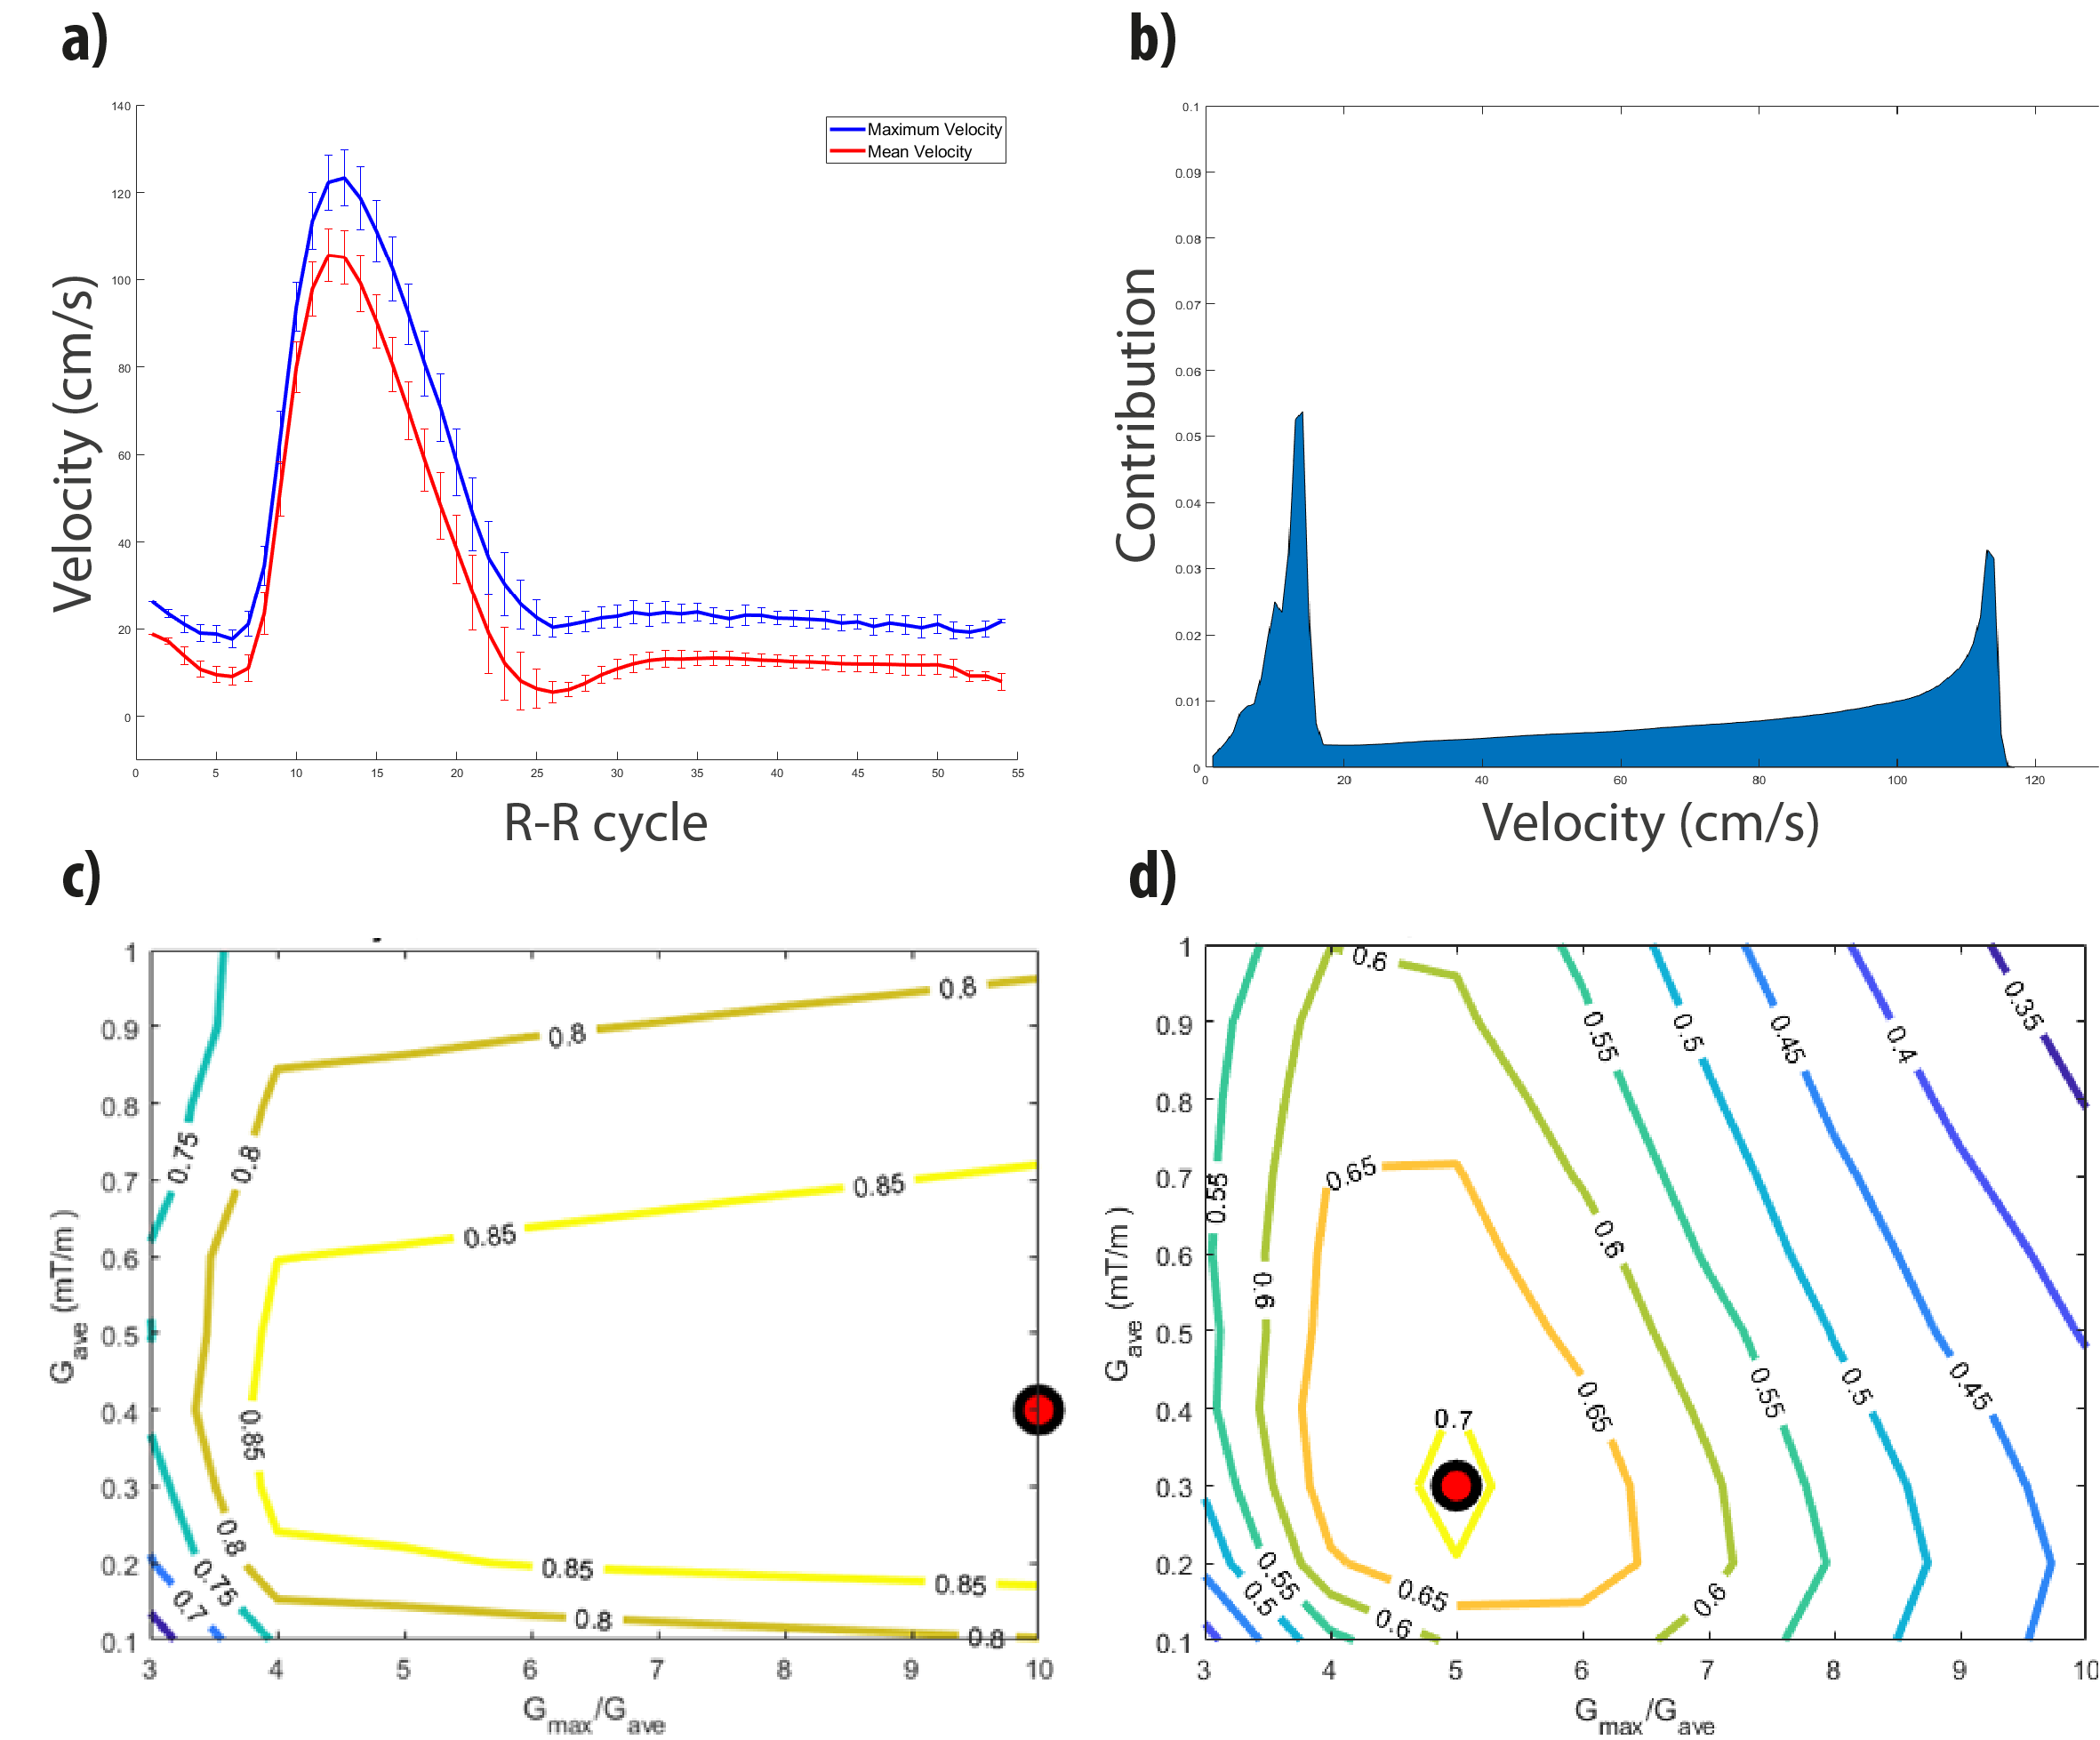
Fig. 2. Results for young-healthy volunteers. a) Velocity profile averaged among volunteers after matching the peak velocities, mean cross-sectional velocity (red) and maximum velocity (blue). b) Normalized contribution of the velocity spins that traverse the labeling plane during a complete R-R cycle. c-d) Labeling efficiency weighted by the contribution considering the velocities measured in the aorta. c) Numerical simulations results for on-resonance, and d) results when artefactual magnetic field variations were included as frequencies varying from 0 to 500Hz.
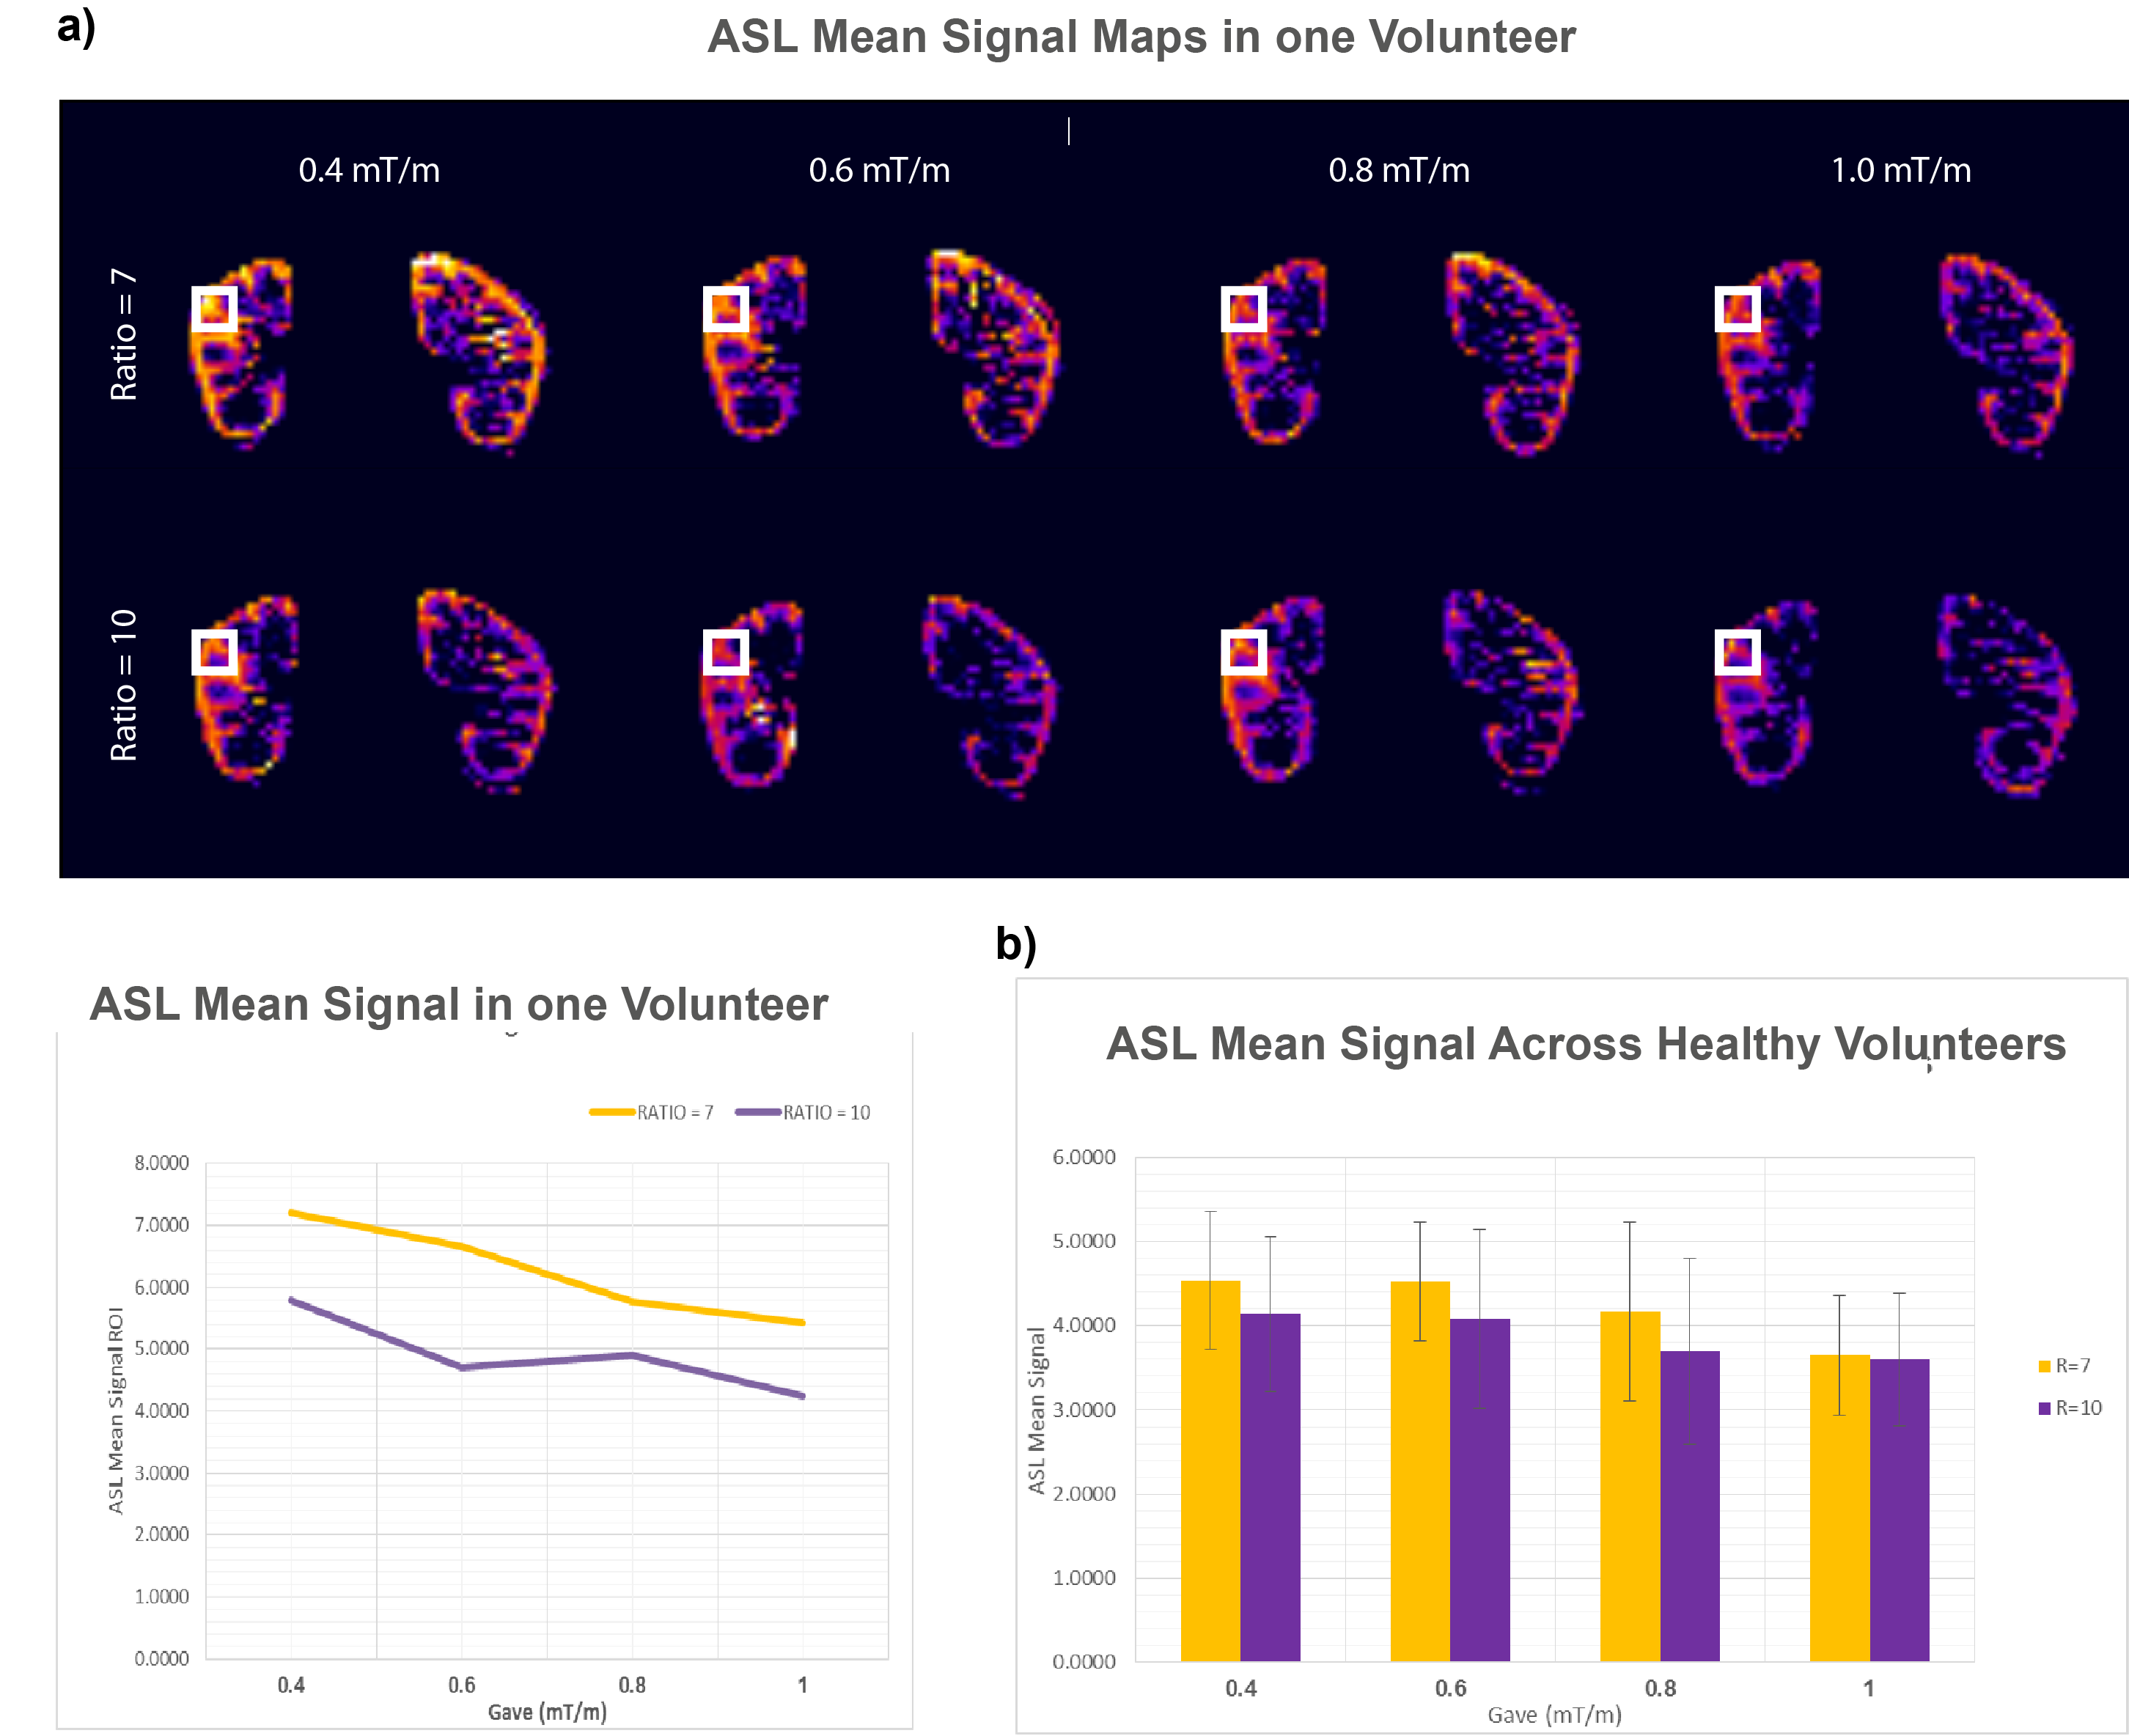
Fig. 3. a) Mean ASL perfusion images are shown for one volunteer with data acquired in the in-vivo ASL experiment. A small cortex ROI (white box) was drown to visualize the effect of Gave and Ratio in the signal, and the measurements are plotted below
b) ASL signal mean of six volunteers in the eight scenarios. Perfusion signal was measured in a manually-drawn ROI in the kidney. Lower average gradients and lower ratio show larger perfusion. The results were in agreement with the numerical simulations in which there was significant differences across Gave values (p-value of 0.04).