3263
Use of arterial spin labeling MRI in differentiating fat-poor angiomyolipoma from clear cell renal cell carcinoma1Department of Radiology, Clinical Medical School of Yangzhou University, Northern Jiangsu People’s Hospital, Yangzhou, 457, China, 2GE Healthcare, MR Research China, Beijing, China
Synopsis
In this study, we aimed to test if arterial spin labeling (ASL) MRI can be used to differentiate renal fat-poor angiomyolipoma (AML) from the clear cell renal cell carcinoma (ccRCC). To achieve this goal, we compared the ASL derived parameters including tumor blood flow (TBF), tumor-to-cortex ratio, and tumor-to-medulla ratio between fat-poor AML and ccRCC. Our results showed that TBF, tumor-to-cortex and tumor-to-medulla ratios were notably higher in ccRCC group than in fat-poor AML group (270.49±78.88ml/100g/min vs. 146.68±47.21ml/100g/min, 1.22±0.26 vs. 0.74±0.14, 3.13±0.94 vs. 1.77±0.55; p<0.05), indicating that ASL MRI can be an effective tool in differentiating fat-poor AML from ccRCC.
INTRODUCTION
The renal fat-poor angiomyolipoma (AML), as an uncommon variant of AML, does not show macroscopic fat. It can thus mimic clear cell renal cell carcinoma (ccRCC), leading to unnecessary surgery 1. The capability to distinguish fat-poor AML from ccRCC is thus essential, so that the correct management of renal masses can be accomplished. Conventional imaging techniques are however still challenging to differentiate between fat-poor AML and ccRCC so far.Three dimensional (3D) arterial spin-labeling (ASL) technique has been widely applied as a quantitative MRI method to measure blood flow without the usage of a contrast agent 2. Several studies have applied ASL for differential diagnosis of renal tumors 3,4. We therefore assume that this method is also effective in the detection of fat-poor AML and ccRCC. To investigate this, we applied 3D ASL MRI to assess fat-poor AML and ccRCC in a clinical cohort. The ASL derived parameters including tumor blood flow (TBF), tumor-to-cortex ratio, and tumor-to-medulla ratio were compared between fat-poor AML and ccRCC patients.
METHODS
Subjects:In this prospective study, 29 ccRCC patients (mean age, 47.44±17.69 years) and 9 fat-poor AML patients (mean age, 58.07±10.37 years) were recruited for MR kidney imaging before surgery. Each patient has signed written informed consent form in our hospital.
MRI experiments:
All MRI experiments were performed at 3T MR system (Discovery 750w, GE Healthcare, USA). Anatomical images of both kidneys were first acquired with T2 weighted MR sequence. 3D ASL MR technique was applied after that with the following parameters applied: TR = 4844 ms, TE = 10.5 ms, matrix = 512x8, FOV = 24x24 cm, slice thickness = 4 mm, and post-label delay= 2025 ms. The total scan time was 4 minutes 41 seconds.
Data analysis:
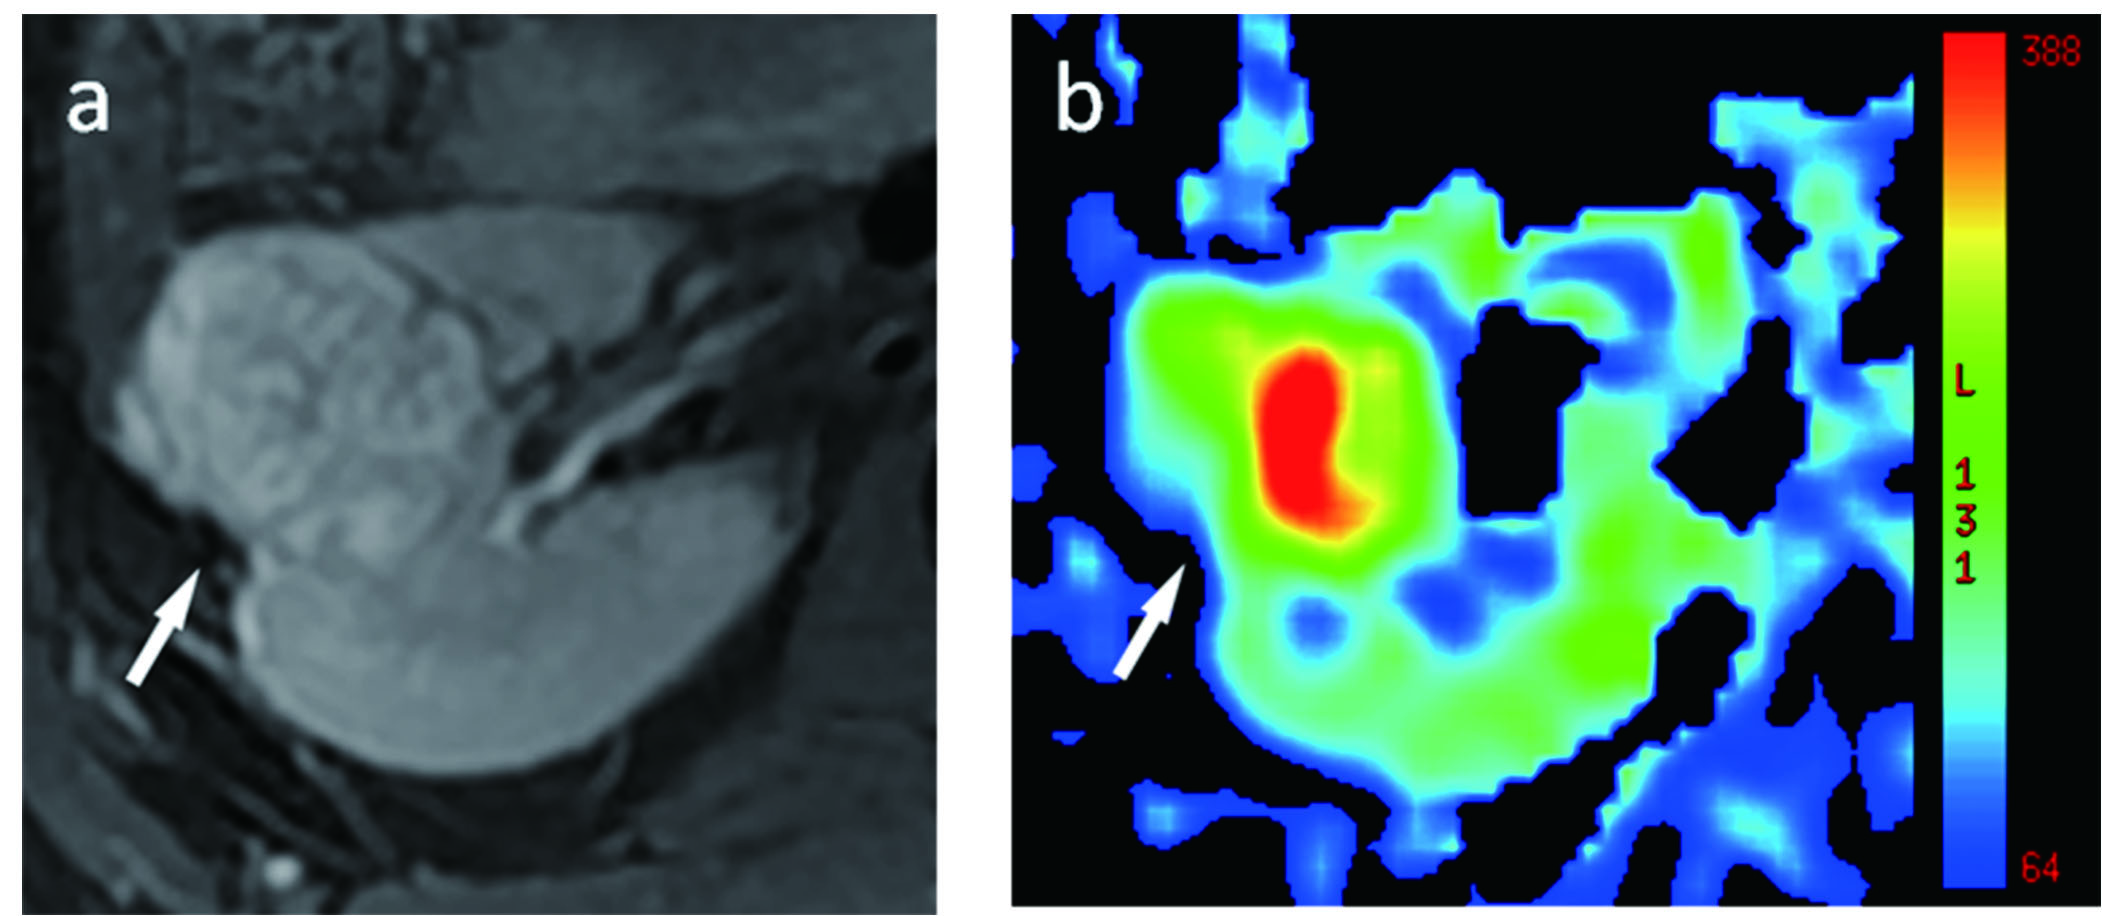
All acquired 3D ASL images were processed using the ASL postprocessing software developed under the Functool platform on GE ADW4.6 workstation. Tumor blood flow (TBF) was measured in a region of interest (ROI), which was selected for solid tumor according to the low signal area present on T2WI and the highest signal intensity (SI) with visual assessment on the perfusion image. Additionally, two relative TBF values were acquired by standardizing the TBF from a blood flow measurement in the reference area. In detail, a cluster of more than 10 voxels was chosen from the normal renal cortex and medulla area as a reference region to calculate tumor-to-cortex ratio, and tumor-to-medulla ratio. ROI(20-120 mm2) was drawn three times to take average.
Statistical analyses were performed using SPSS (version22.0). Independent sample t-test was used to evaluate the difference of TBF, tumor-to-cortex ratio, and tumor-to-medulla ratio between the fat-poor AML and ccRCC groups. Areas under the ROC curve (AUC)s required for the discrimination were separately calculated for each metric. Significance threshold was set as p<0.05.
RESULTS
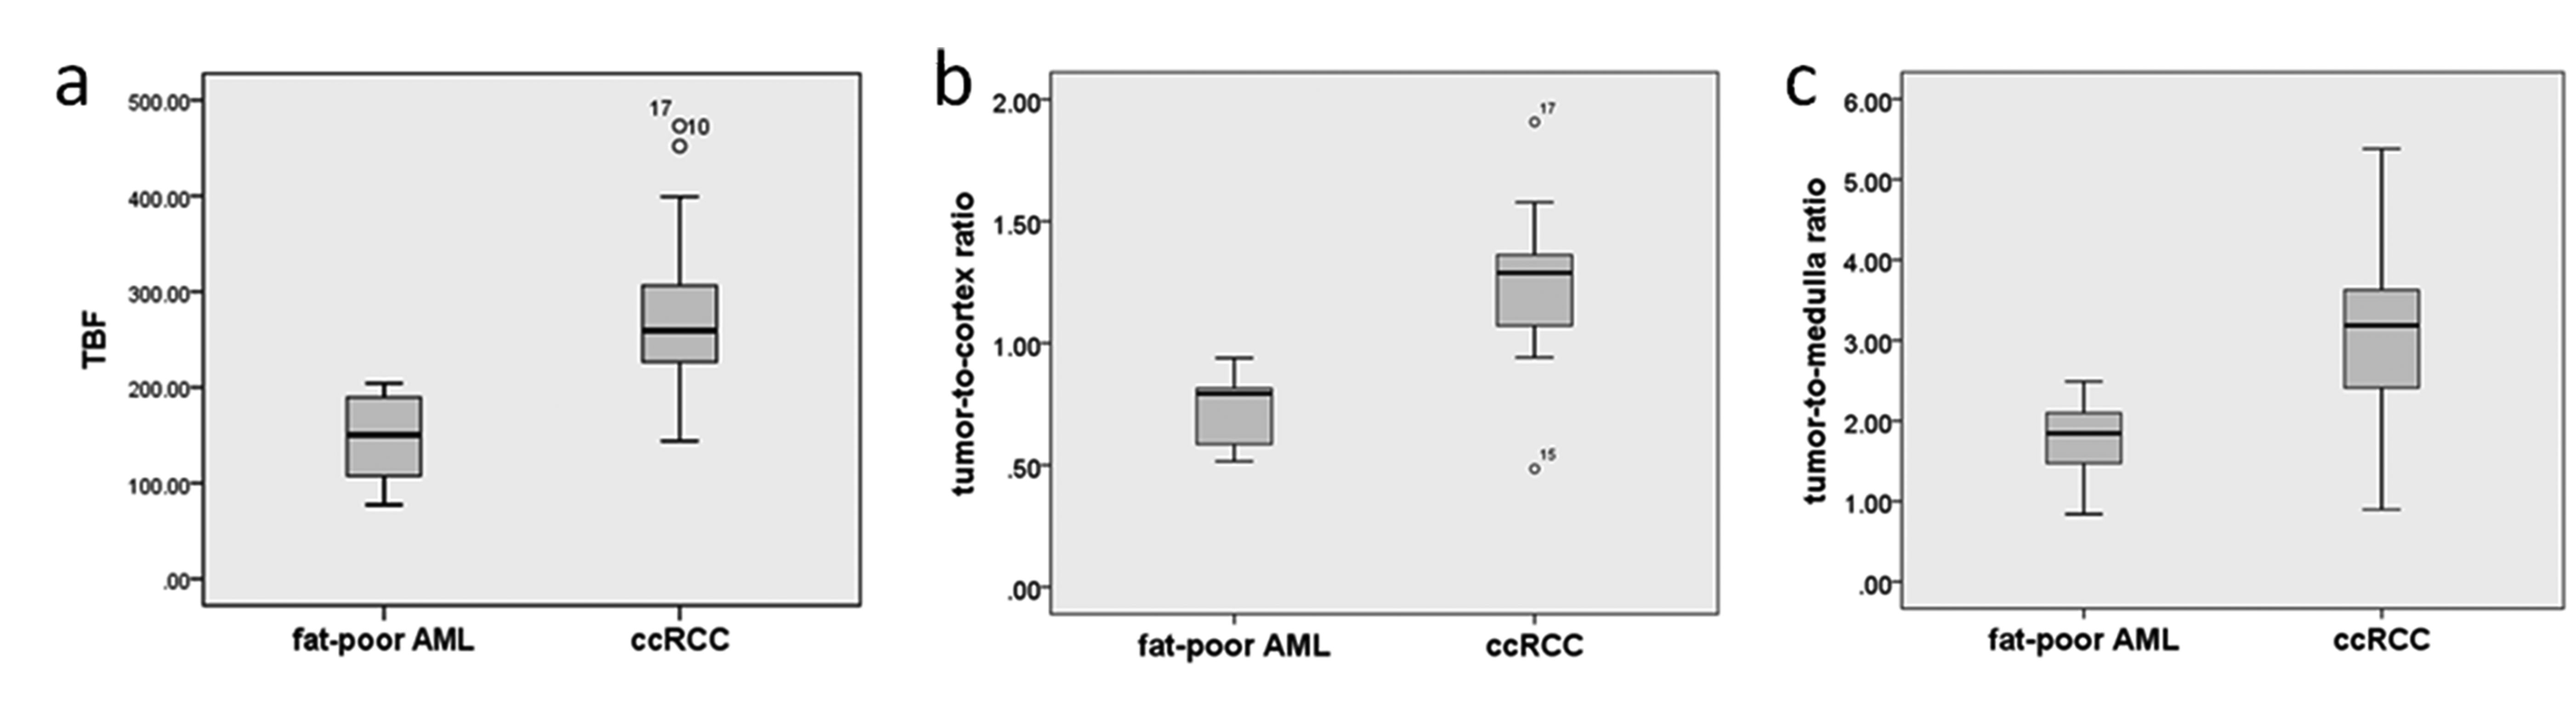
Representative ccRCC and fat-poor AML cases have been shown in Figs. 1,2.Fig. 3 shows the values of TBF, tumor-to-cortex and tumor-to-medulla ratios in ccRCC group and fat-poor AML group. The TBF values were significantly higher in ccRCC group than that in fat-poor AML group (270.49±78.88ml/100g/min vs. 146.68±47.21ml/100g/min; P<0.05). Both tumor-to-cortex and tumor-to-medulla ratios were notably higher in ccRCC group compared with those in fat-poor AML group (1.22±0.26 vs. 0.74±0.14, 3.13±0.94 vs. 1.77±0.55; P<0.05).
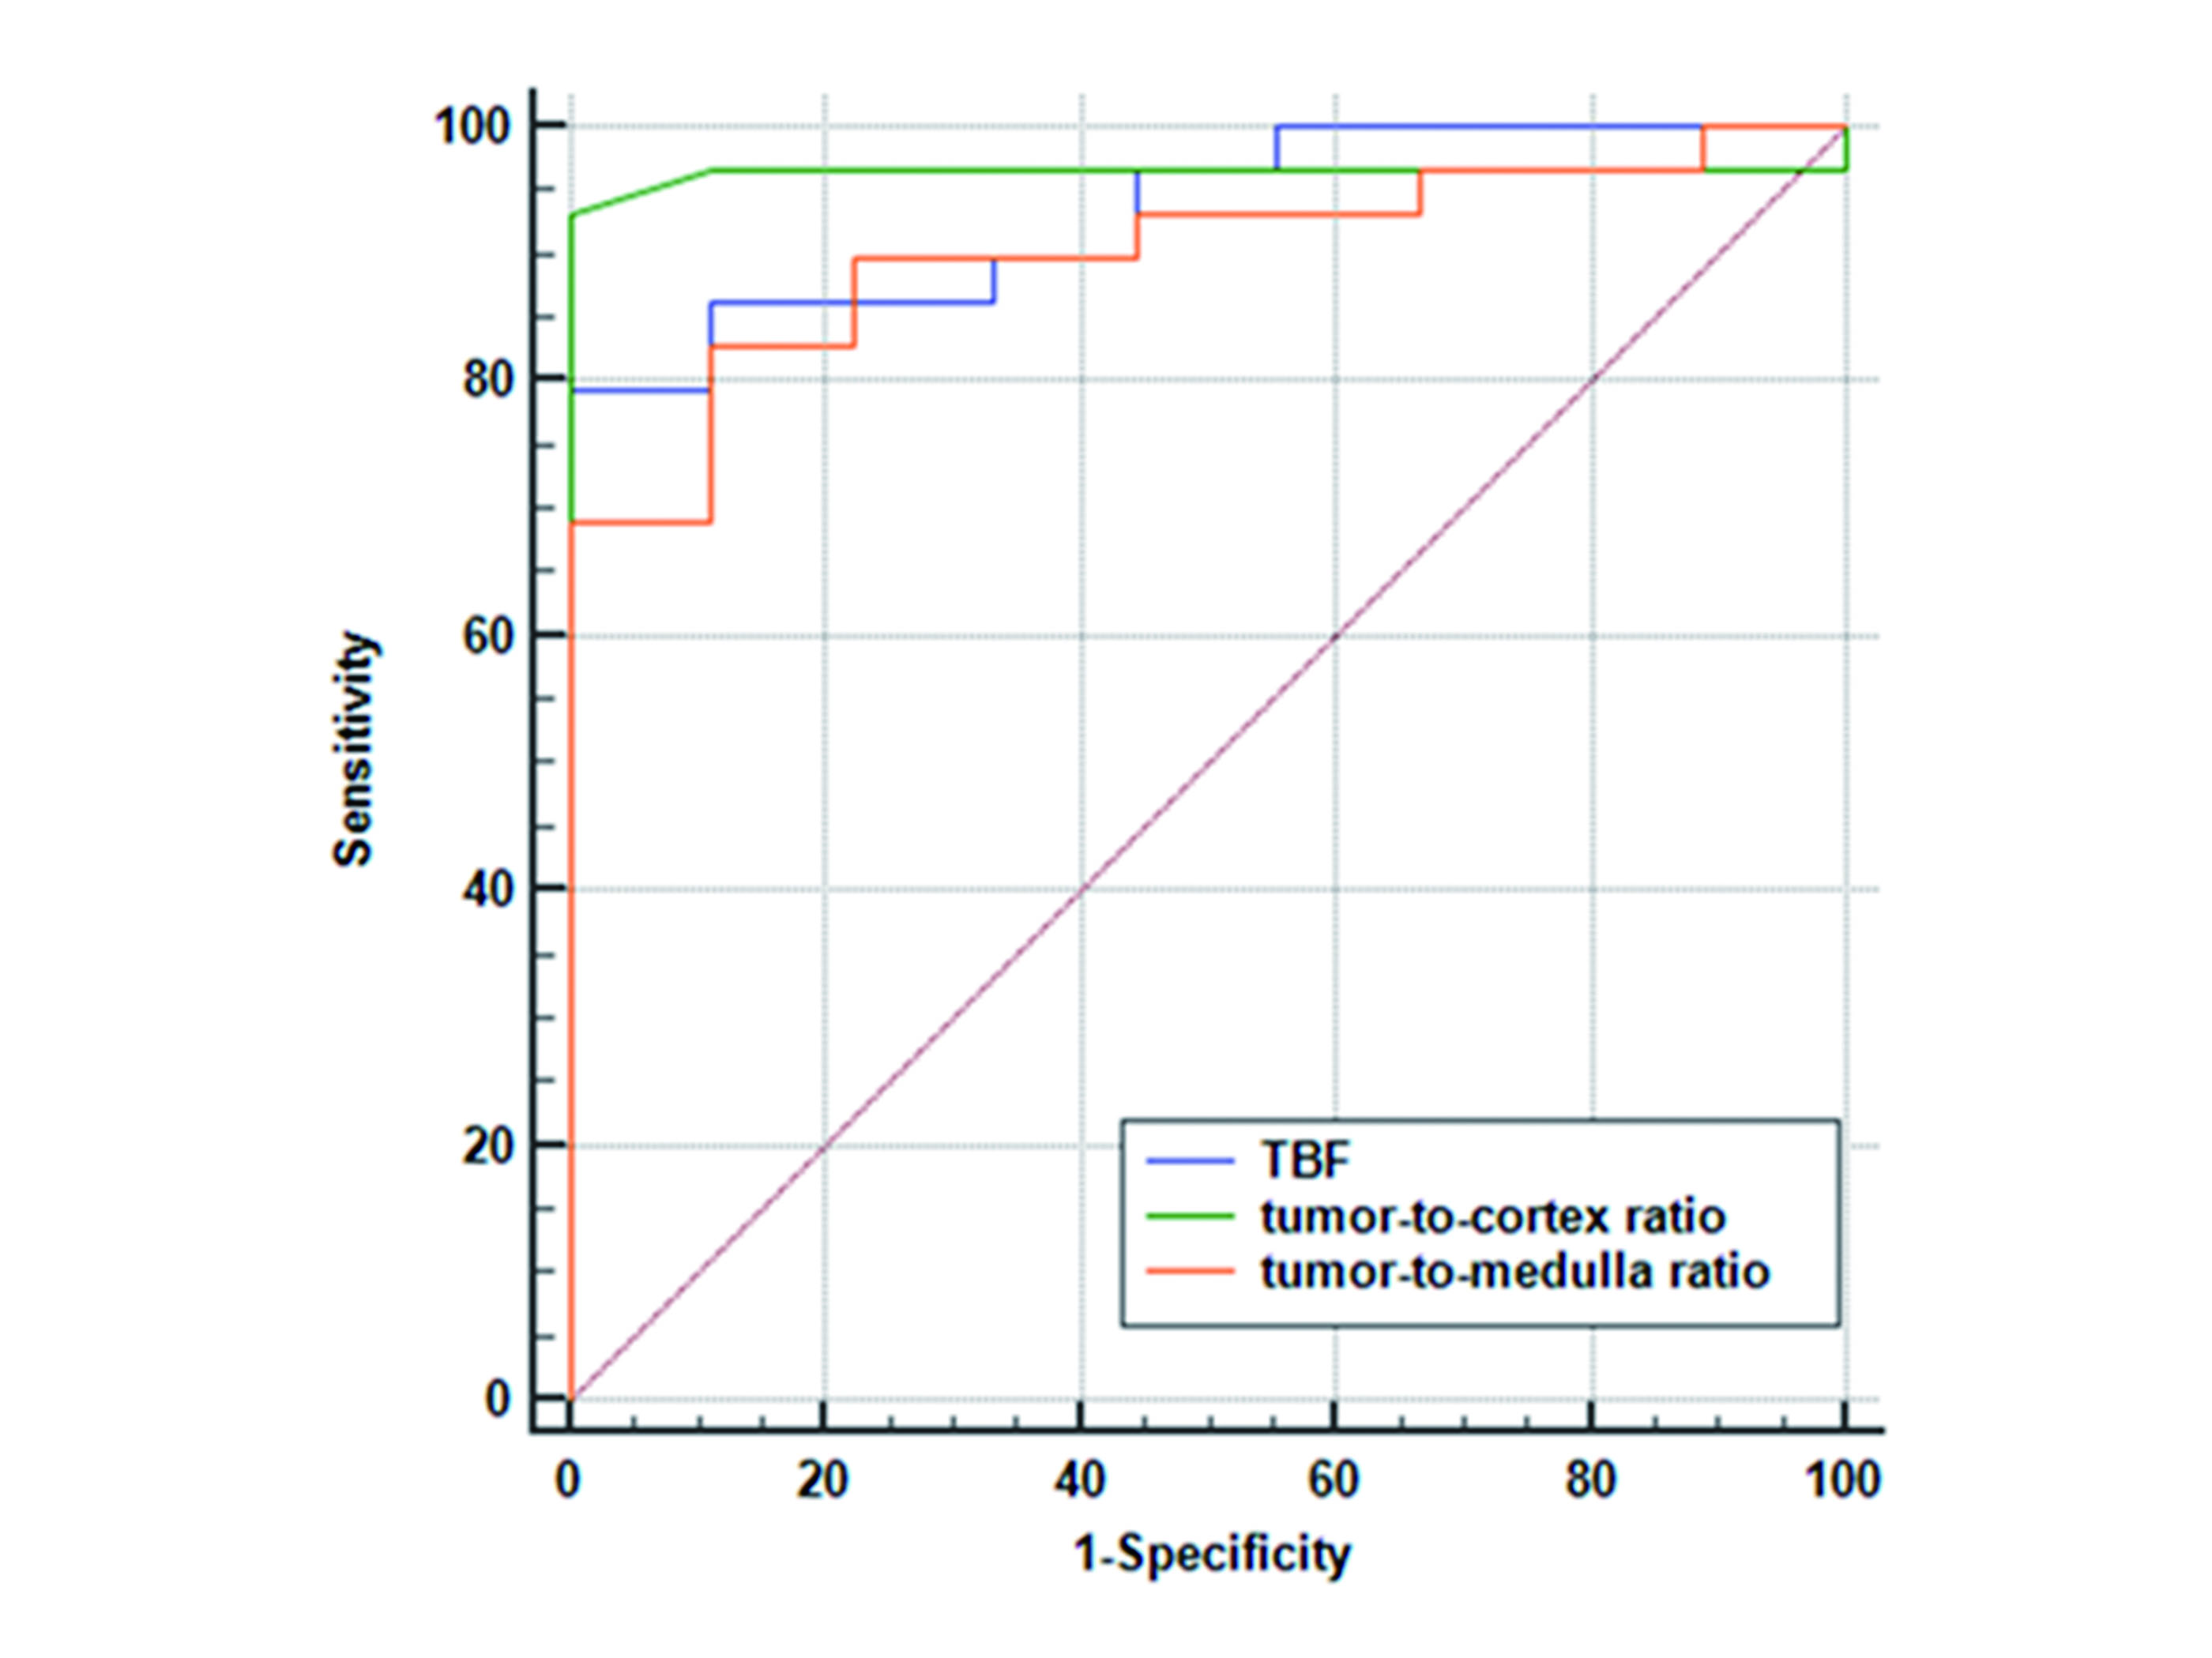
The areas under the ROC curve for TBF, tumor-to-cortex ratio, and tumor-to-medulla ratio were 0.931, 0.964, and 0.900, respectively. No significant difference was observed in AUC values of these three metrics. Fig. 4 depicts the ROC curves of the three measurements.
DISCUSSION
In this study, we applied ASL-derived metrics for discriminating fat-poor AML from ccRCC. The TBF, tumor-to-cortex ratio, and tumor-to-medulla ratio have shown significantly higher values in ccRCC group than in fat-poor AML group. Histologically, most ccRCCs could be differentiated by the occurrence of somatic mutations in von Hippel-Lindau (VHL) gene in the tumor. These changes may lead to stimulation of hypoxia-inducible-factor (HIF) pathway, causing augmented vascularity for high perfusion. In contrast, fat-poor AML is a benign renal neoplasm mainly composed of muscle tissue and encompasses less amount of neovascularization than ccRCC 5. It may thus result in lower tumor perfusion.CONCLUSION
In conclusion, due to significantly higher TBF, tumor-to-cortex ratio, and tumor-to-medulla ratio in ccRCC group than in fat-poor AML group, our study can demonstrate that ASL MRI could be an effective tool to accurately distinguish fat-poor AML from ccRCC.Acknowledgements
None.References
1. Richard PO, Jewett MAS, Bhatt JR, et al. Renal Tumor Biopsy for Small Renal Masses: A Single-center 13-year Experience. European urology. 2015;68(6):1007-13.
2. Yawen S , Wenwei C , Weina D , et al. Cerebral Blood Flow Alterations as Assessed by 3D ASL in Cognitive Impairment in Patients with Subcortical Vascular Cognitive Impairment: A Marker for Disease Severity. Frontiers in Aging Neuroscience, 2016; 8: 211.
3. Lanzman RS, Robson PM, Sun MR, et al. Arterial spin-labeling MR imaging of renal masses: correlation with histopathologic findings. Radiology. 2012;265(3):799.
4. Zhang Y , Kapur P , Yuan Q , et al. Tumor Vascularity in Renal Masses: Correlation of Arterial Spin-Labeled and Dynamic Contrast-Enhanced Magnetic Resonance Imaging Assessments. Clinical Genitourinary Cancer, 2016, 14(1):e25-e36.
5. Ching BC, Tan HS, Tan PH, et al. Differential radiologic characteristics of renal tumours on multiphasic computed tomography. Singapore Medical Journal. 2016;58(5).
Figures