3262
Range of Gd-DTPA concentration where $$$T_1$$$ shortening effect remains linear at 3T, 9.4T and 11.7T1Oncologic Imaging, National Cancer Center Singapore, Singapore, Singapore, 2Functional Metabolism Group, Singapore BioImaging Consortium, Singapore, Singapore
Synopsis
In $$$T_1$$$-weighted perfusion studies, the relationship between the contrast concentration and $$$T_1$$$ shortening effect is assumed to be linear within the clinical range. However, this assumption may not hold at higher concentration observed in the arterial input functions (AIFs). We set out to investigate this relationship by measuring the $$$R_1$$$ relaxation rate of various Gd-DTPA concentrations in saline. We find that the change in $$$R_1$$$ relaxation rate of Gd-DTPA is linear up to 4 mM at 9.4T and 11.7T, and up to 5 mM at 3T. At higher concentration, $$$R_1$$$ relaxation rate increases faster than a linear relationship.
Introduction
Quantitative $$$T_1$$$-weighted perfusion studies require an accurate arterial input function (AIF), which is the concentration of contrast media in the arterial system as a function of time. Traditionally, AIF measurement is achieved indirectly by measuring the longitudinal relaxation rate of the blood pool, assuming a linear relationship over the range of clinical contrast concentration:$$R_{1_C}=R_{1_0}+r_1*C~~~~~(1)$$
where $$$R_{1_C}=\frac{1}{T_{1_C}}$$$ represents the relaxation rate at contrast concentration $$$C$$$, and $$$R_{1_0}=\frac{1}{T_{1_0}}$$$ represents the baseline relaxation rate (pre-contrast).
However, this assumption may not hold at the AIF peak. In this study, we set out to investigate the range of contrast concentration where a linear relationship can be assumed by measuring the relaxation rate $$$R_1$$$ at various gadopentetate concentrations in normal saline at different field strengths (3T, 9.4T and 11.7T). This range of concentration can be used as a guide to adjust the clinically administered contrast dose to accurately portray the AIF peak.
Methods
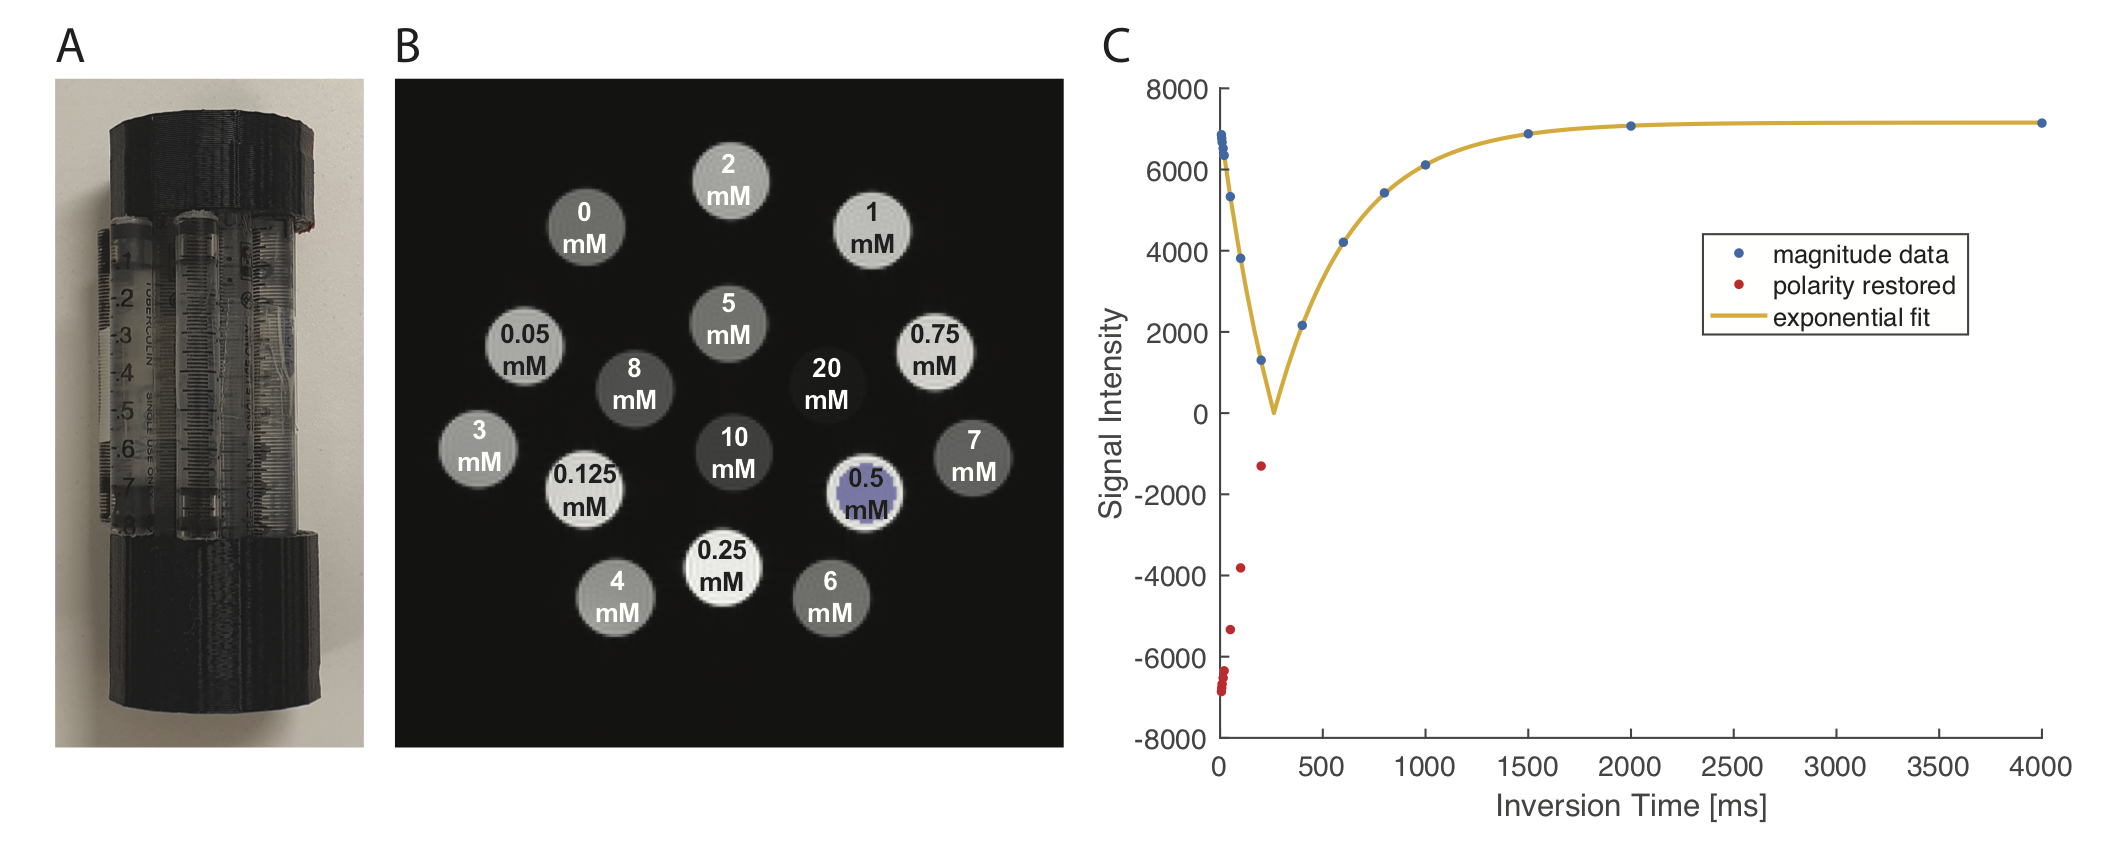
1. Phantom:Sixteen 1mL-syringes containing serial dilutions of gadopentetate dimeglumine (Magnevist, Gd-DTPA [0.5 M], Bayer Health Care, Germany) in normal saline with concentrations ranging from 0 mM to 20.0 mM were fixed in a 3D-printed plastic holder (Fig. 1a and 1b).
2. Imaging:
All imaging was performed at room temperature. On the BioSpec 9.4T and 11.7T systems (Bruker, Germany), 40 mm volume coils (Bruker, Germany) was used. Spin echo inversion recovery (SE-IR) sequence (TE = 20 ms; TR = 20 s; 200x200; one 5 mm slice) at various time to inversion (TI = 6.5/8/10/15/20/50/100/200/400/600/800/1000/1500/2000/4000ms) was used. The acquisition time was 16 hours and 40 minutes per system.
On the Skyra 3T system (Siemens, Germany), a knee coil (Siemens, Germany) was used. The scan parameters were chosen as close as possible to the Bruker systems (TE = 22 ms; TR = 16 s; 192x192; one 1cm slice; iPAT: 2; turbo factor: 1; number of repetitions: 4; TI = 23/50/100/200/400/600/800/1000/1500/2000/4000 ms). The acquisition time was 18 hours and 40 minutes.
3. Analysis:
Data analysis was performed in Matlab (Mathworks, Natick, MA, USA). Voxel-wise exponential curve fitting to estimate $$$T_1$$$ values was performed using qMRLab package 1,2:
$$S(TI_n)=a+be^{(-TI_n*\frac{1}{T_1})}$$
Voxel-wise $$$R_1$$$ values were calculated. The $$$R_1$$$ values were extracted from regions of interest (ROIs) placed at tube centres (Fig. 1). Each ROI contained 248 voxels at 9.4T/11.7T and 221 voxels at 3T. Simple linear regression model was fitted to the initial linear portion of each data set to calculate the $$$r_1$$$ relaxivity for each field strength:
$$r_1=\frac{(R_{1_C}-R_{1_0})}{C}$$
Results
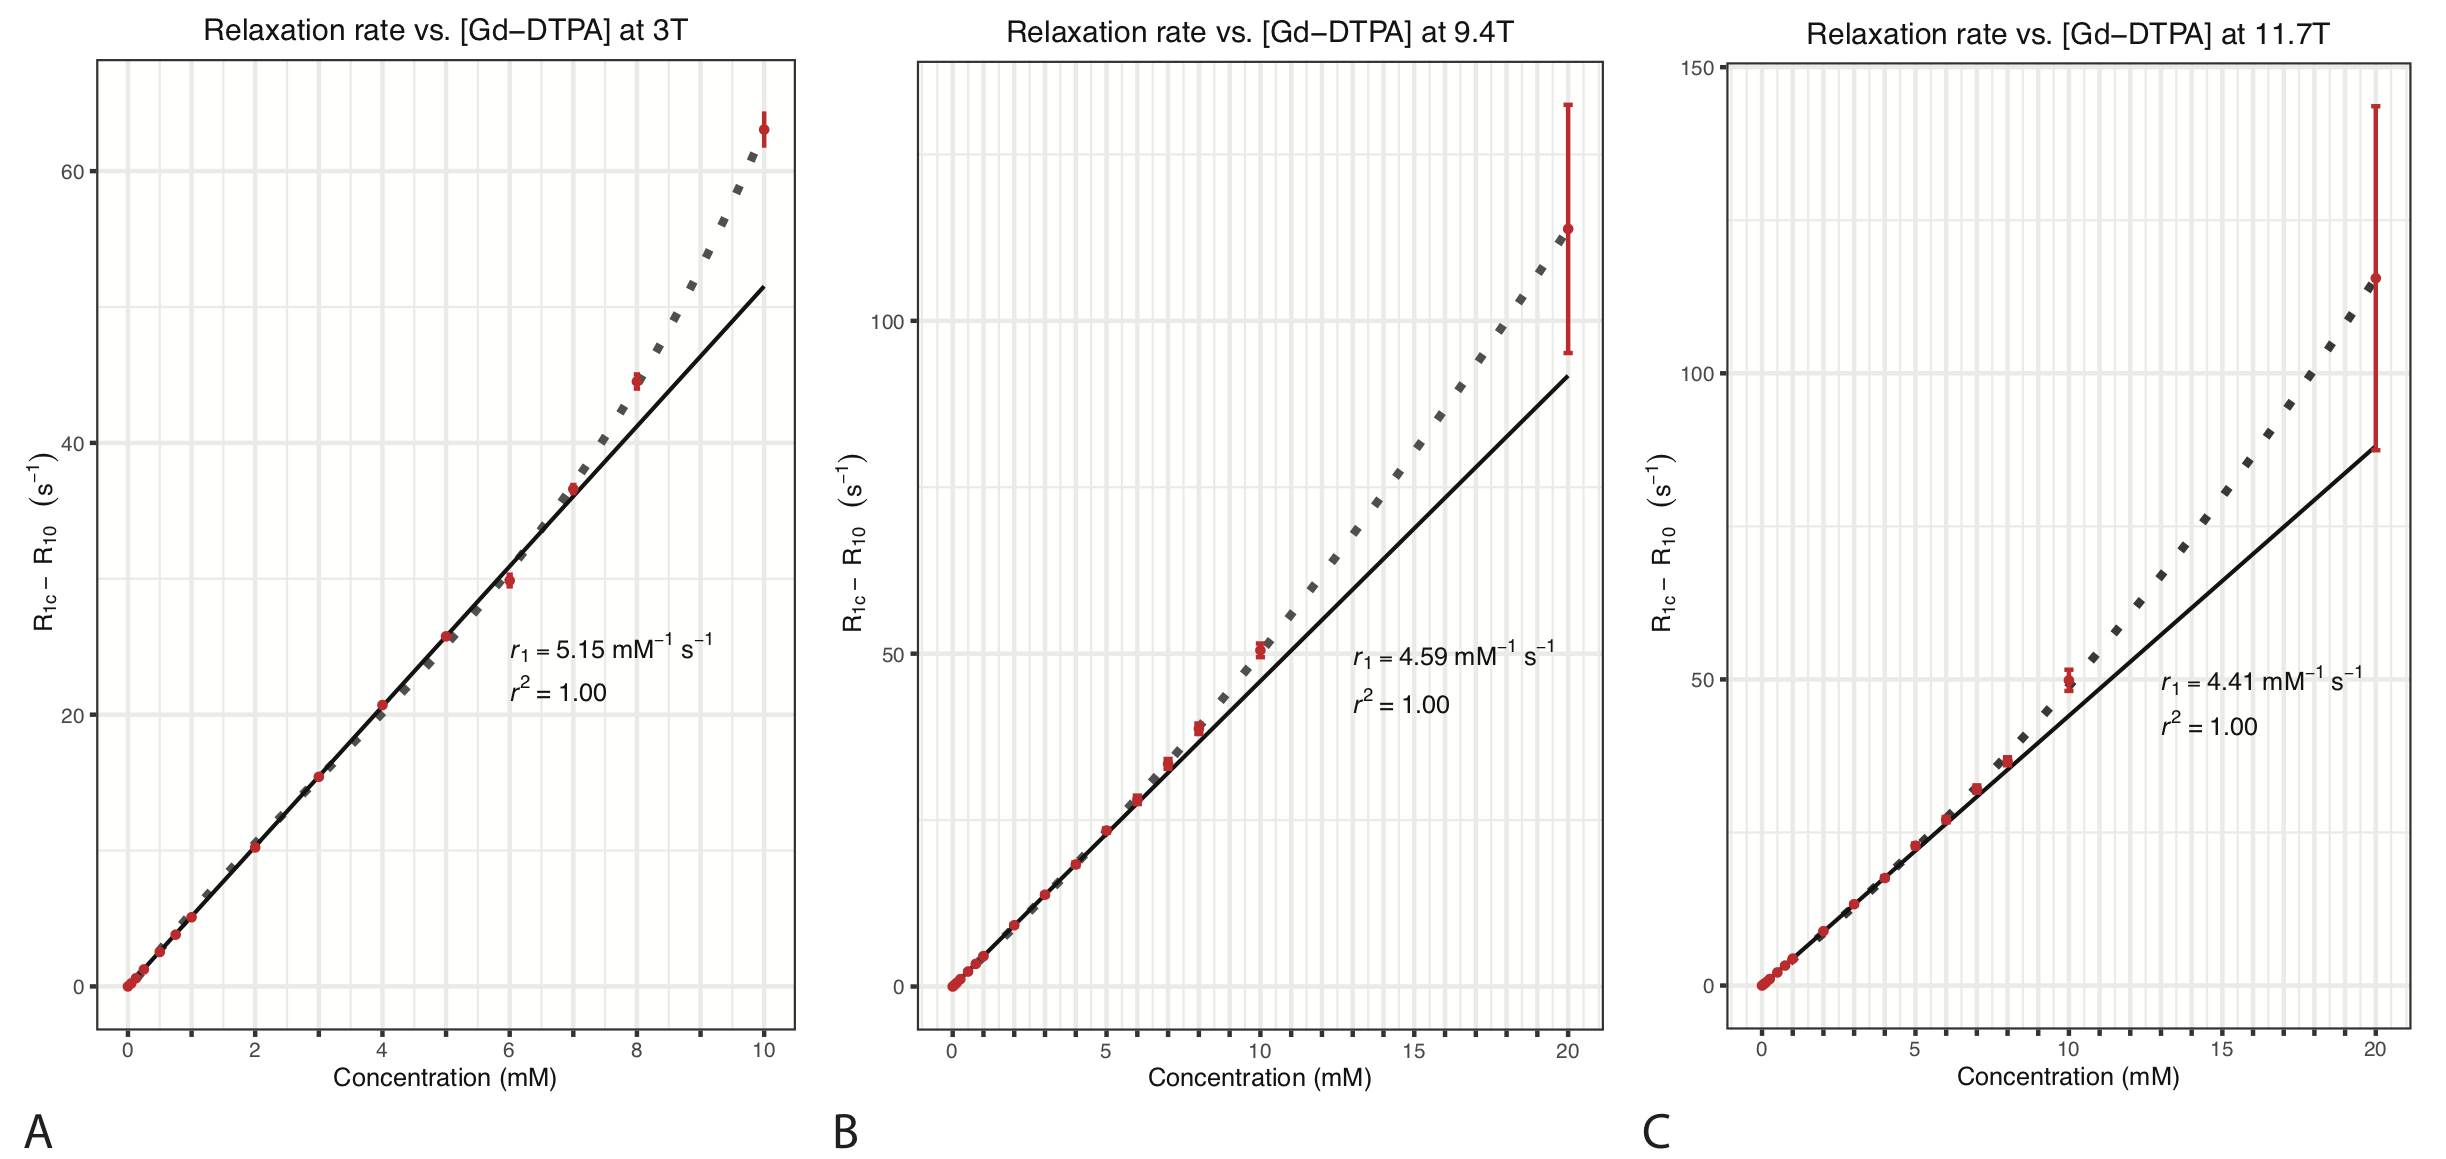
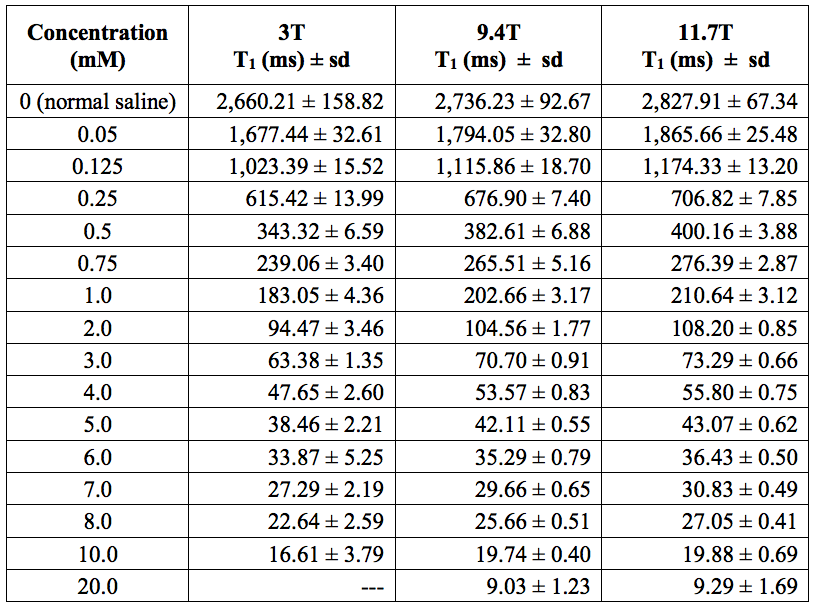
The $$$T_1$$$ values of various Gd-DTPA concentrations at 3T, 9.4T and 11.7T are listed in Table 1. In the 3T system, the minimum TI was 23 ms, limiting measurement of shorter $$$T_1$$$ values (i.e. 20 mM tube).The change in $$$R_1$$$ is linear with respect to Gd-DTPA concentration in the first 10 concentrations (up to 4 mM) at 9.4T and 11.7T, and in the first 11 concentrations (up to 5 mM) at 3T (Fig. 2). At higher concentration (≥5mM at 9.4T and 11.7T, and ≥6mM at 3T), the $$$R_1$$$ increases faster than Eqn. (1) predicts. Our measured $$$r_1$$$ values were 5.15 mM-1s-1 at 3T, 4.59 mM-1s-1 at 9.4T and 4.41 mM-1s-1 at 11.7T.
Discussion
Our study measured $$$R_1$$$ relaxation rates of 16 different Gd-DTPA concentrations in normal saline at room temperature using the gold-standard SE-IR. Our result suggests that $$$T_1$$$ shortening effect of Gd-DTPA in normal saline is linearly related to the concentration below 5 mM at 3T, and below 4 mM at 9.4T and 11.7T. At higher concentration, the linear model would overestimate the actual contrast concentration based on the relaxation rate. Since the typical peaks in clinical AIFs are between 8 to 10 mM 3, our finding suggests that a lower dose of contrast media may allow for more accurate estimation of the AIF based on Eqn. (1). This is in support of the effort to lower the contrast dosage due to gadolinium accumulation in the brain.Differences between our $$$r_1$$$ value and other published values 4-7 could be due to several factors. We used extremely long TRs (16 s to 20 s) to ensure adequate relaxation of the baseline sample (normal saline), while other studies chose TRs ranging from 1.5 s plus TI 4 to 5 s plus TI 6. There are also differences in the solvents and imaging temperatures 4-7.
Our study has several limitations. The solvent and imaging conditions are not physiological. We relied on visual assessment to identify the linear range. A more rigorous statistical method can be employed for a more accurate result. This study can be expanded to include a wider range of contrast agents.
Conclusion
In summary, we find that the relationship between $$$T_1$$$ shortening effect of Gd-DTPA and its concentration in saline is linear below 5 mM at 3T and below 4 mM at 9.4T/11.7T. Therefore, administration of a lower contrast dose might be more appropriate for AIF estimation in perfusion studies using Eqn. (1).Acknowledgements
No acknowledgement found.References
1. Cabana J-F, Gu Y, Boudreau M, et al. Quantitative magnetization transfer imaging made easy with qMTLab: Software for data simulation, analysis, and visualization. Concepts Magn. Reson. 2016;44A:263–277. doi: 10.1002/cmr.a.21357.
2. Barral JK, Gudmundson E, Stikov N, Etezadi-Amoli M, Stoica P, Nishimura DG. A robust methodology for in vivo T1 mapping. Magn Reson Med 2010;64:1057–1067. doi: 10.1002/mrm.22497.
3. Fram EK, Herfkens RJ, Johnson GA, Glover GH, Karis JP, Shimakawa A, Perkins TG, Pelc NJ. Rapid calculation of T1 using variable flip angle gradient refocused imaging. Magn Reson Imaging 1987;5:201–208. doi: 10.1016/0730-725x(87)90021-x.
4. Rohrer M, Bauer H, Mintorovitch J, Requardt M, Weinmann H-J. Comparison of magnetic properties of MRI contrast media solutions at different magnetic field strengths. Invest Radiol 2005;40:715–724. doi: 10.1097/01.rli.0000184756.66360.d3.
5. Shen Y, Goerner FL, Snyder C, Morelli JN, Hao D, Hu D, Li X, Runge VM. T1 relaxivities of gadolinium-based magnetic resonance contrast agents in human whole blood at 1.5, 3, and 7 T. Invest Radiol 2015;50:330–338. doi: 10.1097/RLI.0000000000000132.
6. Pintaske J, Martirosian P, Graf H, Erb G, Lodemann K-P, Claussen CD, Schick F. Relaxivity of Gadopentetate Dimeglumine (Magnevist), Gadobutrol (Gadovist), and Gadobenate Dimeglumine (MultiHance) in human blood plasma at 0.2, 1.5, and 3 Tesla. Invest Radiol 2006;41:213–221. doi: 10.1097/01.rli.0000197668.44926.f7.
7. Noebauer-Huhmann IM, Szomolanyi P, Juras V, Kraff O, Ladd ME, Trattnig S. Gadolinium-based magnetic resonance contrast agents at 7 Tesla: in vitro T1 relaxivities in human blood plasma. Invest Radiol 2010;45:554–558. doi: 10.1097/RLI.0b013e3181ebd4e3.
Figures