3261
Optimization of the Injection Protocol for Carotid Black-blood and Interleaved Black-bright-blood Dynamic Contrast-Enhanced MRI
Yajie Wang1, Yishi Wang2, Xian Liu1, and Huijun Chen1
1Center for Biomedical Imaging Research, School of Medicine, Tsinghua University, Beijing, China, 2Philips Healthcare, Beijing, China
1Center for Biomedical Imaging Research, School of Medicine, Tsinghua University, Beijing, China, 2Philips Healthcare, Beijing, China
Synopsis
The injection protocol used in carotid dynamic contrast-enhanced (DCE) MRI varies among different studies. The effect of the injection protocol on carotid black-blood and interleaved black-bright-blood DCE sequences were evaluated in this study. The results demonstrated that high injection dose (~ 0.1mmol/kg) with relative low effective injection rate (< 0.3mmol/s) was recommended for the simulated black-blood and interleaved black-bright-blood sequences. These two sequences were also shown to be insensitive to the uncertain time gap between the contrast injection and the post-contrast image acquisition.
Introduction
The injection protocol used in carotid dynamic contrast-enhanced (DCE) MRI varies among different studies1-5. In the previous study, the effect of the injection protocol on carotid bright-blood DCE sequence has been evaluated6. However, bright-blood DCE techniques always suffer from signal interference between the blood and the vessel wall3. Furthermore, high temporal resolution was required by the arterial input function (AIF) due to the rapid variation of the contrast concentration. Whereas, high spatial resolution was required by the vessel wall imaging. To achieve these two requirements simultaneously is still a challenge. In recent years, carotid black-blood3,4 and interleaved black-bright-blood5,7 DCE techniques have been proposed. Thus, in this study, we aim to further evaluate the effect of the injection protocol on carotid black-blood and interleaved black-bright-blood DCE sequences.Methods
Black-blood3 and interleaved black-bright-blood (HOmologous Black-Bright-blood and flexible Interleaved imaging sequence, HOBBI)5 DCE sequences were simulated (Table1). The simulation process was generally consistent with the previous study6. Overall, two carotid plaques, one with lipid-rich necrotic core (LRNC) and one with intra-plaque hemorrhage (IPH) were simulated under different injection dose (0.02-0.1mmol/kg) and effective injection rate (0.1-2mmol/s, defined as injection rate (ml/s)×injection concentration (mmol/ml)). For black-blood sequence, a circular reference muscle region with the diameter=8 mm was additionally placed between the two plaques and a reference-region-method-based on the Patlak model3 was used for pharmacokinetic analysis. For HOBBI sequence, two series of black- and bright-blood dynamic images were generated and a Patlak model1 was used. MR signal of the blood was calculated according to its velocity in the black-blood DCE and in the black-blood module of the HOBBI DCE. To simulate the uncertain time gap between the contrast injection and the post-contrast image acquisition, for each injection protocol, the simulation was repeated with ten different time delays (uniform distributed).The plaque ROI was automatically generated in black-blood sequence and on the images from the black-blood module in HOBBI sequence. Pixels at the boundary of the lumen and vessel with the enhancement pattern more similar to the vessel wall than the blood were included within the plaque ROIflow. The mean of the root mean square error (RMSE) of the Ktrans and vp map under each time delay of each injection protocol was calculated. The mean and the standard deviation (SD) of the RMSEs within the plaque ROIflow (RMSEflow) among different time delays were recorded under a certain injection protocol.
Results
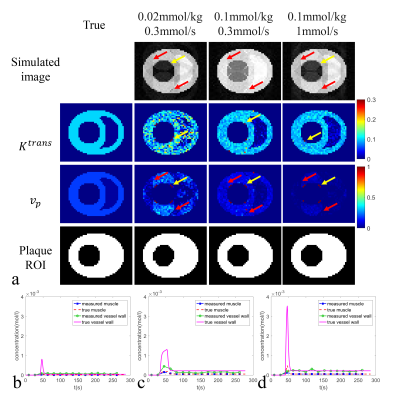
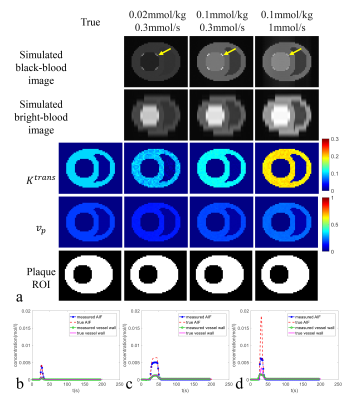
The mean RMSEflow of the black-blood DCE sequence benefitted a little bit from high injection dose and low effective injection rate (Fig.1a, points with the mean RMSEflow<0.4 are shown as red polygons). It was insensitive to the rest of the injection protocols and kept at a moderate level (around 0.5). On the contrary, the mean RMSEflow of the HOBBI sequence was sensitive to the injection protocol and showed an obvious decrease at the combination of high injection dose and low effective injection rate (Fig.1c, points with the mean RMSEflow<0.2 are shown as red polygons). For the SD of RMSEflow, black-blood DCE and HOBBI DCE both kept at a low level (mostly< 0.1), and were shown to be insensitive to the injection protocol (Fig. 1b&d).Black-blood DCE showed apparent artifacts caused by contrast variation during imaging not only on the simulated images, but also on the estimated vp map under three typical injection protocols (Fig. 2a, red arrows). More severe artifacts due to contrast variation were observed on the estimated vp maps under lower injection dose or higher effective injection rate (Fig.2a, red arrows). The flow artifacts (Fig.2a, yellow arrows) led to bias on the estimated Ktrans, vp map and affected the ROI selection of the plaque in the black-blood DCE (Fig.2a). No obvious contrast variation artifacts appeared on the HOBBI DCE, while flow artifacts showed on the simulated black-blood images in the HOBBI DCE (Fig.3a, yellow arrows), but they did not affect the plaque ROI generation and the estimation of Ktrans and vp (Fig.3a). Low injection dose resulted in low enhancement of the tissue (AIF, vessel wall and muscle, Fig.2b&Fig.3b) and lower image contrast to noise ratio (CNR) (especially on the estimated Ktrans map, Fig.2a&Fig.3a) both in the black-blood DCE and HOBBI DCE, while high effective injection rate led to severe underestimation of the enhancement curves (Fig.2d&Fig.3d).
Discussion and Conclusion
High injection dose (~0.1mmol/kg) with relative low effective injection rate (<0.3mmol/s) was recommended for the simulated black-blood and interleaved black-bright-blood sequences, which was consistent with the bright-blood DCE findings6. High injection dose should achieve efficient enhancement and better image CNR, while high effective injection rate may result in severe contrast variation artifacts in the black-blood DCE and high AIF peak, severe AIF underestimation in the HOBBI DCE. However, compared to bright-blood squence6, the simulated black-blood and interleaved black-bright-blood sequences showed insensitivity to the uncertain time gap between the contrast injection and the post-contrast image acquisition. For the black-blood DCE, this is due to the “black-blood” intrinsic property and the use of reference muscle with slow variation instead of AIF. For the interleaved black-bright-blood DCE, this is mainly achieved by high temporal resolution in the bright-blood module. In the future, more effort is needed for in-vivo studies to further validate the simulation results.Acknowledgements
None.References
- Chen H, Cai J, Zhao X, et al. Localized measurement of atherosclerotic plaque inflammatory burden with dynamic contrast-enhanced MRI. Magnetic resonance in medicine 2010;64:567-73.
- Gaens ME, Backes WH, Rozel S, et al. Dynamic contrast-enhanced MR imaging of carotid atherosclerotic plaque: model selection, reproducibility, and validation. Radiology 2013;266:271-9.
- Chen H, Ricks J, Rosenfeld M, Kerwin WS. Progression of experimental lesions of atherosclerosis: assessment by kinetic modeling of black-blood dynamic contrast-enhanced MRI. Magnetic resonance in medicine 2013;69:1712-20.
- Calcagno C, Vucic E, Mani V, Goldschlager G, Fayad ZA. Reproducibility of black blood dynamic contrast-enhanced magnetic resonance imaging in aortic plaques of atherosclerotic rabbits. Journal of magnetic resonance imaging: JMRI 2010;32:191-8.
- Wu T, Wang J, Song Y, et al. Homologous HOmologous Black-Bright-blood and flexible Interleaved imaging sequence (HOBBI) for dynamic contrast-enhanced MRI of the vessel wall. Magnetic resonance in medicine 2015;73:1754-63.
- Wang Y, Wang Y, Qi H, Liu X, Guo H, Chen H. The Effect of the Injection Dose, Rate and Concentration on Carotid Dynamic Contrast-Enhanced MRI: a Simulation Study. ISMRM; 2019; Montréal, QC, Canada. p. 5033.
- Fan Z, Xie J, He Y, et al. Black-blood dynamic contrast-enhanced carotid artery wall MRI with SRDIR preparation. Journal of Cardiovascular Magnetic Resonance 2013;15:P246.
Figures

Table 1. Parameters
of the simulated black-blood and
interleaved black-bright blood DCE sequences.

Fig. 1. The mean and the standard deviation (sd)
of the RMSEflow as
a function of the injection dose (mmol/kg)
and effective injection rate (mmol/s); a)
mean RMSEflow
of the black-blood DCE, points in the
red polygon: mean RMSEflow
< 0.4;
b) sd RMSEflow
of the black-blood DCE; c) mean RMSEflow of
the interleaved black-bright-blood DCE, points in the
red polygon: mean RMSEflow
< 0.2; b) sd RMSEflow of
the interleaved black-bright-blood DCE.

Fig. 2. Black-blood DCE-MRI a) Simulated images (cropped), estimated Ktrans map
(cropped, min-1),
estimated vp map (cropped), and auto-generated plaque ROI (cropped) under
three
typical injection protocols with their optimal
time delays (lowest RMSEflow),
and
compared with true Ktrans map, vp map,
and
plaque
ROI;
Measured
and true contrast concentration curves
(muscle and vessel wall) at
injection dose and effective injection rate = b)
0.02 mmol/kg, 0.3 mmol/s; c) 0.1 mmol/kg, 0.3 mmol/s; d) 0.1 mmol/kg, 1 mmol/s;
with their optimal time delays (lowest RMSEflow).

Fig. 3. HOBBI DCE-MRI a) Simulated images (cropped), estimated Ktrans map
(cropped, min-1),
estimated vp map (cropped), and auto-generated plaque ROI (cropped)
under
three typical injection protocols with their optimal
time delays (lowest RMSEflow),
and
compared with true Ktrans map, vp map,
and plaque ROI; Measured and true contrast concentration
curves (AIF and vessel wall) at injection dose
and effective injection rate = b) 0.02
mmol/kg,
0.3
mmol/s;
c) 0.1 mmol/kg,
0.3
mmol/s;
d) 0.1 mmol/kg,
1
mmol/s;
with their optimal time delays (lowest RMSEflow).