3260
A Novel Approach Using First-Pass Adjusted DTR-DCE-MRI (FAD) for Accurate Super-Spatial Resolution Brain Pharmacokinetic Parametric Mapping1DIIDS, University of Manchester, Manchester, United Kingdom, 2Salford Royal NHS Foundation Trust, Manchester Academic Health Science Centre, Manchester, United Kingdom
Synopsis
This study describes a new dual-injection, dual-temporal resolution (DTR) DCE-MRI mapping technique, which performs first-pass adjustment (FAD) of pre-bolus uptake curves using enhancement patterns measured from a main-dose, high-spatial resolution DCE acquisition. This new technique permits derivation of whole brain, super-spatial resolution kinetic parameter maps and its clinical applicability in vivo was assessed through application to retrospective DTR-DCE-MRI data from 12 NF2 patients undergoing Avastin therapy. Compared to the classical DTR-DCE-FDHS, method, baseline Ktrans derived using the FAD technique demonstrated superior ability in the prediction of 90 day volumetric response in Avastin treated NF2 related VS.
Introduction
A range of pharmacokinetic (PK) parametric maps can be generated from dynamic contrast-enhanced (DCE) MRI. High temporal (HT) resolution is required to achieve high accuracy, with resulting compromise in spatial resolution. Dual temporal resolution acquisition strategies (DTR), have been developed in the past decade (1, 2, 3). We are proposing a new DTR method, namely FAD, for achieving accurate PK mapping with super high spatial (HS) resolution. FAD uses enhancement patterns measured from HS DCE to make fine adjustment of the first pass of the prebolus concentration time courses of DTR. The purpose of this study is to assess the new method. To validate, we compared the results from FAD against standard method (1, 2) in an in-vivo study.Materials and Methods
Patient: The FAD method was retrospectively applied to DTR-DCE-MRI data from twelve consecutive patients with neurofibromatosis type II (NF2) related vestibular schwannoma (VS). Patients were treated with the anti-VEGF antibody Avastin. DCE-MRI data was acquired pre-treatment (day 0) and 3 months (day 90) following treatment.DTR-DCE-MRI data set comprised a low dose of contrast agent (CA = 0.02 mmol/kg), high-temporal resolution (Δt = 1 s, N =300 ) (LDHT), low-spatial resolution series (voxel size of 2.5×2.5×6.0 mm), and followed by a full CA (gadoterate meglumine) dose, high-spatial resolution (voxel size of 1×1×2 mm; Δt =10.1 s, N = 60) (FDHS) series (2) . Varying flip angle acquisitions were performed prior to the LDHT for native longitudinal relaxation rate (R1N) mapping.
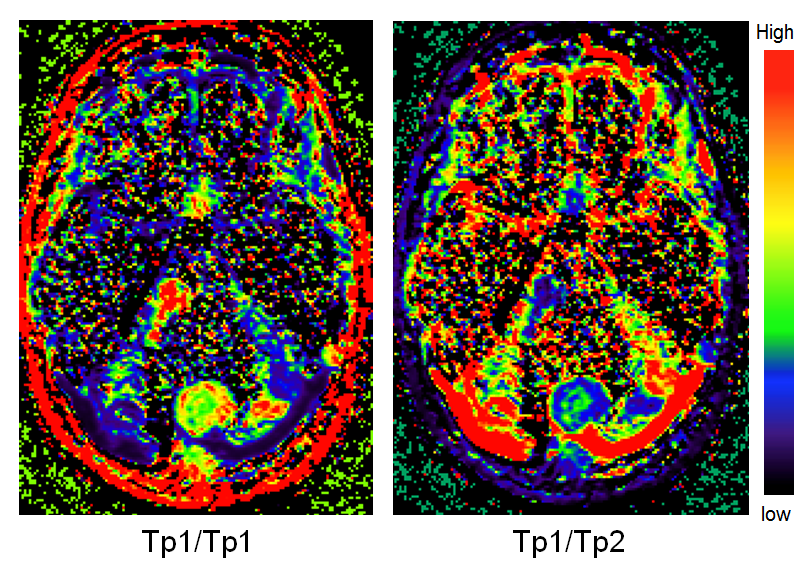
Data Analysis: Intra-subject longitudinal and cross-sectional co-registration was performed for all scans. The signal intensity-time curves from the LDHT and FDHS were converted to 4D CA concentration curves using maps of R1N. The co-registered HT CA concentration time course was then concatenated with later concentration time course obtained from the FDHS series, taking advantage that HT resolution is only required in the arterial phase (4). This concatenated HT arterial phase concentration time course is reconstructed pixel-by-pixel to a HS resolution through incorporation of two HS pixel-wise calibration ratios. The first ratio reflects the difference in the tissue concentration between the HT and HS at the time point used to concatenate them. The use of second ratio, Tp2/Tp1, is the key to the FAD. 3D HS maps of Tp1 and Tp2, representing the peaks of the 1st-pass and the washout phase respectively, were calculated from 4D FDHS-DCE. The 3D maps of Tp2/Tp1 are then used to make pixel-by-pixel adjustment of the 1st-pass of the concatenating C(t) before fitting to kinetic models.
Results
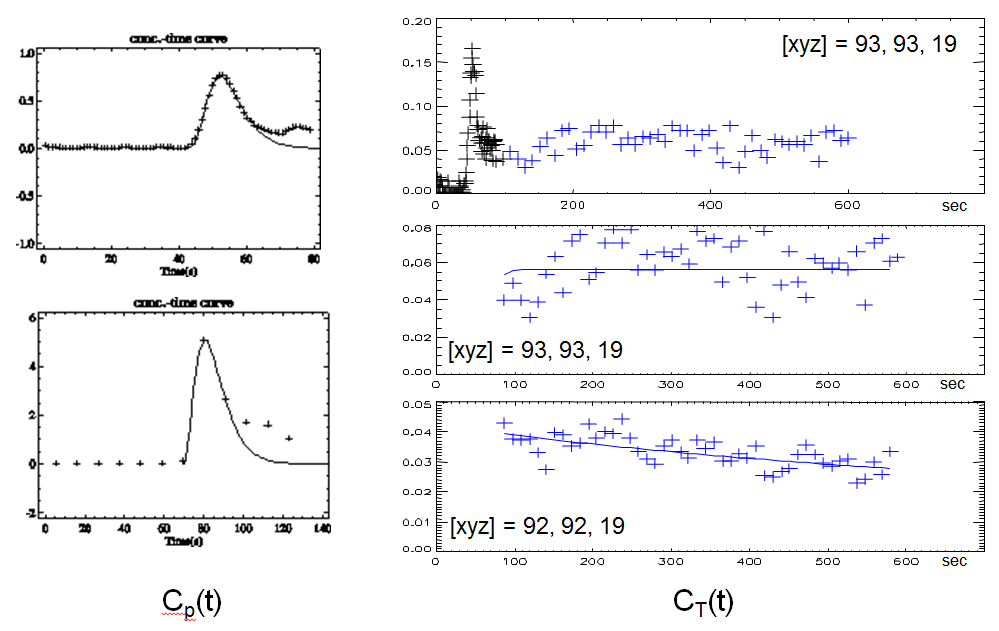
Figure 1 shows 1st-pass of C(t) from LDHT (top) and FDHS (bottom) in a vessel area. The right panels show C(t) of neighboring voxels with size of 1×1×2 mm in FDHS at the edge of a VS, which were well contained in a large 2.5×2.5×6.0 mm voxel of its pair, the LDHT. C(t) from FDHS demonstrated a typically different enhancement pattern. The right top panel shows a concatenated DTR C(t), where the early uptake, including 1st-pass and 1st-recirculation, form LDHT was concatenated to late part of FDHS, having had a plateau washout (middle panel). Washout in its neighboring voxel was faster (bottom panel). The 1st-pass of the C(t) curve from the HT large voxel, which covers both and more of other HS voxels, was consequently adjusted voxel-by-voxel to super high spatial resolution, using 3D HS Tp2/Tp1 ratio image as shown in Fig. 2.Figure 3 shows MR imaging from a patient with a large responsive right-sided VS and a smaller responsive left-sided tumor. Post-contrast axial Tl- and T2-weighted images show a complex cystic mass in the right cerebellopontine angle. Right panel shows kinetic maps of transfer constant Ktrans and plasma volume vp from FAD and LDHT. Whilst this intratumoral heterogeneity is difficult to visualize on the LDHT derived PK parameter maps, the FAD derived super-high resolution PK images demonstrate this cystic region with reduced Ktrans and vp values. FAD was applied to a group of NF2 patients.
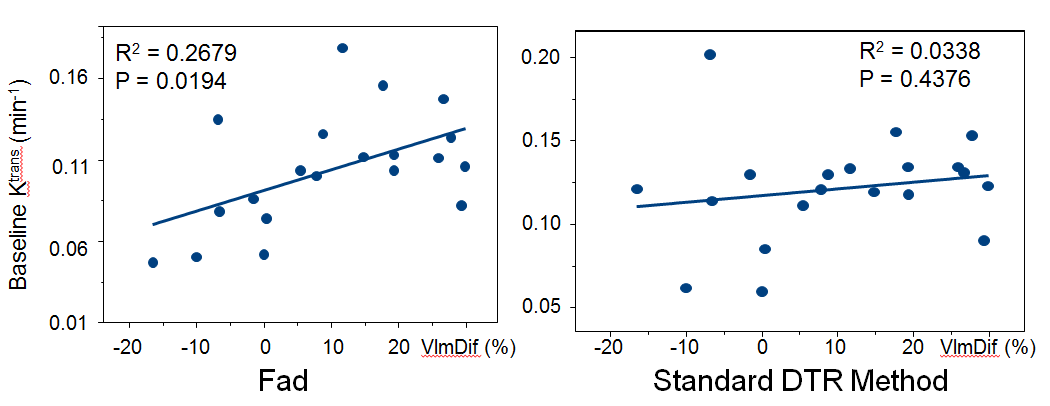
Figure 4 shows that the baseline Ktrans of VS measured before the anti-VEGF drugs were administrated are correlated with the reduction of the tumour volume after treatment (R2 = 0.2679, P = 0.0194). The baseline Ktrans calculated using the standard method shown no relationship and no capacity to predict volumetric change of VS responding to treatment (R2 = 0.0338, P = 0.4376). The Ktrans with FAD maintained the capacity to evaluate the efficacy of Avastin activity for NF2 related VS as previous reported (5, 6).
Discussion and Conclusions
Achieving high spatial resolution whole brain coverage with DCE-MRI has conventionally required compromising temporal resolution and thereby accuracy in kinetic parameter estimation. Previous attempts have been made to address this issue by incorporating high temporal and high spatial acquisitions of DTR (1, 2). With the standard approach, effect of time jitter due to inadequate sampling remained, when super-high spatial resolution, i.e. voxel size of 1×1×2 mm, was the target. We present a new DTR technique for deriving super-spatial resolution, whole brain coverage pharmacokinetic parameter maps from DTR-DCE-MRI data. This technique has been tested with an established dual injection protocol and the accuracy of kinetic parameters estimated using this new technique outperformed previous DTR methods in an in vivo study.Acknowledgements
No acknowledgement found.References
1. Kostler H, Ritter C, Lipp M, Beer M, Hahn D, Sandstede J. Prebolus quantitative MR heart perfusion imaging. Magn Reson Med 2004; 52: 296–299.
2. Li K-L, Buonaccorsi G, Thompson G, Cain JR, Watkins A, Russell D, et al. An improved coverage and spatial resolution-using dual injection dynamic contrast-enhanced (ICE-DICE) MRI: A novel dynamic contrast-enhanced technique for cerebral tumors. Magn Reson Med 2012; 68(2):452–62.
3. Jelescu IO, Leppert IR, Narayanan S, Araujo D, Arnold DL, Pike GB. Dual-temporal resolution dynamic contrast-enhanced MRI protocol for blood-brain barrier permeability measurement in enhancing multiple sclerosis lesions. J Magn Reson Imaging 2011; 33(6):1291-1300.
4. Fritz-Hansen T, Rostrup E, Søndergaard L, Ring PB, Amtorp O, Larsson HB. Capillary transfer constant of Gd-DTPA in the myocardium at rest and during vasodilation assessed by MRI. Magn Reson Med 1998; 40(6):922–9.
5. Li KL, Djoukhadar I, Zhu X, Zhao S, Lloyd S, McCabe M, et al. Vascular biomarkers derived from dynamic contrast-enhanced MRI predict response of vestibular schwannoma to antiangiogenic therapy in type 2 neurofibromatosis. Neuro Oncol 2016; 18(2):275–82.
6. Blakeley JO, Ye X, Duda DG, Halpin CF, Bergner AL, Muzikansky A, et al. Efficacy and biomarker study of Avastin for hearing loss resulting from neurofibromatosis type 2-associated vestibular schwannomas. J Clin Oncol 2016; 34(14):1669-75.
Figures