3259
Influence of different temporal resolutions by varying parallel imaging factors on DCE perfusion parameters studied in a phantom1Computer Assisted Clinical Medicine, Medical Faculty Mannheim, Heidelberg University, Mannheim, Germany
Synopsis
No uniform consensus on the optimal sampling resolution for quantitative DCE MRI exists. In order to increase the sampling resolution, accelerated parallel imaging techniques (PAT) can be used. The inter- and intra-measurement precision of the plasma flow (PF) was determined in a phantom depending on the sampling resolution (1.9-3.8s), achieved by varying the PAT factor (1-6). A significant influence of the PAT factors and the sampling resolution on the PF itself and the robustness and reproducibility of the fit could be observed, even with small sampling rates as recommended in literature.
Introduction
The arterial input function (AIF) has a strong influence on the results of quantitative DCE MRI using pharmacokinetic modeling [1]. Fast and stable approaches such as the population average method or the reference region method do not account for pathophysiological properties of the arteries of the individual patient's organ to be studied, such as stenosis. Therefore, if possible, it is preferable to measure the AIF directly. One parameter that affects the AIF and the goodness of fit is the temporal resolution Ts. It is commonly recommended that Ts should be smaller than 10s [2]; yet, no uniform consensus on the optimal Ts exists [3]. In order to increase the sampling resolution, accelerated parallel imaging techniques (PAT) can be used. However, a compromise between acquisition speed and image quality must always be found, since the signal-to-noise-ratio (SNR) decreases with greater parallelization. Here, we determined the inter- and intra-measurement precision of the plasma flow (PF) in a customized two-compartment perfusion phantom for quantitative DCE MRI depending on the sampling resolution. Different Ts were achieved by varying the PAT factor.Materials and Methods
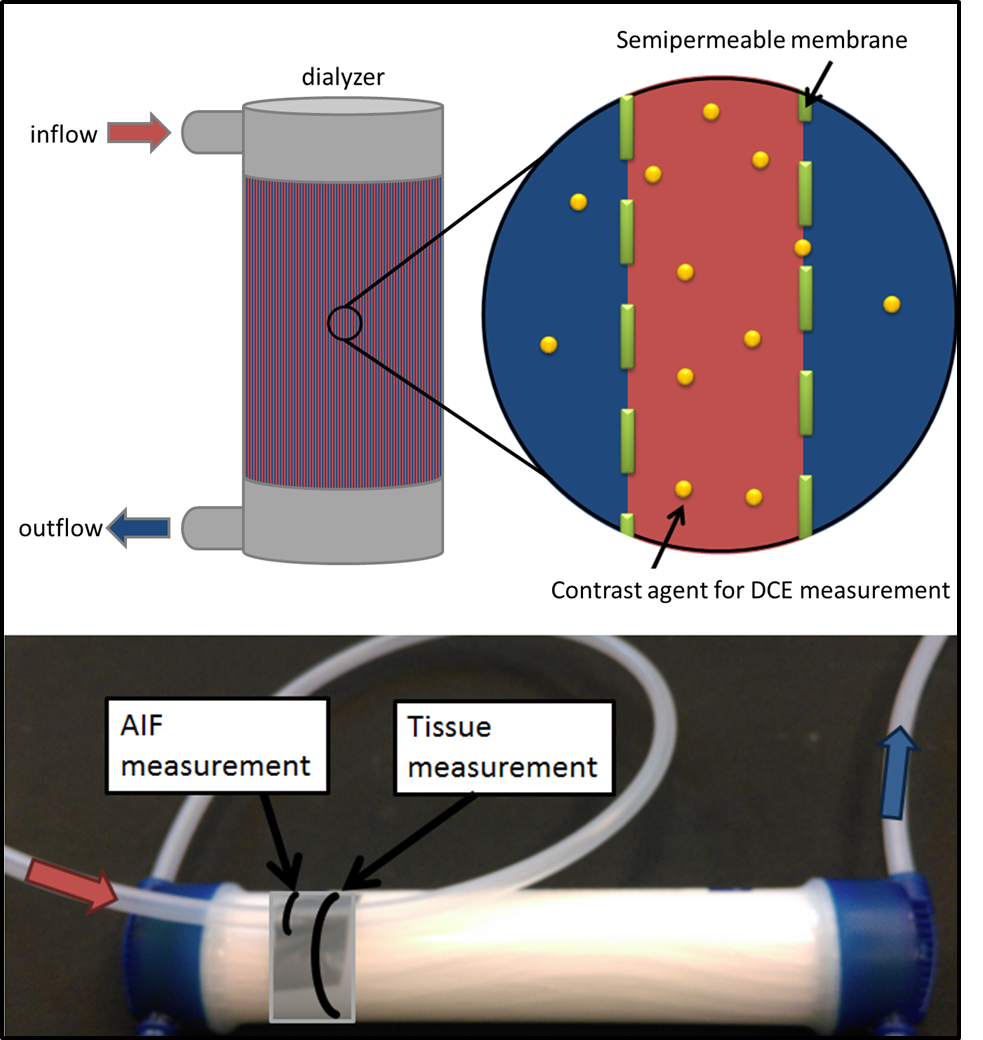
PhantomThe phantom is constructed from a dialysis filter (Helixone FX800, Fresenius Medical Care, Germany) to imitate tissue characteristics with fibers (diameter = 200µm) close to the capillary size. The construction principle of the dialyzer enables the transfer of contrast agent (CA) through a semipermeable membrane (pore diameter = 1.8nm) from within the fibers to the surrounding space and thus provides two compartments (Fig. 1). Water (v=20ml/s, typical blood flow velocity in larger human arteries [4]) and automatically injected CA (Dotarem®, Guerbet, France, (1ml CA and 10ml NaCl)) were pumped through the phantom with an injection rate of 1ml/s. A tube in front of the phantom inlet served as an artificial artery where the first pass of CA signal was measured and used to determine the AIF.
Imaging Protocol
DCE MRI data were acquired using a 3T scanner (Magnetom Skyra, Siemens Healthineers, Germany) and a 15-channel phased-array knee coil (Siemens Healthineers, Germany). A gradient-echo imaging sequence (TWIST) with the following scan parameters was used: TR = 3.8ms, TE = 1.4ms, flip angle (FA) = 15°, matrix size = 128×128×80mm3, spatial resolution = 1×1×4mm3. The total measurement time for each measurement was 1 minute, whereby the different temporal resolutions Ts = [3.8/2.7/2.3/2.1/2.0/1.9]s were achieved. These corresponded to parallel imaging factors PAT = [1/2/3/4/5/6].
Analysis
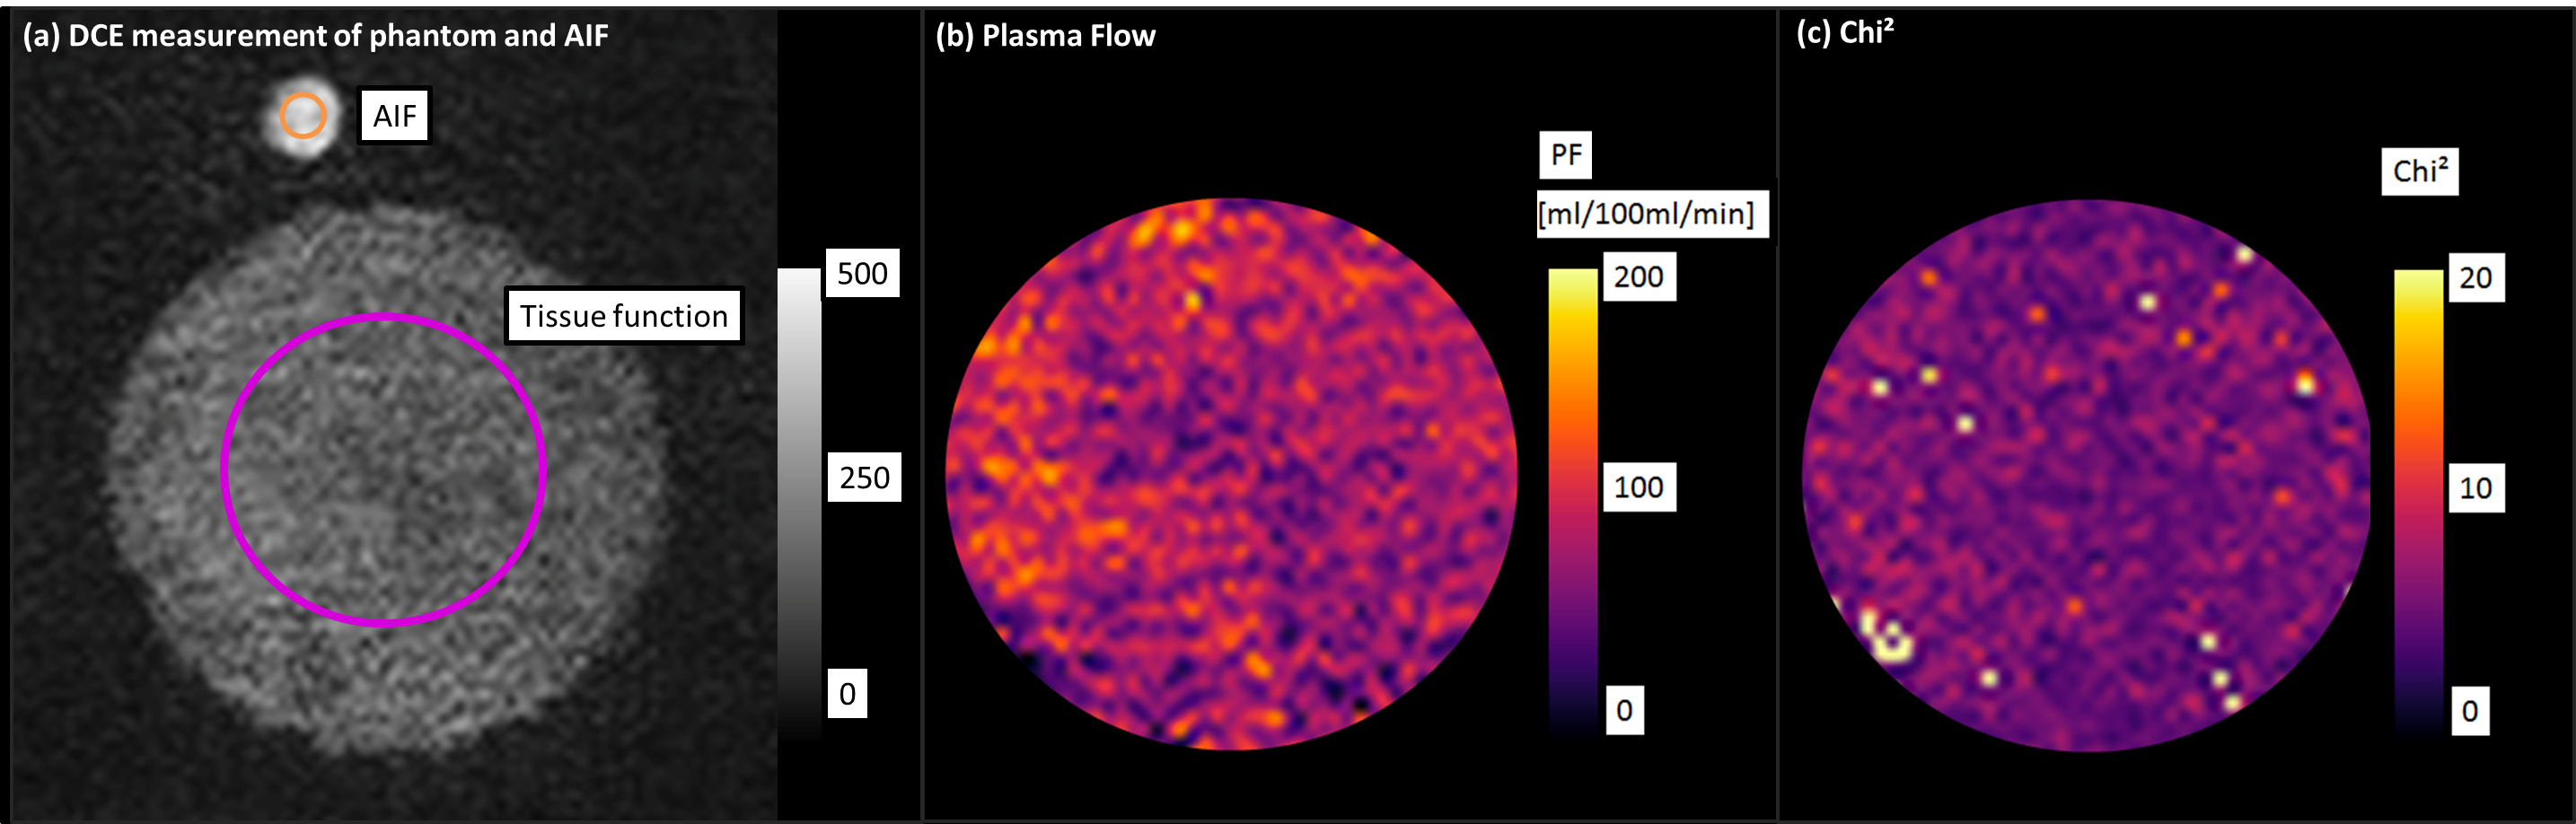
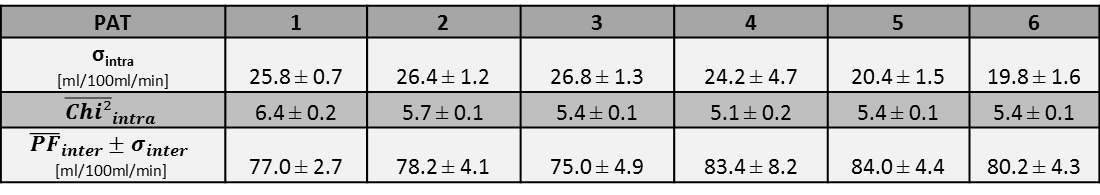
The data analysis was based on a manually selected ROI in the AIF and a ROI in the phantom that remained constant for all measurements (Fig. 2a). The two-compartment exchange model with four free parameters was used for pixel-wise determination of PF using Horos (horosproject.org, USA) and the corresponding perfusion plugin [5]. (1) The intra measurement precision was determined by the standard deviation σintra of the PF in each ROI of the pixel-wise fit such as the mean fit quality $$$\mathrm{Chi}^{2} _{intra}$$$. (2) Measurements were repeated five times for each PAT setting to determine the inter measurement precision by the standard deviation of the mean values $$$\overline{\mathrm{PF}}_{inter} \pm \sigma_{inter}$$$ among each other. Statistical analysis was performed for all above mentioned quantities with an unpaired t-test (p<0.05) in Matlab (Matlab 2013a, The Mathworks, USA).
Results
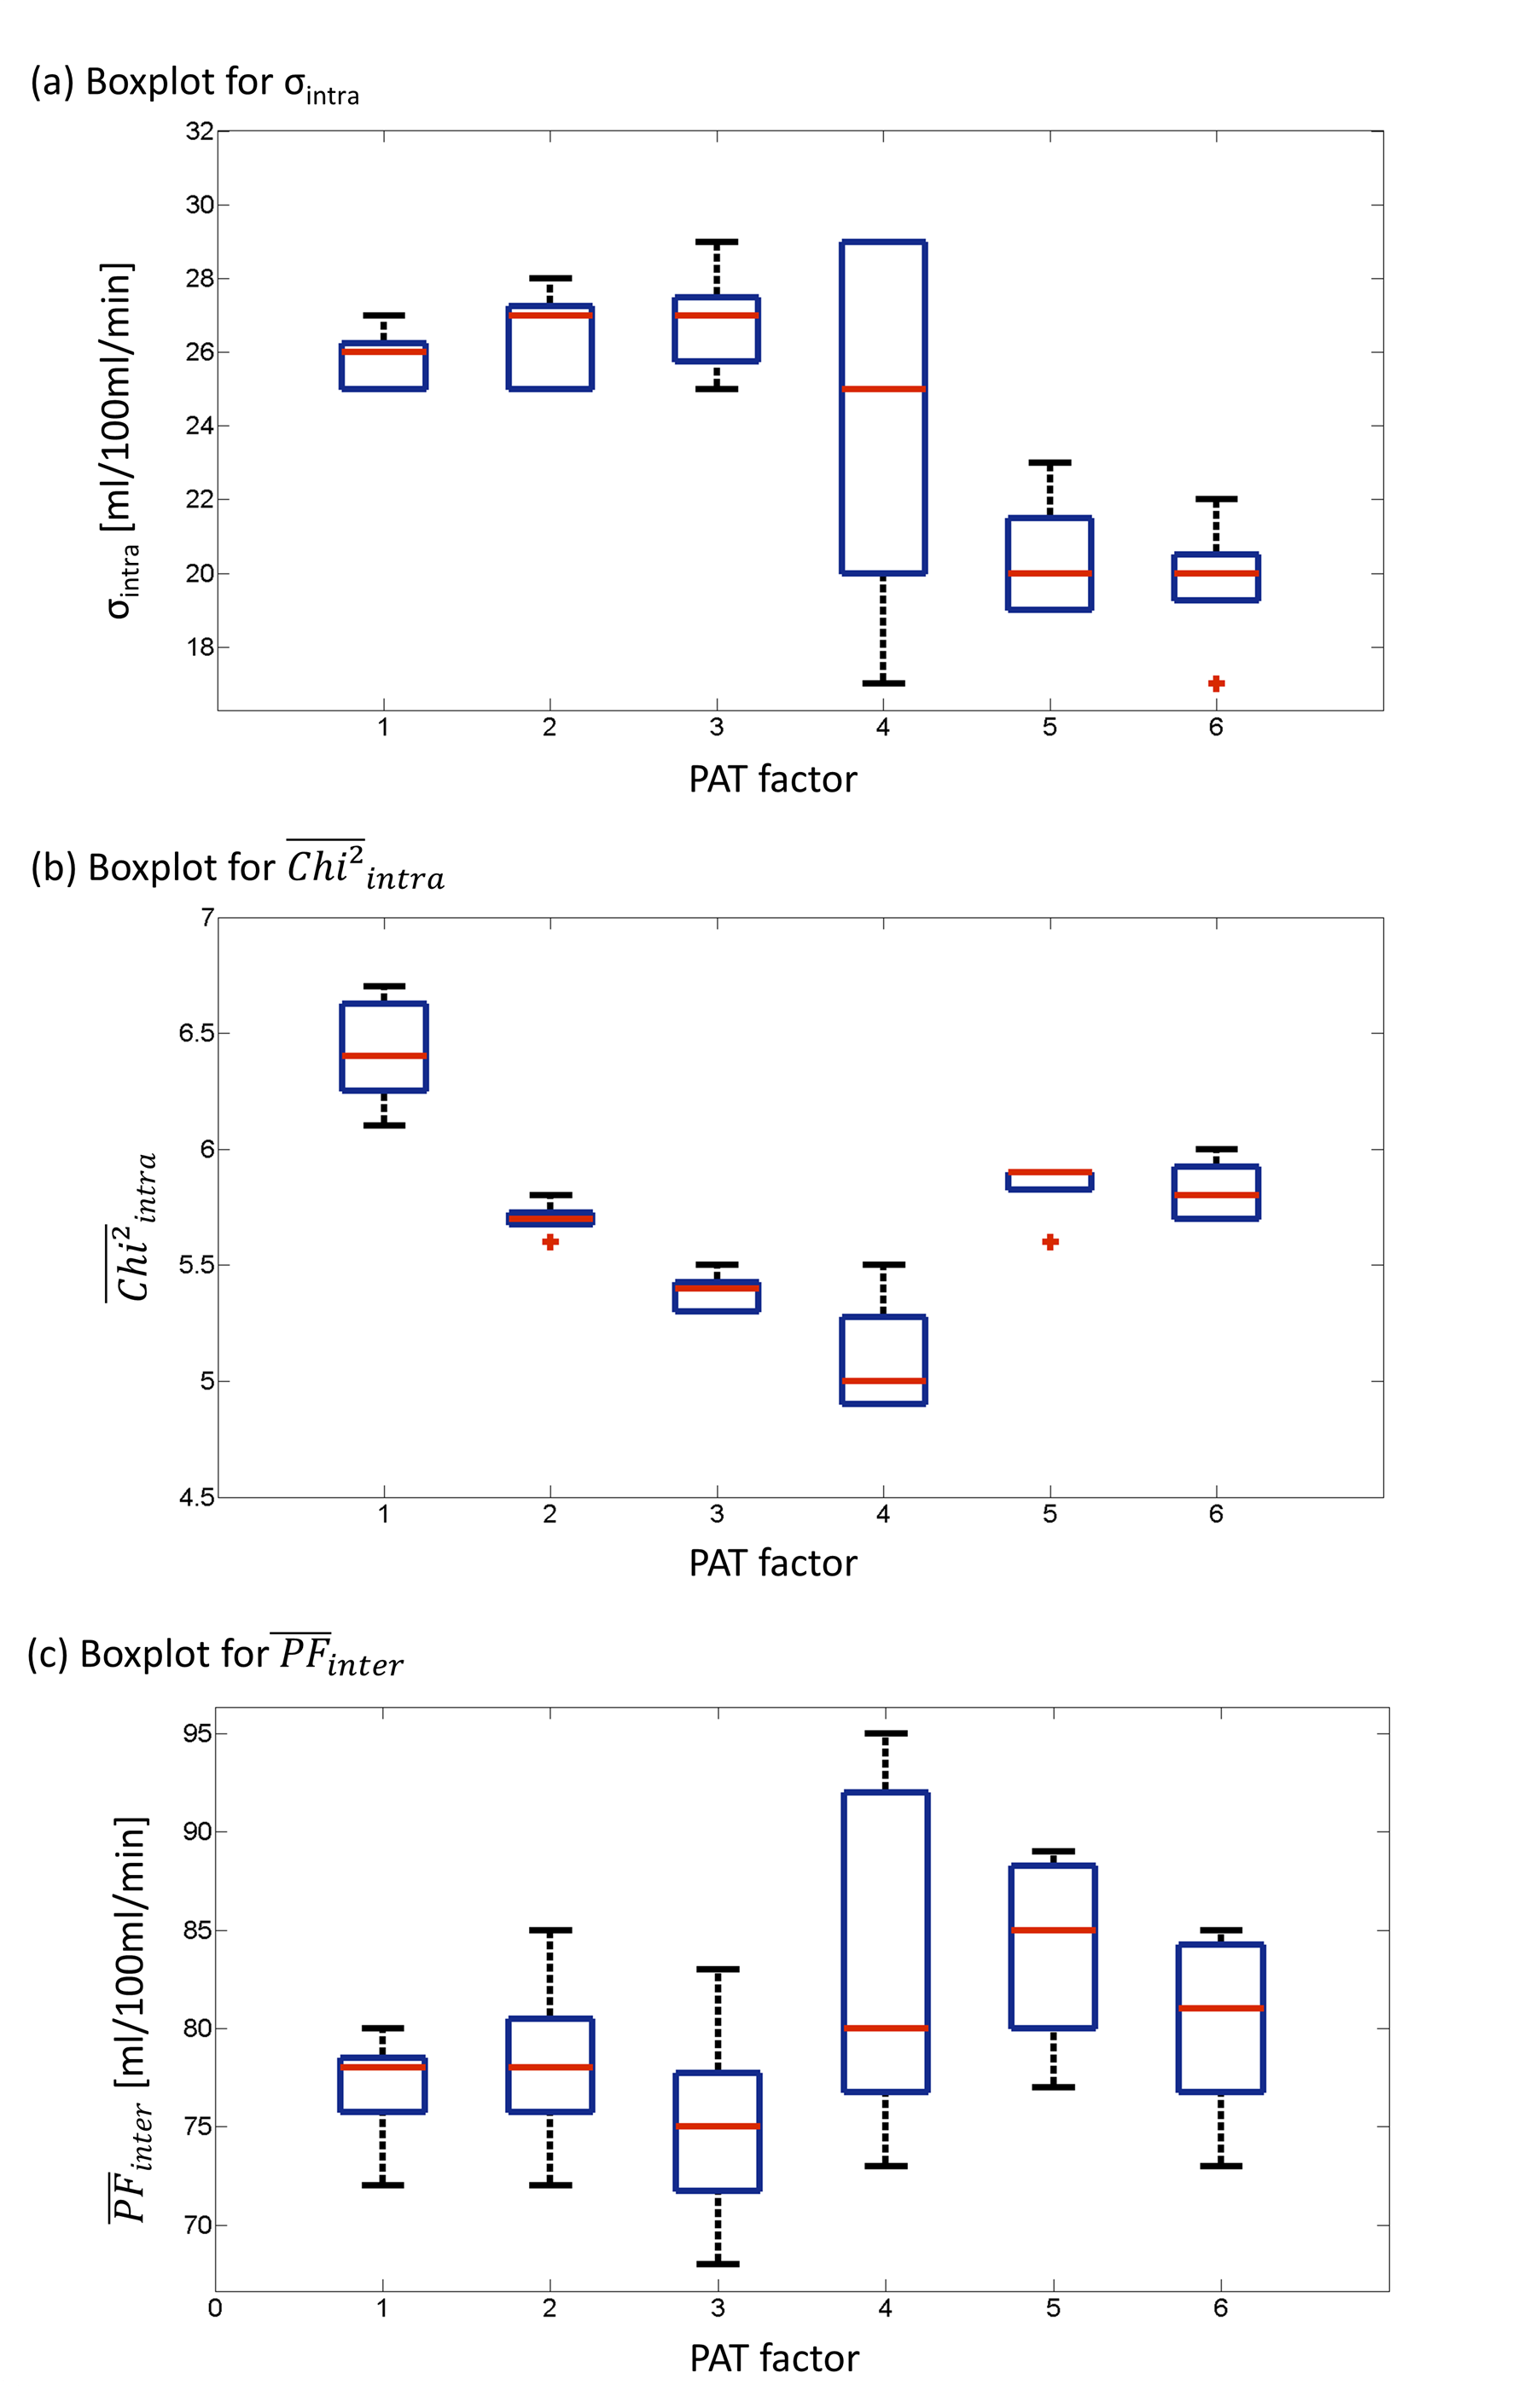
Exemplary fit maps for PF and resulting Chi2 are shown in Fig 2b,c.(1) Intra measurement variability: For each individual measurement, σintra of the PF within the phantom and the fit quality $$$\mathrm{Chi}^{2} _{intra}$$$ were calculated and are depicted in a boxplot (Fig. 3a, b) to determine the robustness and performance of the fit. The statistical evaluation showed that σintra of the PF is significantly smaller for PAT=5 and PAT=6. For $$$\mathrm{Chi}^{2} _{intra}$$$ the values for PAT=1 are significantly higher.
(2) Inter measurement variability: The median and interquartile range of the mean values $$$\overline{\mathrm{PF}}_{inter} $$$ within the measurement series are shown in the box plot (Fig. 3c). The unpaired t-test reveals a significant lower value for PAT=1 and PAT=3 measurements compared to PAT=5, where also a slightly elevated median is noticeable in the boxplot.
Discussion
Reproducible values for the PF in a human like phantom can be achieved with the applied pharmacokinetic model [6]. This allowed to perform a patient-independent quantitative protocol review which examined the influence of parallel imaging and thus the sampling resolution on AIF and tissue function. A significant influence of PAT and TS on the PF could be observed. Smaller PAT factors seem to lead to a lower fit quality whereas higher PAT factors showed lower standard deviations within a ROI. The higher sampling resolution in this cases will possibly compensate for the SNR loss from parallel imaging. A comparison with a gound truth would be necessary in the next step in order to better understand the significant difference between the mean values of the five measurement series. Furthermore, the sampling resolutions in this study were very high and still within the recommended literature range. It remains to be investigated how it compares to an even slower sampling resolution.Conclusion
Significant differences were observed in both intra- and inter-measurement variability, which makes clear that the results for quantitative perfusion parameters depend on modifications of the PAT settings and TS even within the recommended literature range.Acknowledgements
This research project is partly supported of the Research Campus M2OLIE funded by the German Federal Ministry of Education and Research (BMBF) within the Framework “Forschungscampus: public-private partnership for Innovations” under the funding code 13GW0388A.References
[1] Luypaert R, Sourbron S, Makkat S, de Mey J. Error estimation for perfu-sion parameters obtained using the two-compartment exchange model indynamic contrast-enhanced MRI: a simulation study.Phys Med Biol.2010;55:6431–6443.
[2] DCE‐MRI Technical Committee. DCE‐MRI Quantification Profile, Quantitative Imaging Biomarkers Alliance. Version 1.0. Publicly Reviewed Version. QIBA. 2012. Available from RSNA.org/QIBA
[3] Ingrisch M, Dietrich O, Attenberger UI, et al. Quantitative pulmonaryperfusion magnetic resonance imaging: influence of temporal resolutionand signal-to-noise ratio.Invest Radiol. 2010;45:7–14.
[4] Nichols, Wilmer W., Michael F. O'Rourke, and M. McDonald’s. "Blood flow in arteries." Lea and Fiberger, Philadelphia, PA (1990): 270-281.
[5] F. Zöllner, M. Daab, S. Sourbron, L. Schad, S. Schoenberg and G. Weisser. An open source software for analysis of dynamic contrast enhanced magnetic resonance images: UMMPerfusion revisited. BMC Med Imaging, 2016, 16 (7), pp.1-13
[6] Gaa T, Schad L and Zöllner F., Feasibility Study of a Dialyzer as a Multi-Compartment Perfusion Phantom for Microvascular Tracer Kinetic Modelling. Proc. Int. Soc. Magn. reson. Med. , Honolulu. HI. USA , (2017) 25, p.1922 .
Figures