3258
Perfusion Estimates of Fast Dynamic Contrast Enhanced MRI Correlates with Dynamic Susceptibility Contrast in Brain Metastases Follow-up1Centre d’imagerie moléculaire de Sherbrooke, Département de médecine nucléaire et radiobiologie, Université de Sherbrooke, Sherbrooke, QC, Canada, 2Département radiobiologie diagnostique, Université de Sherbrooke, Sherbrooke, QC, Canada, 3Service de neurochirurgie, Département de chirurgie, Université de Sherbrooke, Sherbrooke, QC, Canada, 4MR Clinical Science, Philips Healthcare Canada, Markham, ON, Canada
Synopsis
Perfusion MRI is routinely used for brain tumor diagnosis and treatment follow-up. This work compares the performance of the standard dynamic susceptibility contrast sequence against a new fast dynamic contrast-enhanced sequence for brain metastasis follow-up after stereotactic radiosurgery. This new sequence enables the simultaneous measurement of blood brain barrier permeability that could help differentiate tumor recurrence and pseudo-progression. Our preliminary results show a correlation between relative cerebral blood volume estimates from both methods. A trend towards significance after analysis of thirteen lesions is expected to reach significance after inclusion of the remainder of our cohort.
Introduction
The follow-up after stereotactic radiosurgery is challenging because of the occurrence of pseudo-progression (PP) or radiation necrosis months to years after treatment. PP and tumor recurrence (TR) are almost identical on conventional MRI. Perfusion imaging with $$$T_2^*$$$-weighted dynamic susceptibility contrast (DSC) sequences have become a standard for treatment follow-up. DSC data are analyzed to map the cerebral blood volume (CBV); the lesion type is identified from the threshold of the relative CBV ratio (rCBV) between the suspicious lesions and their contralateral normal white matter.1 Fast dynamic contrast-enhanced (DCE) sequences can also measure perfusion.2,3 DCE $$$T_1$$$-weighted enhancement enables the precise measurement of blood brain barrier permeability, which was shown to add value in the differentiation of TR and PP.4,5 However, DCE is scarcely used for perfusion imaging because of its limited enhancement during the first pass of the contrast agent. In this work, we investigate whether rCBV values correlate when measured by both methods. We further compare the ability of standard DSC parameters and pharmacokinetic parameters fitted on DCE data to differentiate between TR and PP.Methods
Cohort: This study was approved by the institutional ethics committee. Results are shown for eight brain metastasis patients that were recruited when their standard clinical follow-up indicated a lesion progression of undetermined type. The final diagnosis of the thirteen lesions was based on the clinico-radiologic follow-up with histopathology validations for the four lesions for which it was available. We identified six TR, three PP and four non-suspicious lesions. Lesions and contralateral white matter regions of interest (ROI) were manually segmented on a high-resolution contrast-enhanced T1-weigthed image. ROIs were reviewed by a radiology resident. Affine transforms from image registration (SPM12) were used to apply these ROIs to the DSC and DCE maps.Acquisition: Imaging was performed on a Philips Ingenia 3.0 T scanner with a 32-channel head receiver coil. A $$$T_1$$$-weighted spoiled gradient-echo sequence was designed for DCE (TE = 1.85 ms; TR = 4 ms; flip angle = 9.2°; FOV = 220 x 165 x 90 mm³; acquired spatial resolution = 2.3 x 2.3 x 2.3 mm³; reconstructed images matrix = 96 x 96 x 39; SENSE factors = 2.3 x 1.2; time resolution = 2.0 s; viewsharing keyhole with 10 s footprint). Dynamic acquisition duration was split in two scans of 4 minutes and 1 minute, covering a total duration of about 10-15 minutes, and a half dose (0.05 mL/kg) of gadobutrol was injected starting at 60 s. This injection served as the DSC acquisition pre-dose. A $$$T_2^*$$$-weighted multi‐slice 2D single‐shot EPI gradient echo sequence was used for DSC (TE = 30 ms; TR = 1600 ms; flip angle = 60°; FOV = 224 x 224 x 145 mm³; acquired spatial resolution = 2.3 x 2.3 x 5 mm³; reconstructed images matrix = 128 x 128 x 28; SENSE factor = 2.3). Dynamic acquisition duration was 4 minutes with a full dose (0.1 mL/kg) injection of gadobutrol starting at 48 s.
Processing: DSC perfusion analysis was performed with the vendor’s postprocessing package (Neuro T2* Perfusion, R5.3.1) using the Gamma Variate Fitting algorithm. DCE data analysis was performed with MATLAB R2016a (MathWorks, Natick, MA). Arterial input function was approximated from venous voxels of the superior sagittal sinus; their concentration curves were fitted with the complex-form signal equation as described by Simonis et al.,6 but modified to consider the quadratic relaxivity of blood. Three pharmacokinetic models7 were considered to measure cerebral blood volume fractions (CBV), transfer constants ($$$K^\textrm{Trans}$$$), and distribution volumes ($$$v_e$$$):
- One parameter vascular fraction model (CBV), with the DCE dataset limited to the duration of the DSC acquisition;
- Two parameters irreversible extended Tofts-Kety model (CBV, $$$K^\textrm{Trans}$$$), with the DCE dataset limited to the duration of the first DCE scan; and
- Three parameters extended Tofts-Kety model (CBV, $$$K^\textrm{Trans}$$$, $$$v_e$$$), with the complete DCE dataset.
Results and Discussion
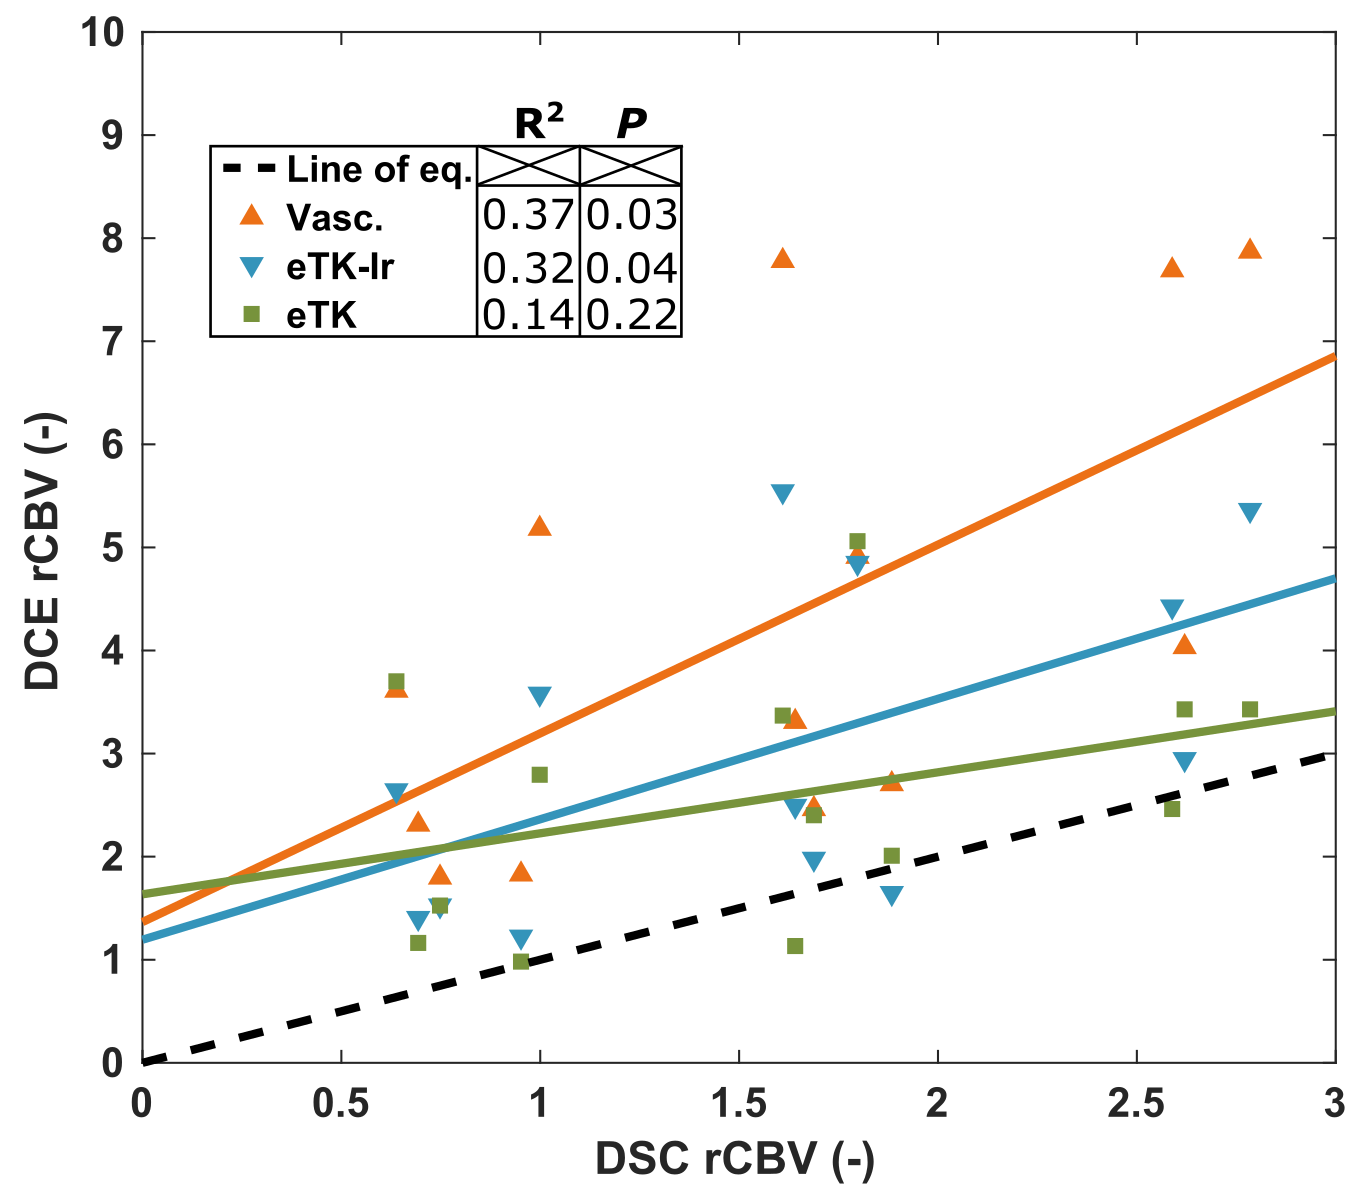
Figure 1 shows the correlation between the DCE parameters and DSC rCBV for all lesions. The only DCE parameters that correlates significantly with DSC-rCBV are the rCBVs computed with the vascular and eTK-Ir models. The vascular fraction model provides the highest coefficient of determination of 0.37. Absolute CBV values do not correlate with DSC rCBV values (data not shown), confirming that normalization by the contralateral WM is essential to reproduce the DSC metrics. Fig. 2 shows the parameters for patients with confirmed TR or PP. DCE-rCBV is the most promising parameter for differentiating lesion type. The results presented here are preliminary (eight patients out of thirty) - P values are provided only as an early indication for this small preliminary cohort size.Conclusion
Our preliminary data suggests a correlation between rCBV from DCE and DSC. DCE based rCBV also shows potential to differentiate between TR and PP. However, additional data will determine whether additional parameters of DCE, alone or in combination, can increase the diagnostic accuracy.Acknowledgements
This work was supported by a grant from the Fonds de recherche du Québec (FRQ)-Nature et technologie (2018-PR-206157). B.B.M. acknowledges a scholarship from the National Sciences and Engineering Research Council of Canada.References
1. Kwee RM, Kwee TC. Dynamic susceptibility MR perfusion in diagnosing recurrent brain metastases after radiotherapy: A systematic review and meta-analysis. J Magn Reson Imaging. 2019 [Epub ahead of print].
2. Larsson HBW, Courivaud F, Rostrup E, Hansen AE. Measurement of brain perfusion, blood volume, and blood-brain barrier permeability, using dynamic contrast-enhanced T1-weighted MRI at 3 tesla. Magn Reson Med. 2009;62:1270-1281.
3. Sourbron S, Ingrisch M, Siefert A, Reiser M, Herrmann K. Quantification of cerebral blood flow, cerebral blood volume, and blood-brain-barrier leakage with DCE-MRI. Magn Reson Med. 2009;62:205-217.
4. Koh MJ, Kim HS, Choi CG, Kim SJ. Which is the best advanced MR imaging protocol for predicting recurrent metastatic brain tumor following gamma-knife radiosurgery: focused on perfusion method. Neuroradiology. 2015;57:367-376.
5. Knitter JR, Erly WK, Stea BD, et al. Interval change in diffusion and perfusion mri parameters for the assessment of pseudoprogression in cerebral metastases treated with stereotactic radiation. Am J Roentgenol. 2018;211:168-175.
6. Simonis FFJ, Sbrizzi A, Beld E, Lagendijk JJW, van den Berg CAT. Improving the arterial input function in dynamic contrast enhanced MRI by fitting the signal in the complex plane. Magn Reson Med. 2016;76:1236-1245.
7. Ewing JR, Bagher-Ebadian H. Model selection in measures of vascular parameters using dynamic contrast-enhanced MRI: Experimental and clinical applications. NMR Biomed. 2013;26:1028-1041.
Figures