3256
Simulation study for investigating the reliability of susceptibility mapping for the superior sagittal sinus from single echo 3D GRE phase1Department of Electrical & Electronic engineering, Yonsei University, Seoul, Korea, Republic of, 2Department of Radiology, The Catholic University of Korea, Seoul, Korea, Republic of, 3Radiology, The Catholic University of Korea, Seoul, Korea, Republic of
Synopsis
Quantitative Susceptibility Mapping (QSM) is a technique to describe local susceptibility distribution in the human body . Especially, QSM has the potentials to provide oxygen metabolic information of the venous structure in the brain such as dural sinuses. Among the group of this sinuses, the superior sagittal sinus (SSS) often have been investigated in, neurovascular researches such as Parkinson's disease, headache and stroke . However, the SSS of the susceptibility mapping are often eroded in the conventional QSM pipeline. In this study, we investigate the reliability of QSM for the SSS from single echo 3D GRE phase using the simulated phase data.
Introduction
Quantitative Susceptibility Mapping (QSM) is a technique to describe local susceptibility distribution in the human body [1]. Especially, QSM has the potentials to provide oxygen metabolic information of the venous structure in the brain such as dural sinuses. Among the group of this sinuses, the superior sagittal sinus (SSS) often have been investigated in, neurovascular researches such as Parkinson's disease, headache and stroke [2]. However, the SSS regions of the susceptibility mapping are often eroded in the conventional QSM pipeline. This is because the SSS erosion occurs in the process of masking to remove the noisy phase information between the brain parenchyma and skull. In addition, even though the mask includes the SSS completely, it is difficult to assure the accuracy of the SSS susceptibility estimation. In this study, we investigate the reliability of QSM for the SSS from single echo 3D GRE phase using the simulated phase data.Methods
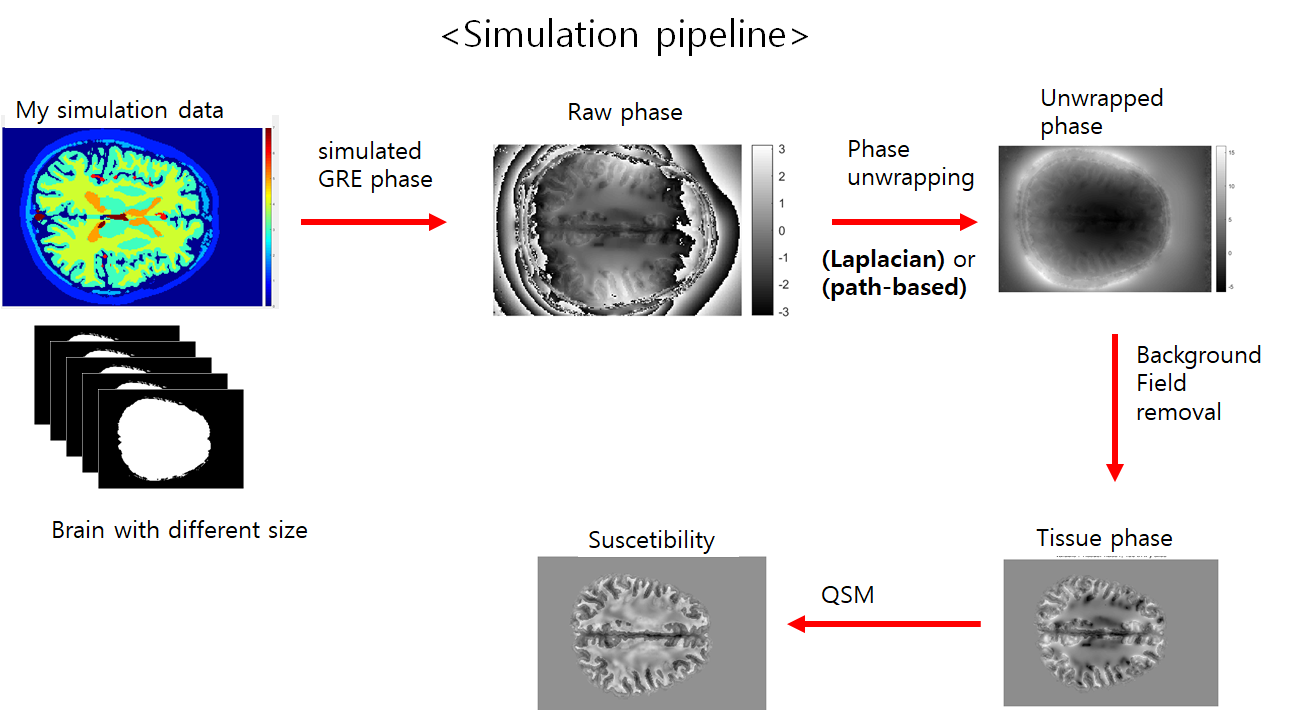
We obtained 3D T1-weighted images (MPRAGE), phase contrast venography, and 3D GRE data (TR/TE = 28/20 ms) from a healthy volunteer at 3T MRI. All three images were obtained with isotropic 1mm voxelsizes. For B0 field simulation, the brain subregions were segmented from 3D T1-weighted images using Freesurfer software. The SSS regions were added to the Freesurfer results using the thresholded PC venography images. Using the segmented mask, we assigned susceptibility values of -8800, -8970, … ,and -9040 ppb to WM, GM, … , and CSF regions, respectively. Then, we computed the field perturbations from this susceptibility distribution maps and generated phase images for TE = 20 ms at 3T. Simultaneously acquired 3D GRE magnitude images were used for the magnitude of the simulated GRE data. Lastly, random Gaussian noises were added to the simulated GRE images.For four different SSS susceptibility values (150, 300, 450, and 600 ppb), we investigated the effects of the different phase unwrapping methods and mask sizes for QSM processing. Firstly, the Laplacian-based and path-based phase unwrapping methods were tested for investigating the effects on the resulting SSS susceptibility values. For background phase removal and dipole inverion, V-SHARP and STAR-QSM algorithms were used for all experiments in this study. From the resulting QSMs, the mean and standard deviation values were calculated from the SSS regions. Second, we investigated the effects of different mask sizes on the estimation of the SSS susceptibilities. Pre-segmented information about the simulation data is used to create initial mask that include the SSS completely. And then, the experiment was performed by dilatating the mask size by from 1 voxel to 5 voxels. In addition, for actually acquired 3D GRE data from a same subject, QSM process was performed.
Results & Discussion
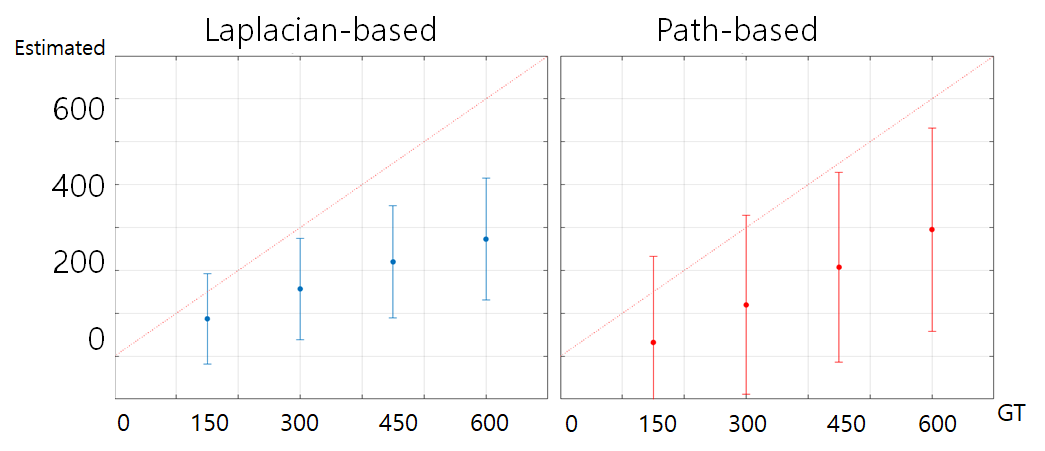
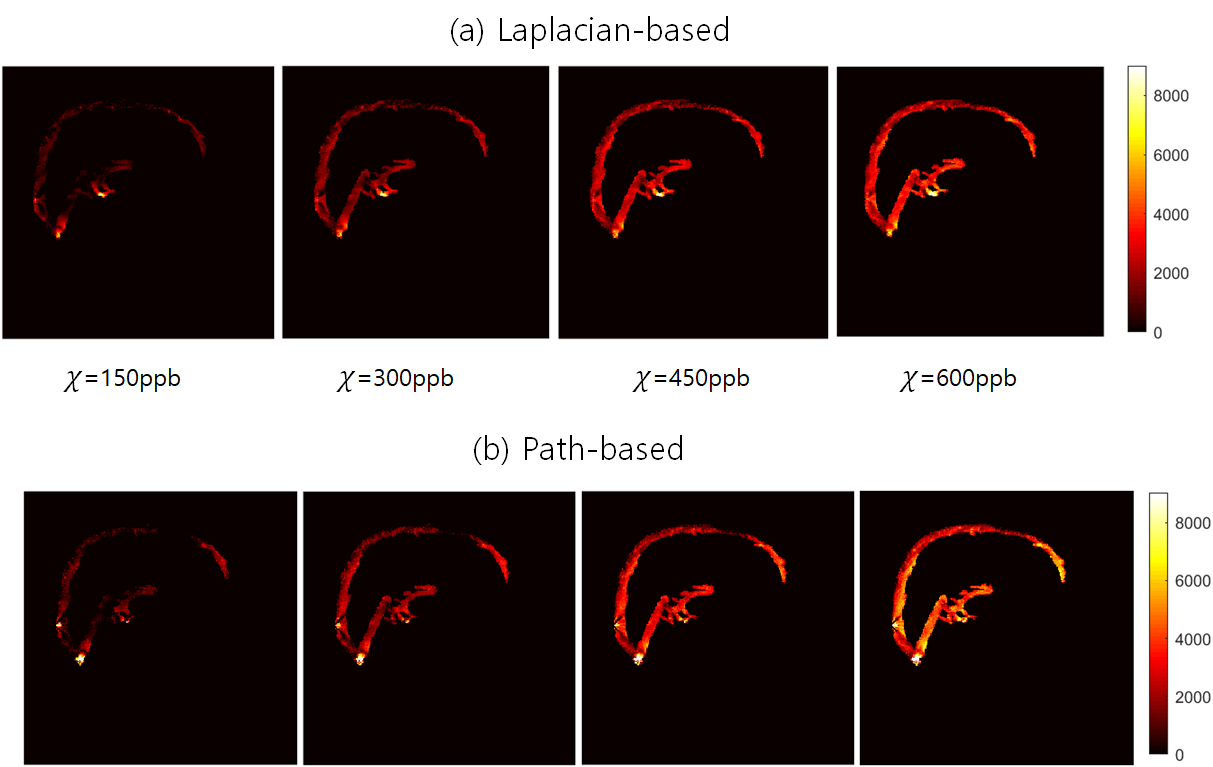
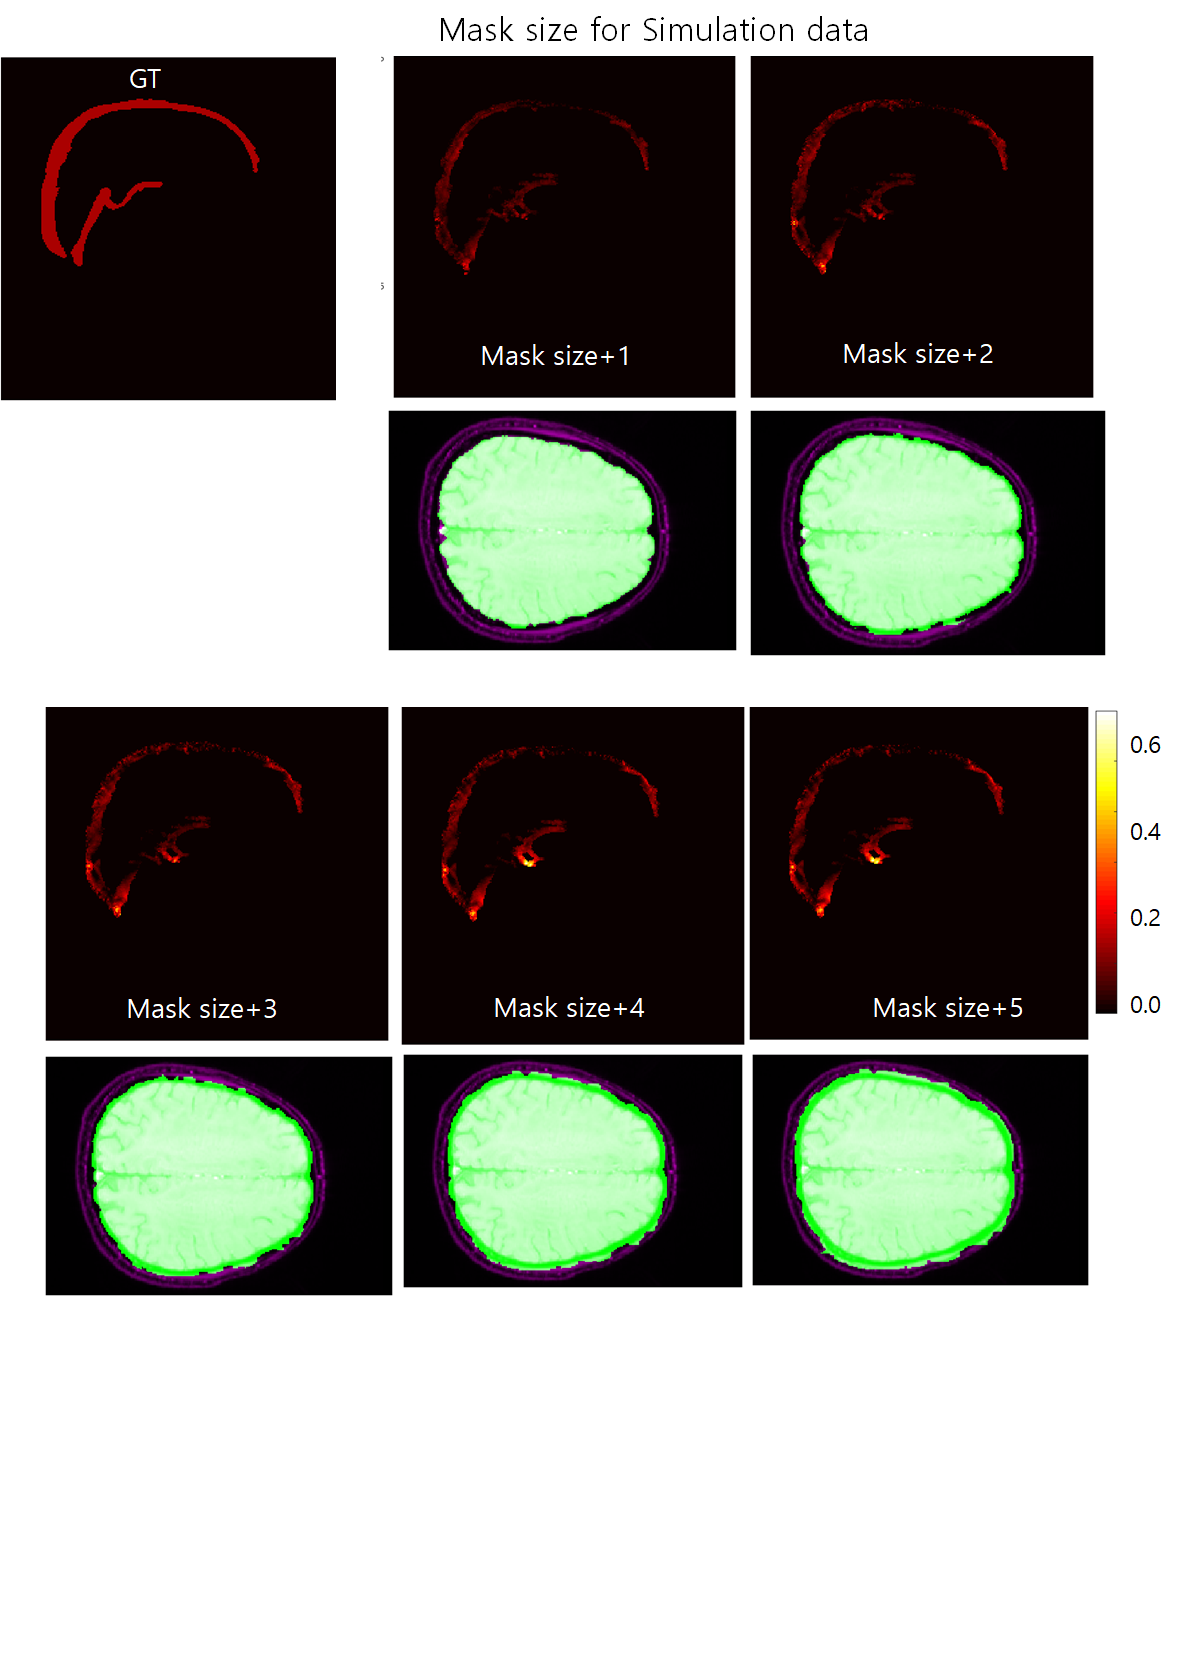
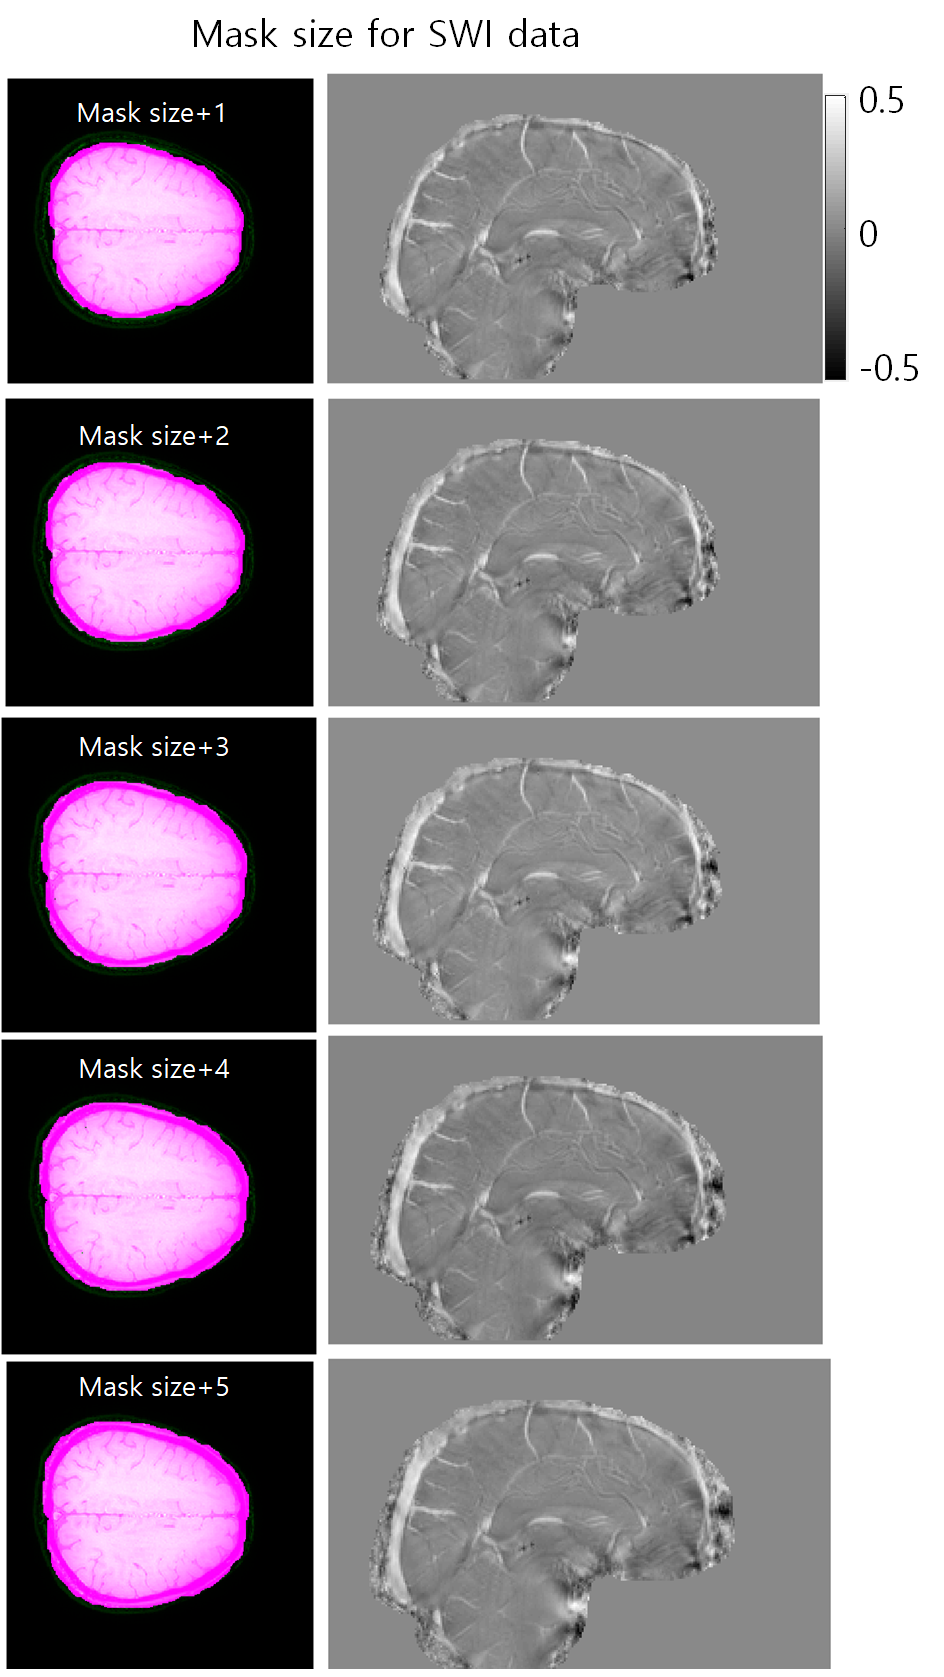
The numerical simulation results of two unwrapping methods are shown in figure 2. The results showed that the linearity between the ground truth and the estimated values was quite good, but overall underestimation was observed for both methods. In figure 3, we can see that the susceptibilities of the inner straight sinus regions are more stable than those of the SSS regions. In addition, the results showed that the SSS susceptibility values are highly underestimated at the top edge of the brain regions. Figure 4 and 5 shows the effects of different mask sized on the SSS susceptibility values for the simulation and the actual GRE data, respectively. In simulation data, the larger the size of the mask, the worse the QSM of the SSS regions. For actual 3D GRE data, the results could not be directly compared with the experiments with true labels, but the QSM results showed that the noise component was added as the mask size increased. In addition, like the above results, the upper edge of the brain also showed poor QSM results.In this study, we have investigated the reliability of QSM for the SSS from single echo 3D GRE phase using the simulated phase data. Since a single echo 3D GRE is widely used as a rountine SWI protocol, investigating the potential of oxygen metabolic information of this protocol will be helpful for clinical use of this information. Our results showed the estimations can be affected by various factors, so careful interpretation should be needed particularly for quantitative analysis. Further study for other factors such as number of echoes, voxelsizes, background phase removal methods will be required for clinical applications.
Acknowledgements
This research was supported by Basic Science Research Program through the National Research Foundation of Korea (NRF) funded by the Ministry of Science, ICT and Future Planning (NRF- 2017R1D1A1B03030772).References
[1] Haacke EM, Liu S, Buch S, Zheng W, Wu D, Ye Y. Quantitative susceptibility mapping: current status and future directions. Magn Reson Imaging 2015;33:1–25.https://doi.org/10.1016/j.mri.2014.09.004.[2] Haacke EM, Beggs CB, Habib C. The role of venous abnormalities in neurological disease. Rev Recent Clin Trials 2012;7:100–16.[3] Fischl, Bruce. “FreeSurfer.” Neuroimage 62.2 (2012): 774-781.[4] Schofield M, Zhu Y. Fast phase unwrapping algorithm for interferometric applications. Opt Lett 2003;28:1194–1196.[5] Wu B, Li W, Guidon A, Liu C. Whole brain susceptibility mapping using compressed sensing. Magn Reson Med 2012;67:137–147.[6] Wei, H, Dibb, R, Zhou, Y, Sun, Y, Xu, J, Wang, N, and Liu, C ( 2015), Streaking artifact reduction for quantitative susceptibility mapping of sources with large dynamic range. NMR Biomed., 28, 1294– 1303. doi: 10.1002/nbm.3383.
Figures