3254
Detection of Iron Deposition in Substantia Nigra for Mouse of Parkinson’s Disease: A Comparison of Quantitative Susceptibility Mapping and R2*1School of Biomedical Engineering, Southern Medical University, Guagnzhou, China, 2Guangdong Provincial Key Laboratory of Medical Image Processing, Southern Medical University, Guagnzhou, China, 3Department of Neurology, Nanfang Hospital, Southern Medical University, Guangzhou, China, 4Philips Healthcare, Guangzhou, China
Synopsis
Parkinson’s disease (PD), a common neurodegenerative disorder, is associated with iron deposition in the substantial nigra (SN) of both human and animal models. SN iron is a potential biomarker for diagnosing and monitoring PD. The aim of this study was to compare QSM and R2* for quantifying SN iron in mouse brain.
Introduction
Parkinson’s disease (PD), a common neurodegenerative disorder, is associated with iron deposition in the substantial nigra (SN) of both human [1] and animal models [2]. SN iron is a potential biomarker for diagnosing and monitoring PD [3]. Quantitative susceptibility mapping (QSM) and transverse relaxation rates (R2*) have been reported to be potential to quantify SN iron in the brain [4]. The aim of this study was to compare QSM and R2* for quantifying SN iron in mouse brain.Materials and Methods
All experimental protocols in this study were approved by the Institutional Animal Care and Use Committee. Ten young adult males C57BL/6 mice were treated with either intraperitoneal injections of MPTP (MPTP group, n=5) or saline (control group, n=5). The dosing scheme consisted of 10 injections of 25mg/kg MPTP or equal volume of saline over a 5-week period (two injections per week). After dosing, rotarod test and MR imaging of the brain were performed in both control and MPTP mice. Following MR imaging, the mice were euthanized and fresh brains were harvested at necropsy for further analysis. All MR acquisitions were performed on a Bruker 7.0T scanner (Bruker 70/16) using a 2-channel cryogenic mouse head coil. A three-dimensional spoiled multi-echo GRE sequence was used with the following parameters: field of view (FOV) = 17×16×7 mm3, matrix size = 170×160×70 resulting in a nominal voxel size of 0.1×0.1×0.1 mm3, the first echo time (TE) = 3.2 ms, echo spacing = 4.3 ms, number of TE = 8, repetition time (TR) = 250ms, and flip angle = 35o. The total scan time of the GRE sequence was approximately 37 min. The R2* was calculated by fitting the magnitude maps using auto-regression on linear operations [5]. QSM was implemented offline with the following steps. First, the total field map was generated by temporal unwrapping of complex GRE signal using a nonlinear least squares fitting method followed by spatial unwrapping using a continuous Laplacian approach [6]. The background field was removed by solving the Laplacian boundary value problem [7]. Finally, the tissue field was inverted to susceptibility map using preconditioned total field inversion method [8]. SN regions of interest (ROIs) were drawn on the GRE magnitude images by two radiologist (more than 5 years of experience).Results and Discussion
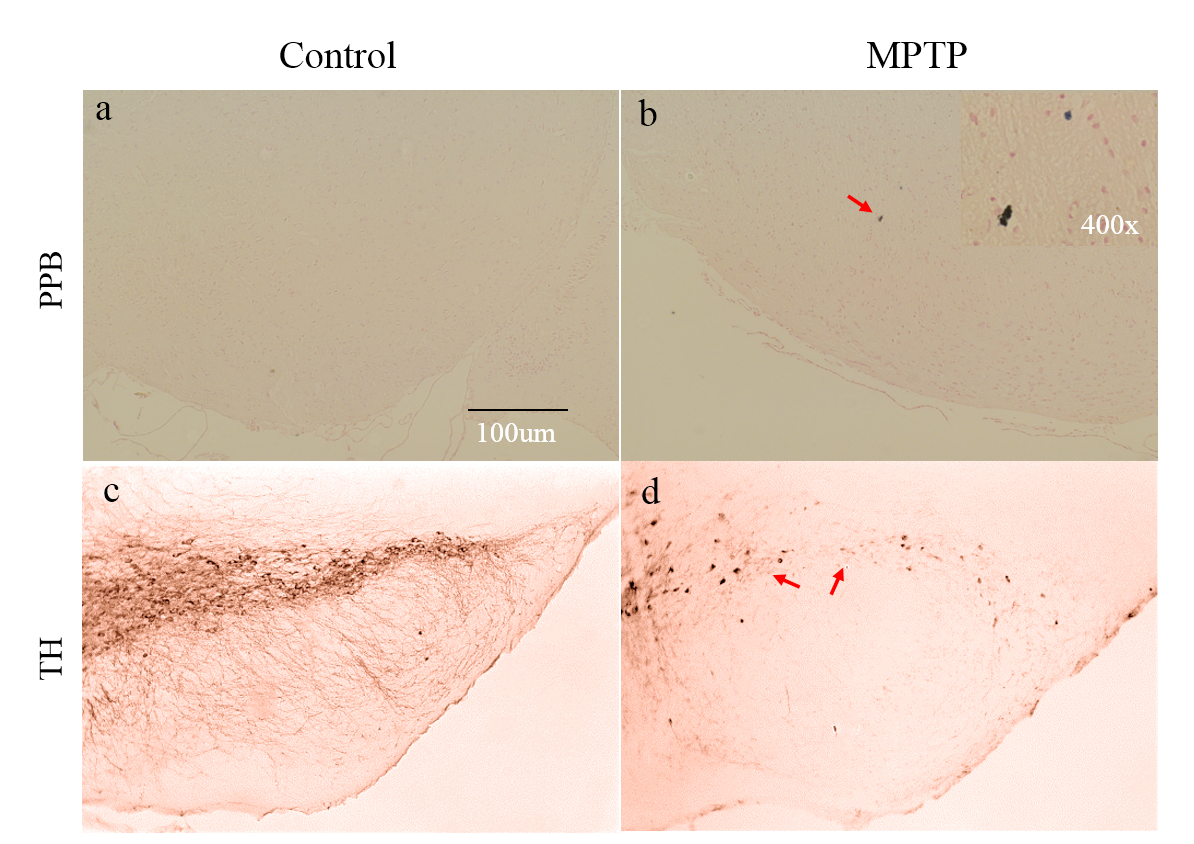
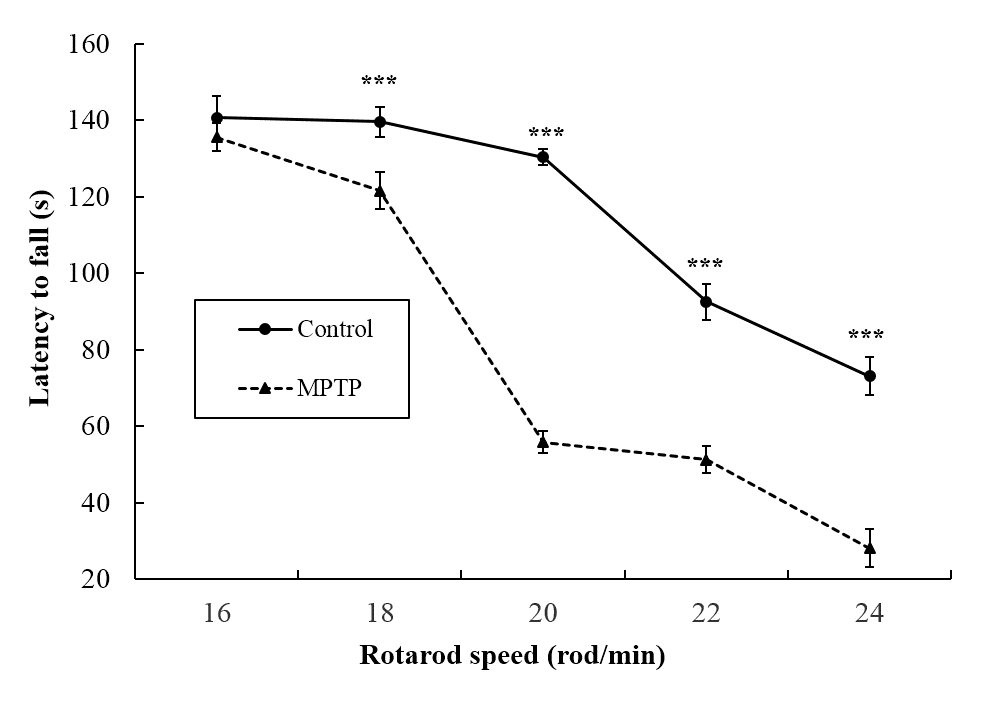
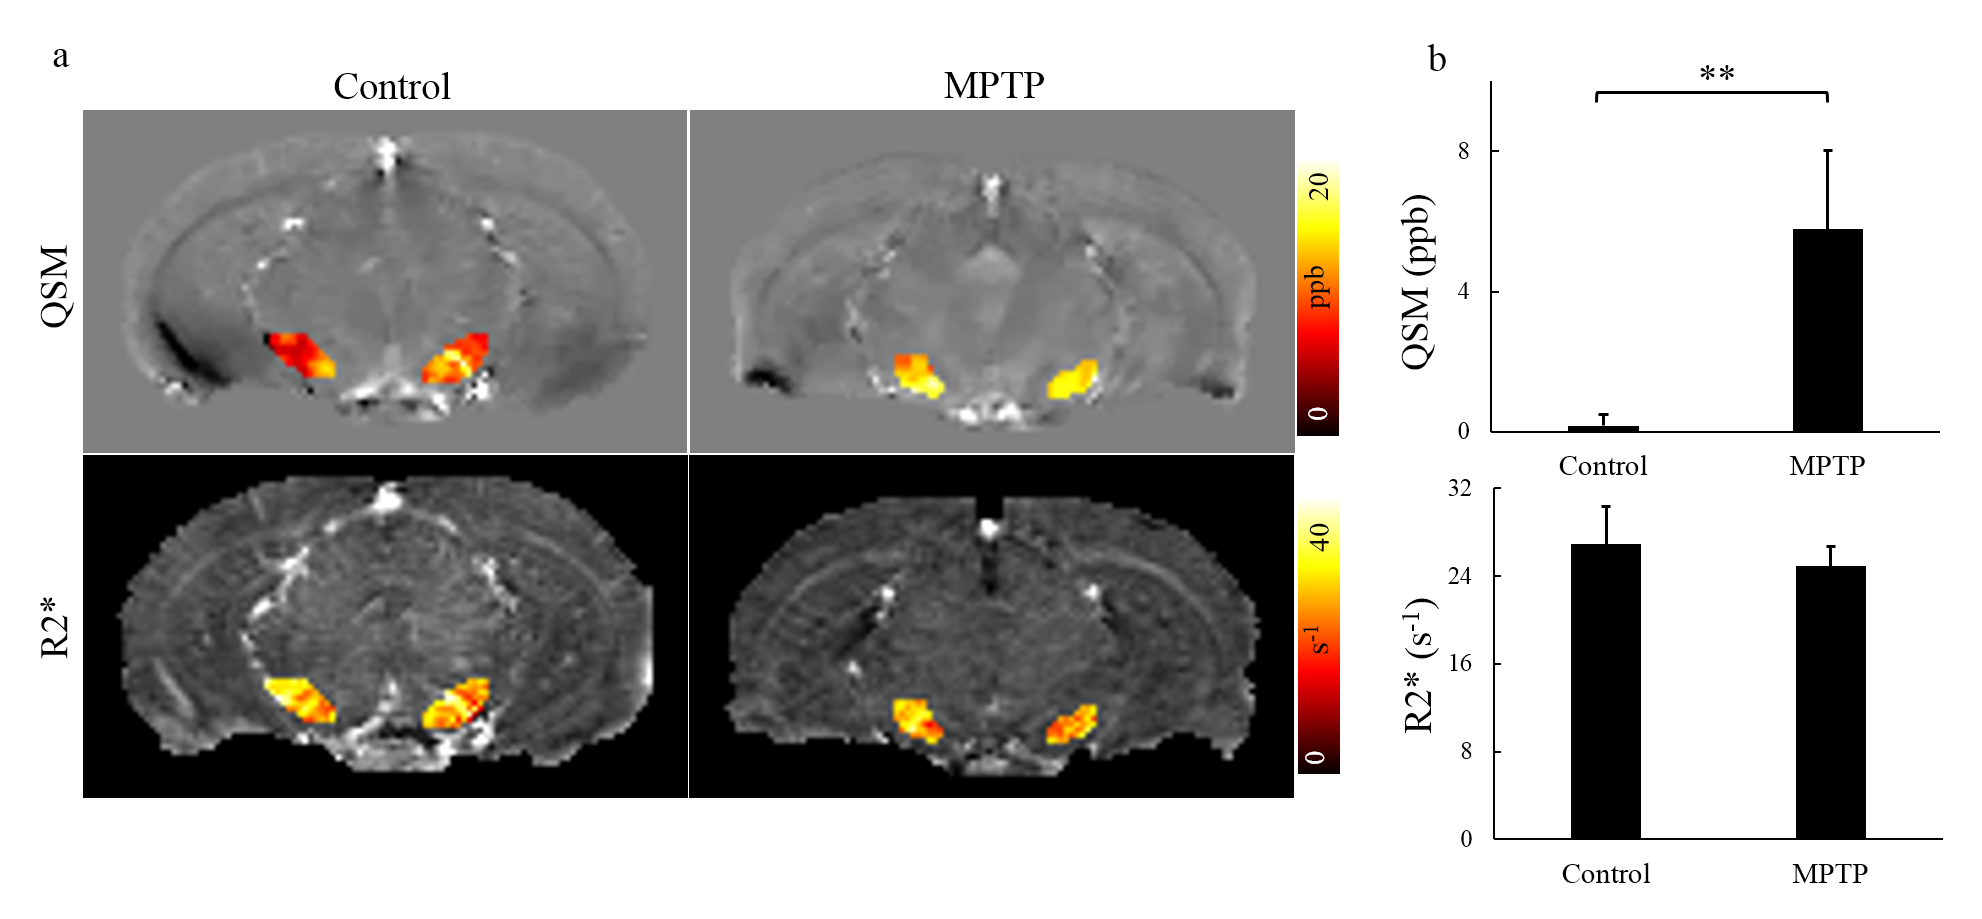
The result of PPB staining shows that there was negligible positive staining for control mice (Fig. 1a), while in SN there was positive staining in MPTP mice (pointed by red arrows in Fig. 1b), demonstrating iron deposition in the SN of PD mice. TH staining showed there were fewer selective dopaminergic neurons in the SN of MPTP mice (pointed by red arrows in Fig. 1d) compared to those in the SN of control mice (Fig. 1c). It demonstrated the damage of selective dopaminergic neurons for PD mice. These results suggested that the MPTP experiment successfully resulted in development of PD in our mouse model. In Fig. 2, while the latency to fall was comparable between MPTP and control groups at the rotarod speed of 16 rod/min, it was significantly lower in MPTP group compared to control group at higher rotarod speeds (18, 20, 22, and 24 rod/min). This is related to the damage of selective dopaminergic neurons in SN as revealed by the TH staining result. Figure 3 shows the comparison of QSM and R2* maps at SN between control and MPTP groups. The mean R2* was comparable between control and MPTP groups in SN (26.97 ± 3.50 s-1 for control vs 24.99 ± 1.84 s-1 for MPTP, P = 0.294), while the mean QSM value of SN was significantly increased in the MPTP group as compared to that in the control group (5.77 ± 2.25 ppb vs 0.18 ± 0.32 ppb, P = 0.0017).Conclusion
QSM is more sensitive than R2* for differentiating the iron deposition in the SN between MPTP and normal mice. QSM can detect the changes of iron deposition in the SN of MPTP mice, and it could serve as a potential quantitative biomarker for the early diagnosis of PD.Acknowledgements
No acknowledgement found.References
[1] J. H. Barbosa, A. C. Santos, V. Tumas, M. Liu, W. Zheng, E. M. Haacke, et al., "Quantifying brain iron deposition in patients with Parkinson's disease using quantitative susceptibility mapping, R2 and R2," Magn Reson Imaging, vol. 33, pp. 559-65, Jun 2015.
[2] L. H. You, F. Li, L. Wang, S. E. Zhao, S. M. Wang, L. L. Zhang, et al., "Brain iron accumulation exacerbates the pathogenesis of MPTP-induced Parkinson’s disease," Neuroscience, vol. 284, pp. 234-246, 2015/01/22/ 2015.
[3] A. A. Belaidi and A. I. Bush, "Iron neurochemistry in Alzheimer's disease and Parkinson's disease: targets for therapeutics," J Neurochem, vol. 139 Suppl 1, pp. 179-197, Oct 2016.
[4] G. Li, G. Zhai, X. Zhao, H. An, P. Spincemaille, K. M. Gillen, et al., "3D texture analyses within the substantia nigra of Parkinson's disease patients on quantitative susceptibility maps and R2∗ maps," NeuroImage, vol. 188, pp. 465-472, 2019/03/01/ 2019.
[5] M. Pei, T. D. Nguyen, N. D. Thimmappa, C. Salustri, F. Dong, M. A. Cooper, et al., "Algorithm for fast monoexponential fitting based on Auto-Regression on Linear Operations (ARLO) of data," Magn Reson Med, vol. 73, pp. 843-50, Feb 2015.
[6] T. Liu, C. Wisnieff, M. Lou, W. Chen, P. Spincemaille, and Y. Wang, "Nonlinear formulation of the magnetic field to source relationship for robust quantitative susceptibility mapping," Magn Reson Med, vol. 69, pp. 467-76, Feb 2013.
[7] D. Zhou, T. Liu, P. Spincemaille, and Y. Wang, "Background field removal by solving the Laplacian boundary value problem," NMR Biomed, vol. 27, pp. 312-9, Mar 2014.
[8] Z. Liu, Y. Kee, D. Zhou, Y. Wang, and P. Spincemaille, "Preconditioned total field inversion (TFI) method for quantitative susceptibility mapping," Magn Reson Med, Jul 28 2016.
Figures