3253
Identifying Different Types of Local Lesions in the Lenticular Nucleus of Patients with Wilson’s Disease using Quantitative Susceptibility Maps1East China Normal University, Shanghai, China, 2Shanghai Tong-Ren Hospital, Shanghai, China, 3Shanghai Mental Health Center, Shanghai, China, 4Weill Medical College of Cornell University, New York, NY, United States
Synopsis
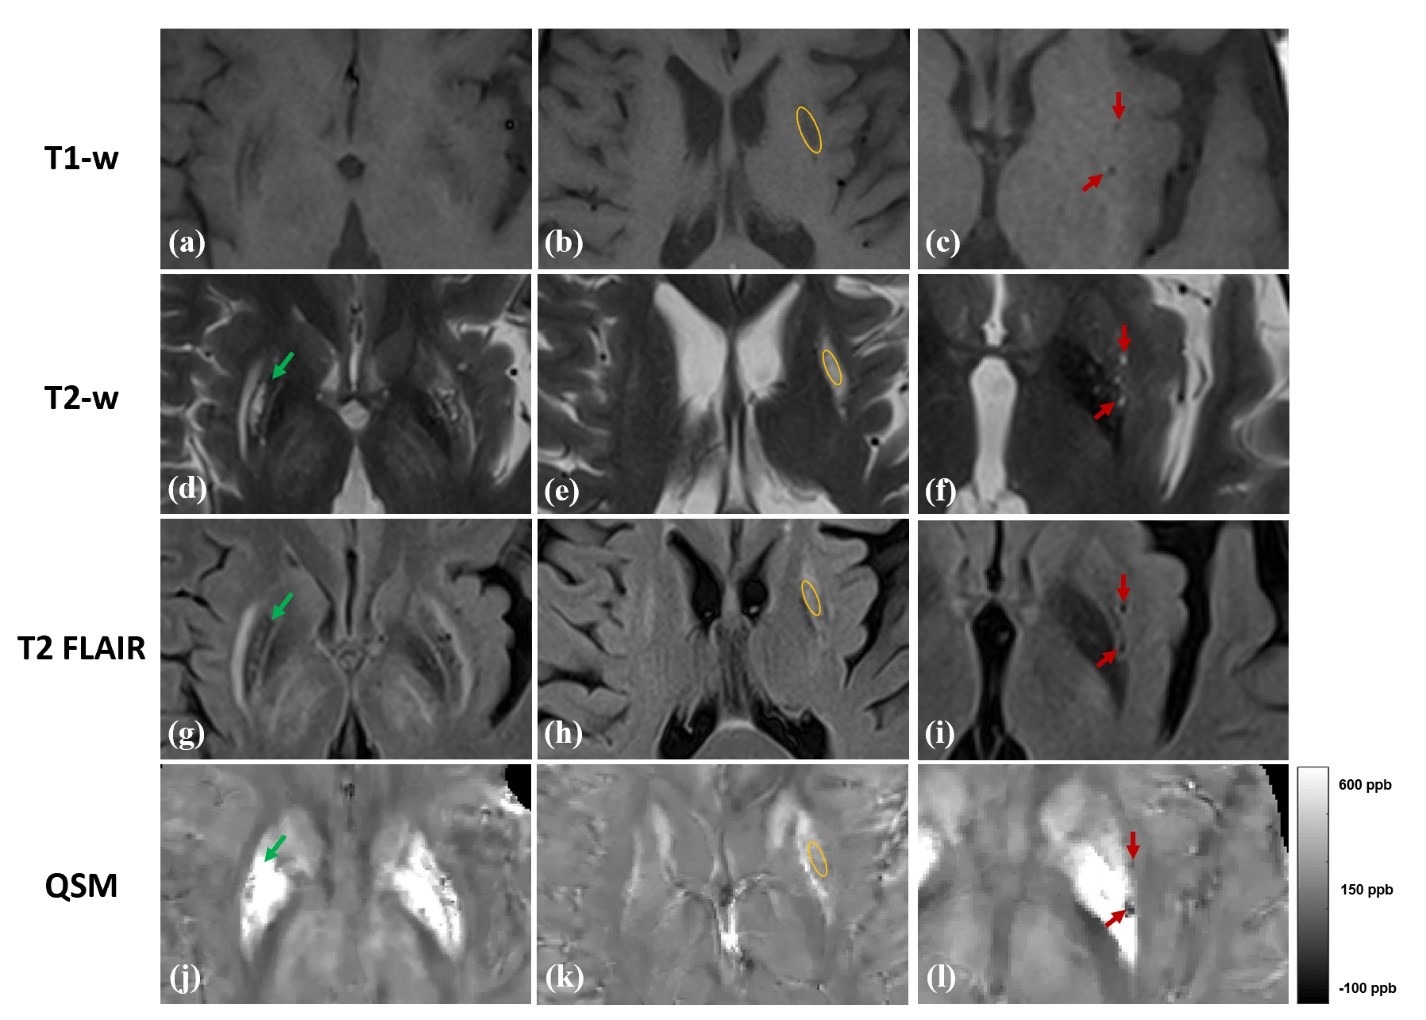
The objective of this study was to discriminate signal changes of edema, encephalomalacia and excessive metal deposition in the lenticular nucleus of patients with Wilson’s Disease on quantitative susceptibility maps. Standard T1- weighted, T2- weighted, T2 FLAIR and QSM images were obtained on 14 WD subjects using 3T MRI. The results indicated that QSM could effectively discriminate different types of local lesions, including metal deposition hyperintensity, encephalomalacia hypointensity, and edema medium intensity. Furthermore, our study revealed that UWDRS and neurological symptoms scores of patients with severe abnormal MRI manifestations were significantly higher than that of patients with mild abnormal MRI.
Introduction
Wilson disease (WD) is a rare, autosomal recessive genetic disorder in which excessive amounts of copper and iron accumulate in the brain[1-3]. Excess copper is initially taken-up and buffered by astrocytes and oligodendrocytes but ultimately causes dysfunction of blood-brain-barrier and demyelination. Most severe neuropathologic abnormalities, including tissue rarefaction, reactive astrogliosis, myelin palor, and presence of iron-laden macrophages, are typically present in the putamen while other basal ganglia. Quantitative susceptibility maps (QSM) technique provides excellent contrast in deep gray matter nuclei[4]. In this study, we propose to discriminate lesions of edema, excessive metal deposition, and encephalomalacia of patients with WD in the lenticular nucleus (globus pallidus (GP) and putamen (PUT)) using QSM, and to verify the findings on conventional MRI manifestation.Materials and Methods
This study was approved by the local ethical committee and all participants signed an Informed Consent form. 14 WD patients with a mean age of 28.07±9.6 years old (10 males and 4 females) were scanned on a clinical 3T MR imaging system (Magnetom Trio Tim, Siemens Healthcare, Erlangen, Germany) equipped with a 12 channel head matrix coil. Standard T1-w, T2-w, T2-weighted fluid-attenuated inversion recovery (FLAIR) and QSM images were obtained. The QSM maps were generated from three dimensional (3D) spoiled multi-echo gradient-echo (GRE) sequence with the following imaging parameters: TR = 60ms, TE1 = 6.8ms, ΔTE = 6.8ms, echoes number = 8, flip angle = 15˚, FOV = 240*180 mm2, in-plane resolution=0.625*0.625mm2, slice thickness = 2mm, number of slices = 96. A generalized auto-calibrating partially parallel acquisition (GRAPPA) with an acceleration factor of 2 in the right-left direction and elliptical sampling were used to reduce acquisition time. QSM maps were reconstructed using the Morphology Enabled Dipole Inversion with automatic uniform cerebrospinal fluid zero reference (MEDI+0) algorithm[5]. Differences in UWDRS and neurological symptoms scales between two groups were compared using two-tailed t-test. All statistical analyses were carried out using IBM SPSS Statistics 23.Results
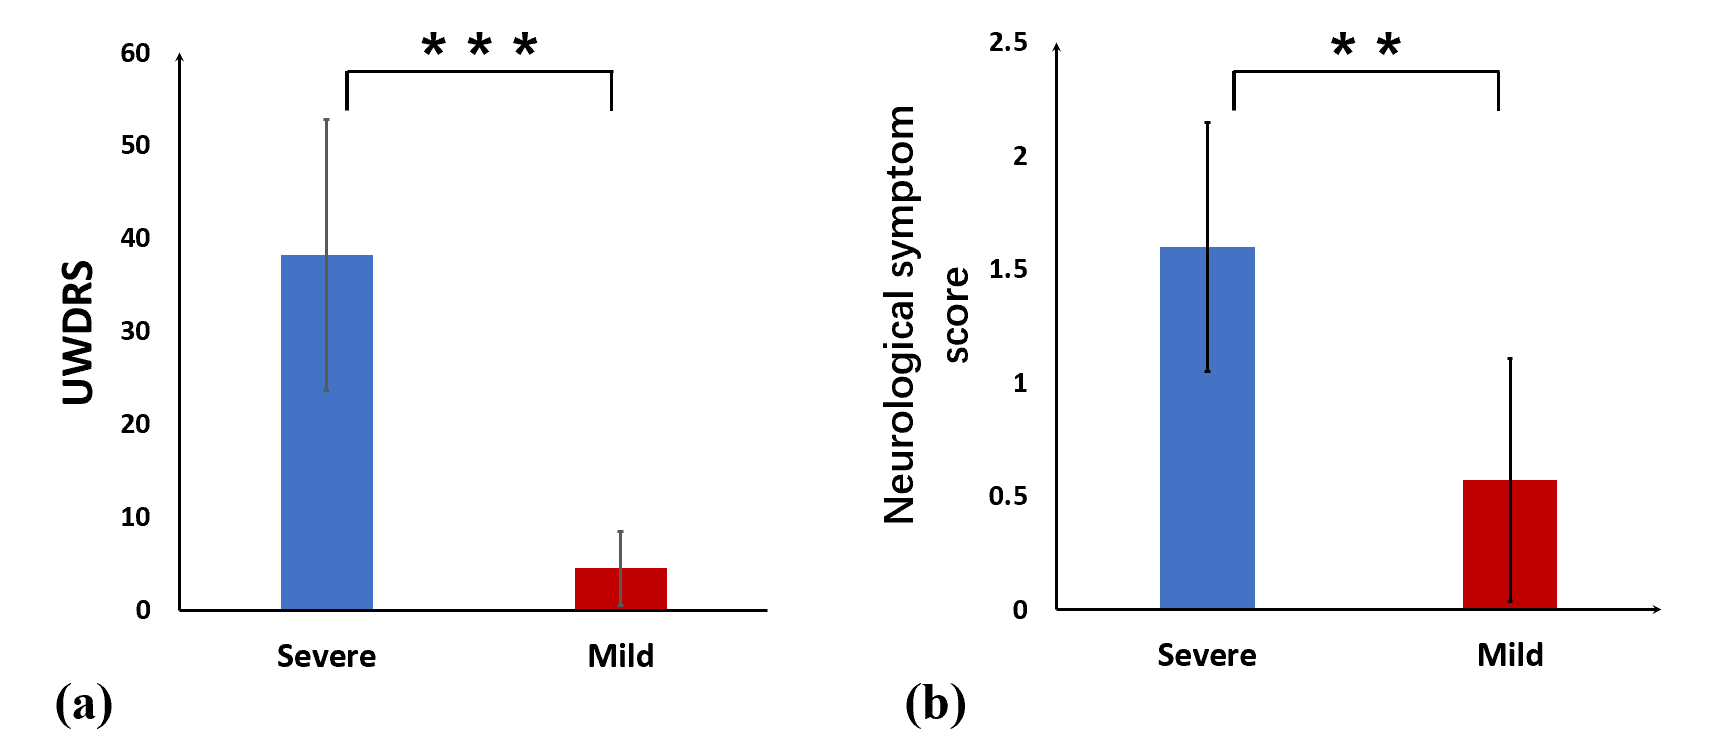
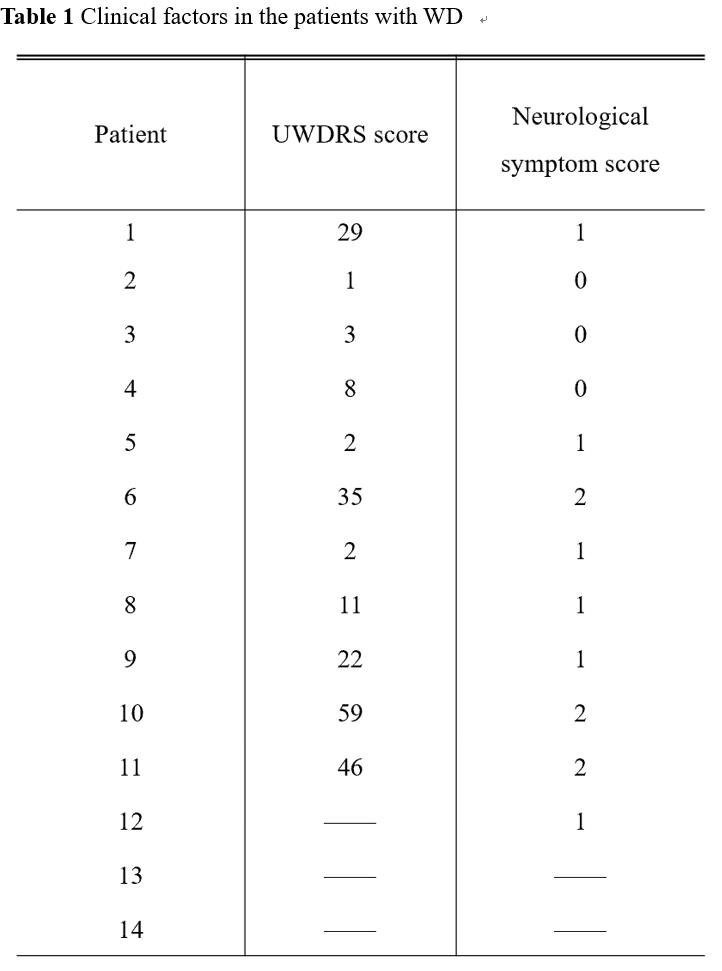
On the conventional images, signal abnormalities were seen in 10 patients (71%) in the lenticular nucleus, T2-w and T2 FLAIR were affected mostly. For the QSM results, metal accumulation showed hyperintense (Fig.1 (j)), corresponding to hypointensity on T2-w and T2 FLAIR (Fig.1 (d) and (g)). In the edematous lesions, magnetic susceptibility values in this area were close to the signal of surrounding white matter (Fig.1 (k)), corresponding to hypointense on T1-w (Fig.1 (b)) and hyperintense on T2-w and T2 FLAIR (Fig.1 (e) and (h)). There were also some pixels with hypointensity on QSM (Fig.1 (l)). Encephalomalacia was the most likely reason for the hyperintensity on T2-w (Fig.1 (f)) and hypointensity on T2 FLAIR (Fig.1 (i)). 14 patients were divided into mild group (only metal deposition or normal) and severe group (edema or encephalomalacia) according to the MRI manifestation. 5 patients (35.7%) showed severe MRI abnormalities, while the remaining 9 patients with mild abnormal were nonetheless affected by neurological symptoms (Table 1). There was significant difference in the UWDRS score between two groups (38.2 ± 14.6 for severe group vs 4.5 ± 4.0 for mild group, p < 0.001) (Fig. 2 (a)), score of neurological symptoms in severe group was significant higher than that in mild group (1.6 ± 0.5 vs 0.6 ± 0.5, p = 0.009) (Fig. 2 (b)).Discussion and conclusions
In our study, 10 of 14 patients exhibited signal abnormalities on T1-w, T2-w or T2 FLAIR images. The results agree with previous reports[6]. The lesions location on QSM maps were well consistent with that of conventional data. Therefore, QSM performed well in distinguishing metal accumulation, edema and encephalomalacia in the patients with WD, which may provide quantitative auxiliary information for the diagnosis of different lesions in WD. In addition, our study also analyzed the association between clinical features and stage of damage in the lenticular nucleus. These findings suggest that patients with mild WD may be free of MRI abnormalities. Patients with severe WD observed severe neuropathologic abnormalities, including tissue rarefaction, tissue edema, , and encephalomalacia, are typically present in the putamen while other basal ganglia. These manifestations corresponded to higher scores of neurological symptoms score. In summary, QSM is a sensitive quantitative technique to detect changes in magnetic susceptibility values of different lesions in WD patients. Furthermore, QSM have the potential to be a supplementary method for the duration diagnose of WD.Acknowledgements
No acknowledgement found.References
1. Ala, A., et al., Wilson's disease. Lancet, 2007. 369(9559): p. 397-408.
2. Litwin, T., et al., Brain metal accumulation in Wilson's disease. Journal of the Neurological Sciences, 2013. 329(1-2): p. 55-58.
3. Dusek, P., et al., Brain iron accumulation in Wilson disease: a post mortem 7 Tesla MRI - histopathological study. Neuropathology and Applied Neurobiology, 2017. 43(6): p. 514-532.
4. Liu, T., et al., Improved Subthalamic Nucleus Depiction with Quantitative Susceptibility Mapping. Radiology, 2013. 269(1): p. 216-223.
5. Liu, Z., et al., MEDI+0: Morphology enabled dipole inversion with automatic uniform cerebrospinal fluid zero reference for quantitative susceptibility mapping. Magnetic Resonance in Medicine, 2018. 79(5): p. 2795-2803. 6. Zhong, W., Z. Huang, and X. Tang, A study of brain MRI characteristics and clinical features in 76 cases of Wilson's disease. J Clin Neurosci, 2019. 59: p. 167-174.
Figures