3252
Quantitative susceptibility mapping with 1mm isotropic resolution in 2 minutes using compressed sensing
Arun Joseph1,2,3, Tom Hilbert4,5,6, Gabriele Bonanno1,2,3, Emilie Mussard4,5,6, Christoph Forman7, Ashley Stewart8,9, Kieran O’Brien8, and Tobias Kober4,5,6
1Advanced Clinical Imaging Technology, Siemens Healthcare AG, Bern, Switzerland, 2Translational Imaging Center, Sitem-Insel, Bern, Switzerland, 3Departments of Radiology and Biomedical Research, University of Bern, Bern, Switzerland, 4Advanced Clinical Imaging Technology, Siemens Healthcare AG, Lausanne, Switzerland, 5Department of Radiology, Lausanne University Hospital and University of Lausanne, Lausanne, Switzerland, 6LTS5, École Polytechnique Fédérale de Lausanne (EPFL), Lausanne, Switzerland, 7Siemens Healthcare AG, Erlangen, Germany, 8Siemens Healthcare Pty Ltd, Brisbane, Australia, 9Queensland Brain Institute, The University of Queensland, Brisbane, Australia
1Advanced Clinical Imaging Technology, Siemens Healthcare AG, Bern, Switzerland, 2Translational Imaging Center, Sitem-Insel, Bern, Switzerland, 3Departments of Radiology and Biomedical Research, University of Bern, Bern, Switzerland, 4Advanced Clinical Imaging Technology, Siemens Healthcare AG, Lausanne, Switzerland, 5Department of Radiology, Lausanne University Hospital and University of Lausanne, Lausanne, Switzerland, 6LTS5, École Polytechnique Fédérale de Lausanne (EPFL), Lausanne, Switzerland, 7Siemens Healthcare AG, Erlangen, Germany, 8Siemens Healthcare Pty Ltd, Brisbane, Australia, 9Queensland Brain Institute, The University of Queensland, Brisbane, Australia
Synopsis
Quantitative susceptibility mapping exploits magnetic susceptibility to probe biological tissue. The obtained quantitative information carries additional clinical value, e.g. for the diagnosis of neurodegenerative diseases. However, standard protocols have long acquisition times which impedes their use in clinical routine. Here, we propose a compressed sensing acquisition based on a Cartesian spiral-phyllotaxis readout scheme to drastically reduce the total acquisition times from 20 minutes to 2 minutes for a 1mm isotropic susceptibility map of the whole brain. A preliminary qualitative and quantitative validation is performed on healthy subjects.
Introduction
Quantitative Susceptibility Mapping (QSM) is a technique that provides information on underlying tissue properties such as iron distribution, (de-)oxyhaemoglobin, calcification, and others1-3. It has, amongst others, the potential to provide new clinical insights for neurodegenerative diseases such as multiple sclerosis and Parkinson’s. Current implementations of QSM exhibit, however, long scan times (~10-20 mins) with sufficiently high spatial resolution; this can be mitigated using classical parallel imaging techniques, but scan times remain long for application in clinical protocols.In this study, we implement a compressed sensing QSM gradient echo sequence based on a Cartesian spiral-phyllotaxis readout4 to achieve a clinically feasible QSM acquisition time. A preliminary qualitative and quantitative validation is performed on healthy subjects.
Methods
A Cartesian spiral-phyllotaxis undersampling scheme was implemented in a prototype gradient echo (GRE) sequence. Three subjects were measured at 3T (MAGNETOM Prisma, Siemens Healthcare, Erlangen, Germany) using a 64-channel head/neck-coil after obtaining written informed consent. The protocol consisted of undersampled acquisitions using the above prototype sequence with the following scan parameters: TR 25 ms, TE 20 ms, flip angle 12°, 1 mm isotropic resolution, FOV 256 mm, number of slices 160, slice oversampling 20%. The measurements were performed in the transversal plane with undersampling factors of [2, 4, 6, 8], yielding total acquisition times of [8:06, 4:06, 2:46, 2:02] minutes, respectively. For comparison, a reference measurement with the same parameters was performed using a product GRE without and with GRAPPA x2 acceleration resulting in acquisition times of 20:30 and 11:09 min, respectively. Magnitude and phase images as well as QSM maps were directly obtained at the scanner after image reconstruction followed by a prototype QSM algorithm8,9. Additionally, an MPRAGE sequence was acquired and used as anatomical reference (TR 2300 ms, TE 2.32 ms, TI 900 ms, flip angle 8°, 1 mm isotropic resolution).The compressed sensing reconstruction5-6 process consisted of iteratively minimizing the cost function enforcing both consistency with the acquired data and sparsity in the wavelet domain following:
$$\underset{x}{min} ||PF\{CX\} - Y||_2^2 + \lambda |\Psi X|_1$$
with P being the sampling mask, F the discrete Fourier transform, C complex coil sensitivities, Y the undersampled k-space, λ a regularization parameter, Ψ the wavelet-transform and Х the estimated image. The complex coil sensitivities were computed by low-pass filtering and normalizing the individual coil images of the calibration lines as it was done in the original SENSE publication7. The inline reconstruction time for compressed sensing reconstructions was ~3 minutes. The algorithm for QSM estimation was comprised of Laplacian phase unwrapping, V-SHARP background phase removal, and dipole inversion using the single-step L2 algorithm with quadratic smoothing regularization8,9.
A quantitative region of interest (ROI) analysis was performed using the prototype MorphoBox10 segmentation algorithm on five structures whose susceptibility is of interest, namely: thalamus, caudate, putamen, pallidum, amygdala. Of note, the segmentation was performed on the MPRAGE image and the resulting label maps were copied into the space of each individual QSM maps using rigid registrations11. The median values from all regions were extracted using the obtained masks. Subsequently, the median QSM of the cerebellum was subtracted from the ROI values to correct a systematic offset originating from the inverse nature of the QSM reconstruction. The mean and standard deviation across subjects for the different structures and acceleration methods were compared in a bar-plot.
Results and Discussion
Figure 1 shows the measured k-space with the Cartesian spiral-phyllotaxis patterns for the applied acceleration factors. The magnitude, phase and QSM maps obtained for reference, GRAPPAx2 and compressed sensing reconstructions with acceleration factors 4 and 8 (results for x2 and x6 similar) are shown in Figure 2. The magnitude and QSM maps are qualitatively consistent and robust even for the higher acceleration factors, providing good anatomical details. Differences can be observed between the phase images of the reference, GRAPPAx2 and the compressed sensing reconstructions, with the reference showing large phase variations. These differences are due to different type of coil sensitivity estimations. Figure 3 shows the QSM maps obtained for reference, GRAPPAx2 and compressed sensing reconstructions with all tested acceleration factors. The QSM maps obtained from compressed sensing reconstructions are qualitatively comparable to the reference; expectedly, increased blurring is observed with higher acceleration factors. Figure 4 shows the mean of the median QSM values over three subjects obtained for the probed regions of the brain. While thalamus, putamen, caudate and pallidum showed positive QSM median values and similar results, amygdala showed negative values. The values obtained from compressed sensing reconstructions were higher in comparison to the reference and GRAPPAx2 acquisitions.Conclusion
We implemented and tested a Cartesian spiral-phyllotaxis undersampling pattern in combination with a QSM processing. The preliminary data shows that compressed sensing reconstruction provides consistent data among different acceleration factors. Notably, typical compressed sensing blurring increases with higher acceleration factors, which should hence be adapted to the intended application. Further studies with a larger cohort including patients are required for further validation.Acknowledgements
No acknowledgement found.References
- Duyn J, MR susceptibility imaging. J. Magn. Reson. 2013; 229:198–207.
- Haacke EM, Liu S, Buch S, et al. Quantitative susceptibility mapping: current status and future directions. Magn. Reson. Imaging 2015; 33(1):1-25.
- Wang Y, Liu T, Quantitative susceptibility mapping (QSM): Decoding MRI data for a tissue magnetic biomarker. Magn. Reson. Med. 2015;73: 82–101.
- Forman C, Piccini D, Grimm R, et al. High-resolution 3D whole-heart coronary MRA: a study on the combination of data acquisition in multiple breath-holds and 1D residual respiratory motion compensation. MAGMA. 2014;27(5):435-43.
- Wetzl J, Forman C, Wintersperger BJ, et al. High-resolution dynamic CE-MRA of the thorax enabled by iterative TWIST reconstruction. Magn Reson Med. 2017;77(2):833-840.
- Ma LE, Markl M, Chow K, et al. Aortic 4D flow MRI in 2 minutes using compressed sensing, respiratory controlled adaptive k-space reordering, and inline reconstruction. Magn Reson Med. 2019;81(6):3675-3690.
- Pruessmann KP, Weiger M, Scheidegger MB, et al. SENSE: sensitivity encoding for fast MRI. Magn Reson Med. 1999;42(5):952-62.
- Chatnuntawech I, McDaniel P, Cauley SF et al. Single-step quantitative susceptibility mapping with variational penalties. NMR Biomed. (2016). doi:10.1002/nbm.3570
- Li W, Wu B, Liu C. Quantitative susceptibility mapping of human brain reflects spatial variation in tissue composition. NeuroImage 2011; 55:1645–1656.
- Schmitter D, Roche A, Maréchal B et al. An evaluation of volume-based morphometry for prediction of mild cognitive impairment and Alzheimer's disease. Neuroimage Clin. 2014 ; 7:7-17.
- Klein S, Staring M, Murphy K, Viergever MA, Pluim JPW, "Elastix: a toolbox for intensity based medical image registration," IEEE Transactions on Medical Imaging 2010; 29(1):196-205.
Figures
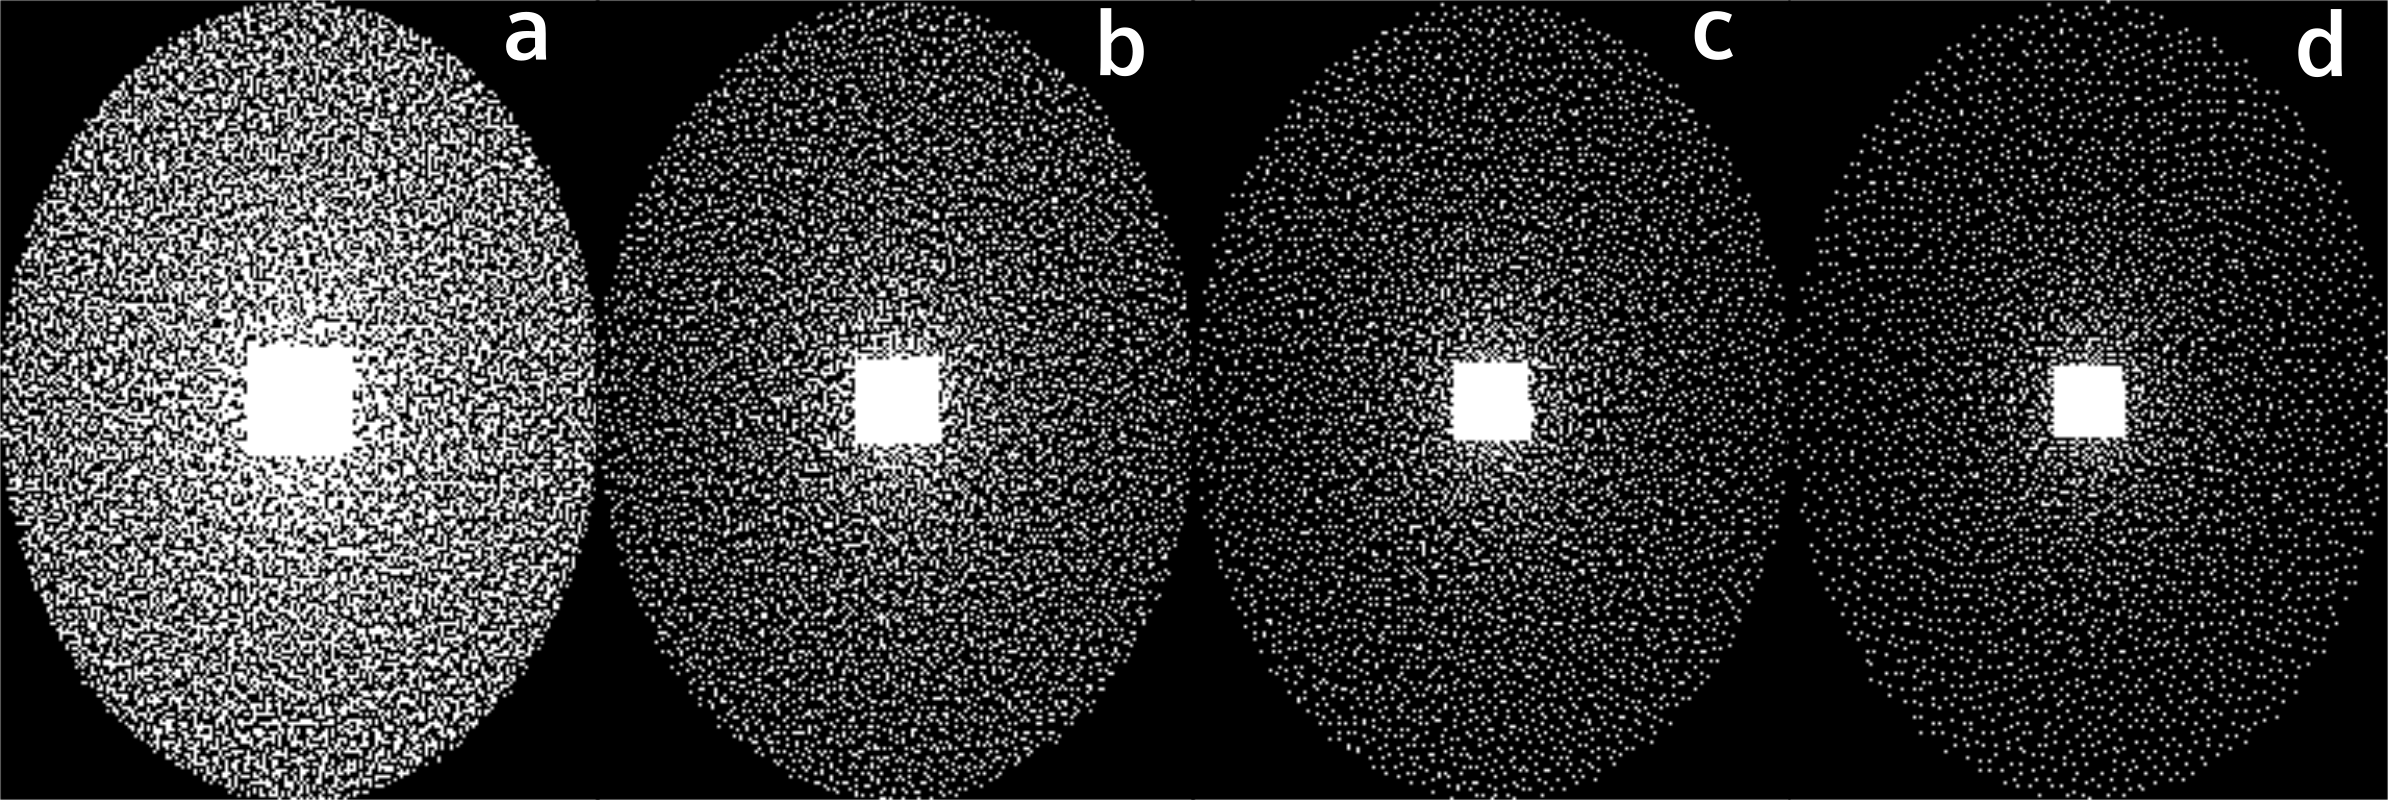
Figure 1:
The measured Cartesian spiral-phyllotaxis
pattern obtained at different acceleration factors of (a) 2, (b) 4, (c) 6 and
(d) 8.
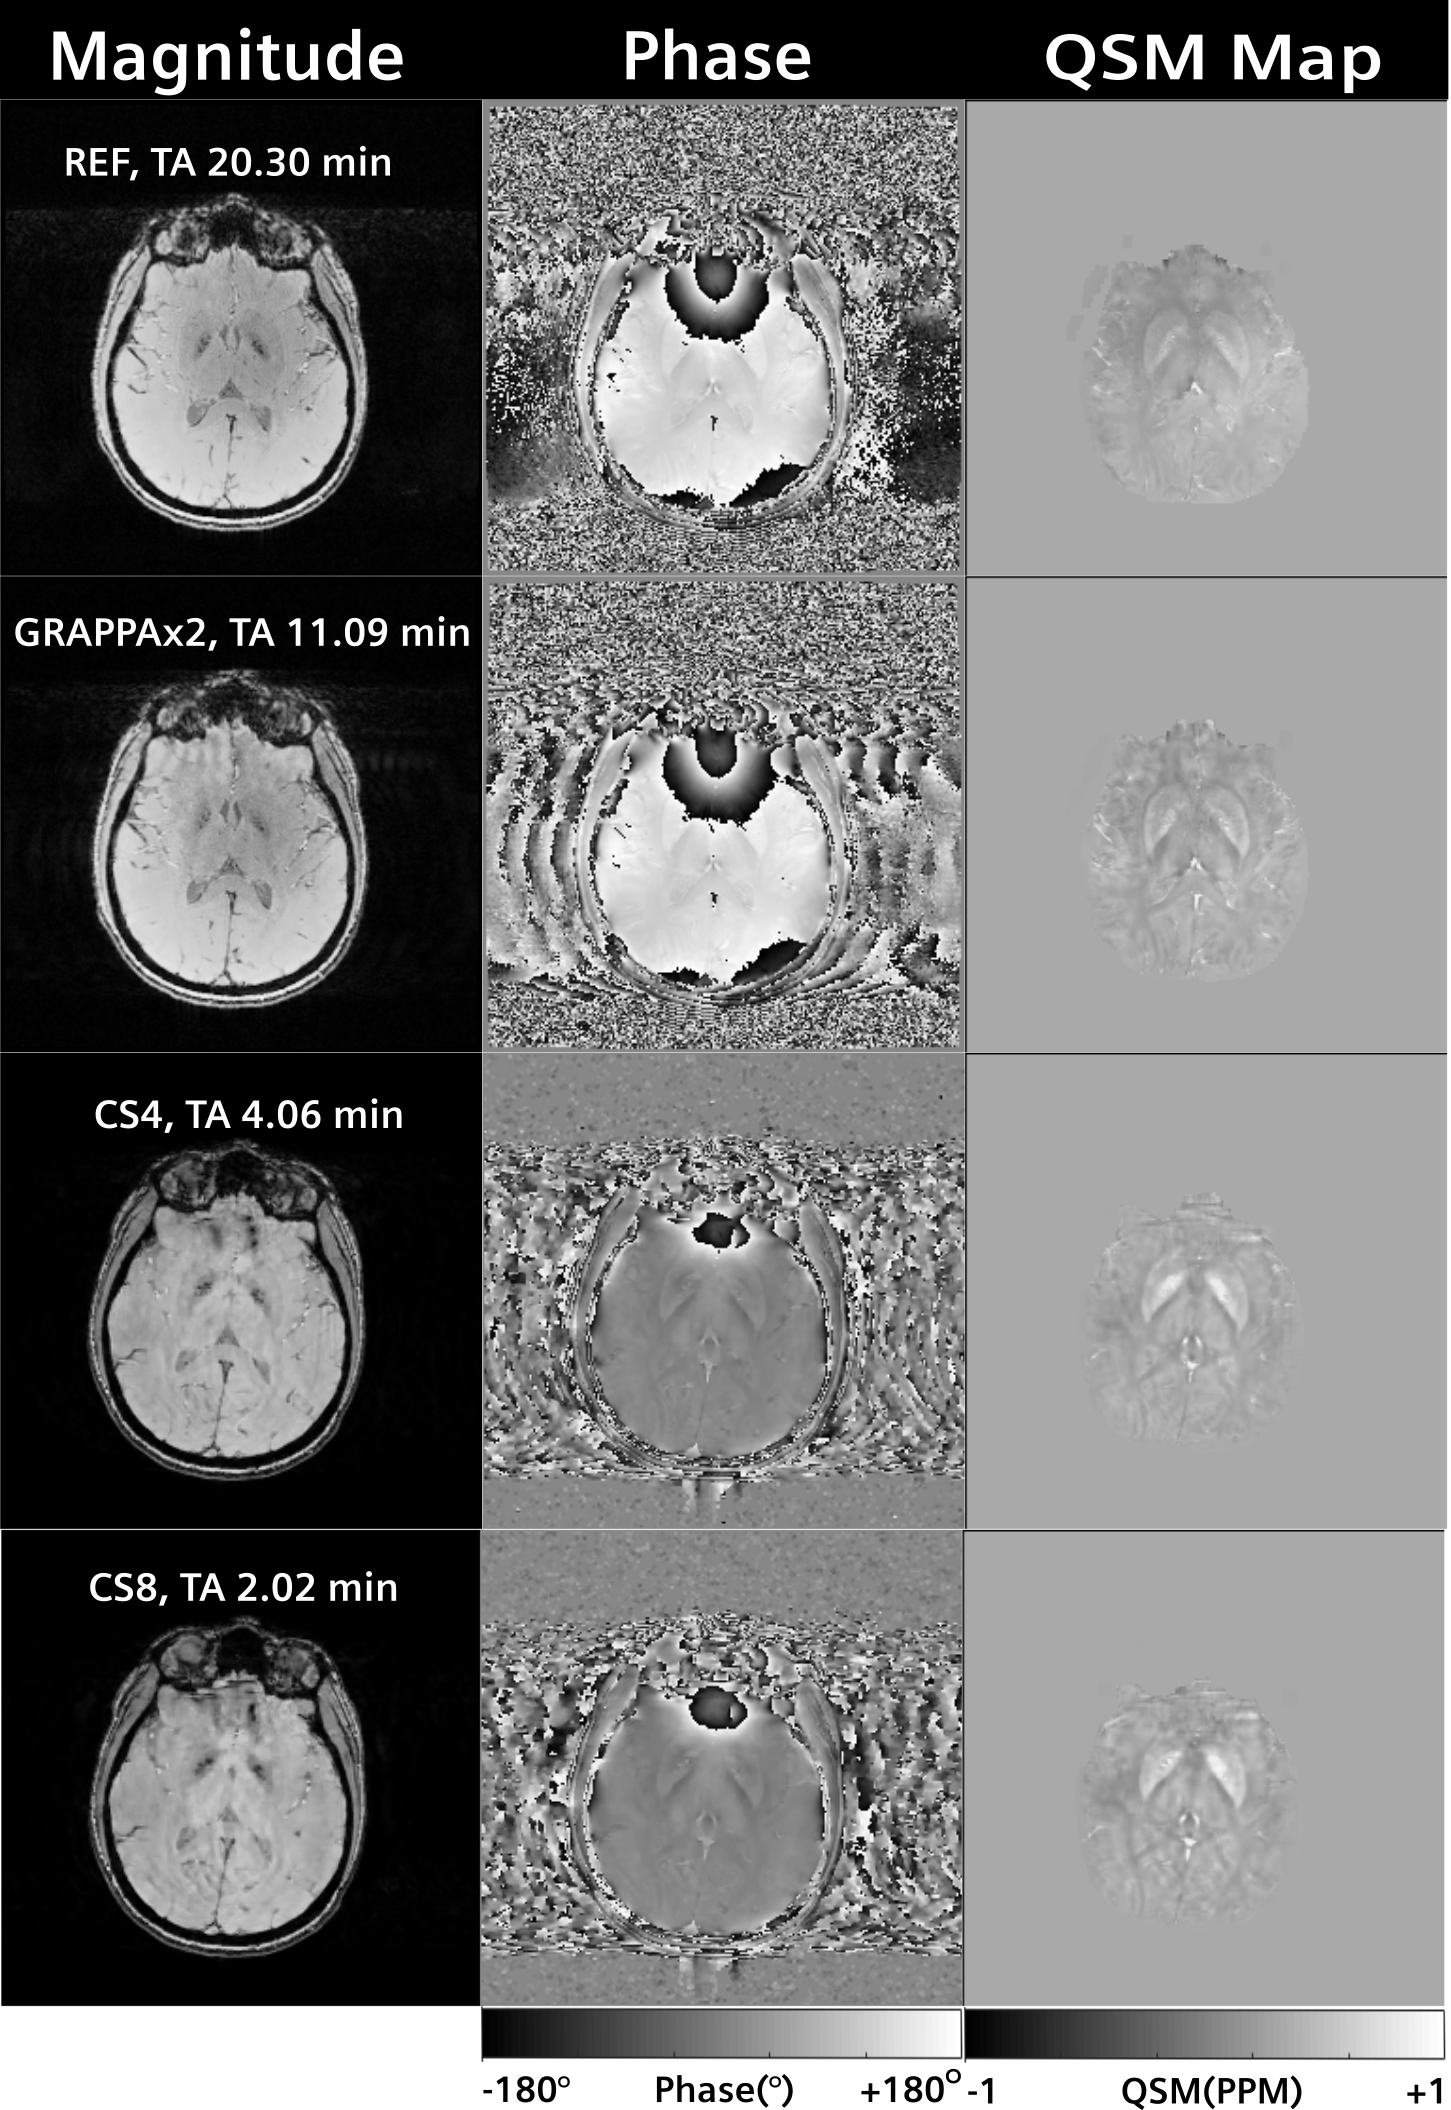
Figure 2:
Magnitude, phase and
QSM Maps obtained from reference, GRAPPAx2 and compressed sensing reconstructions
with acceleration factors 4 and 8.
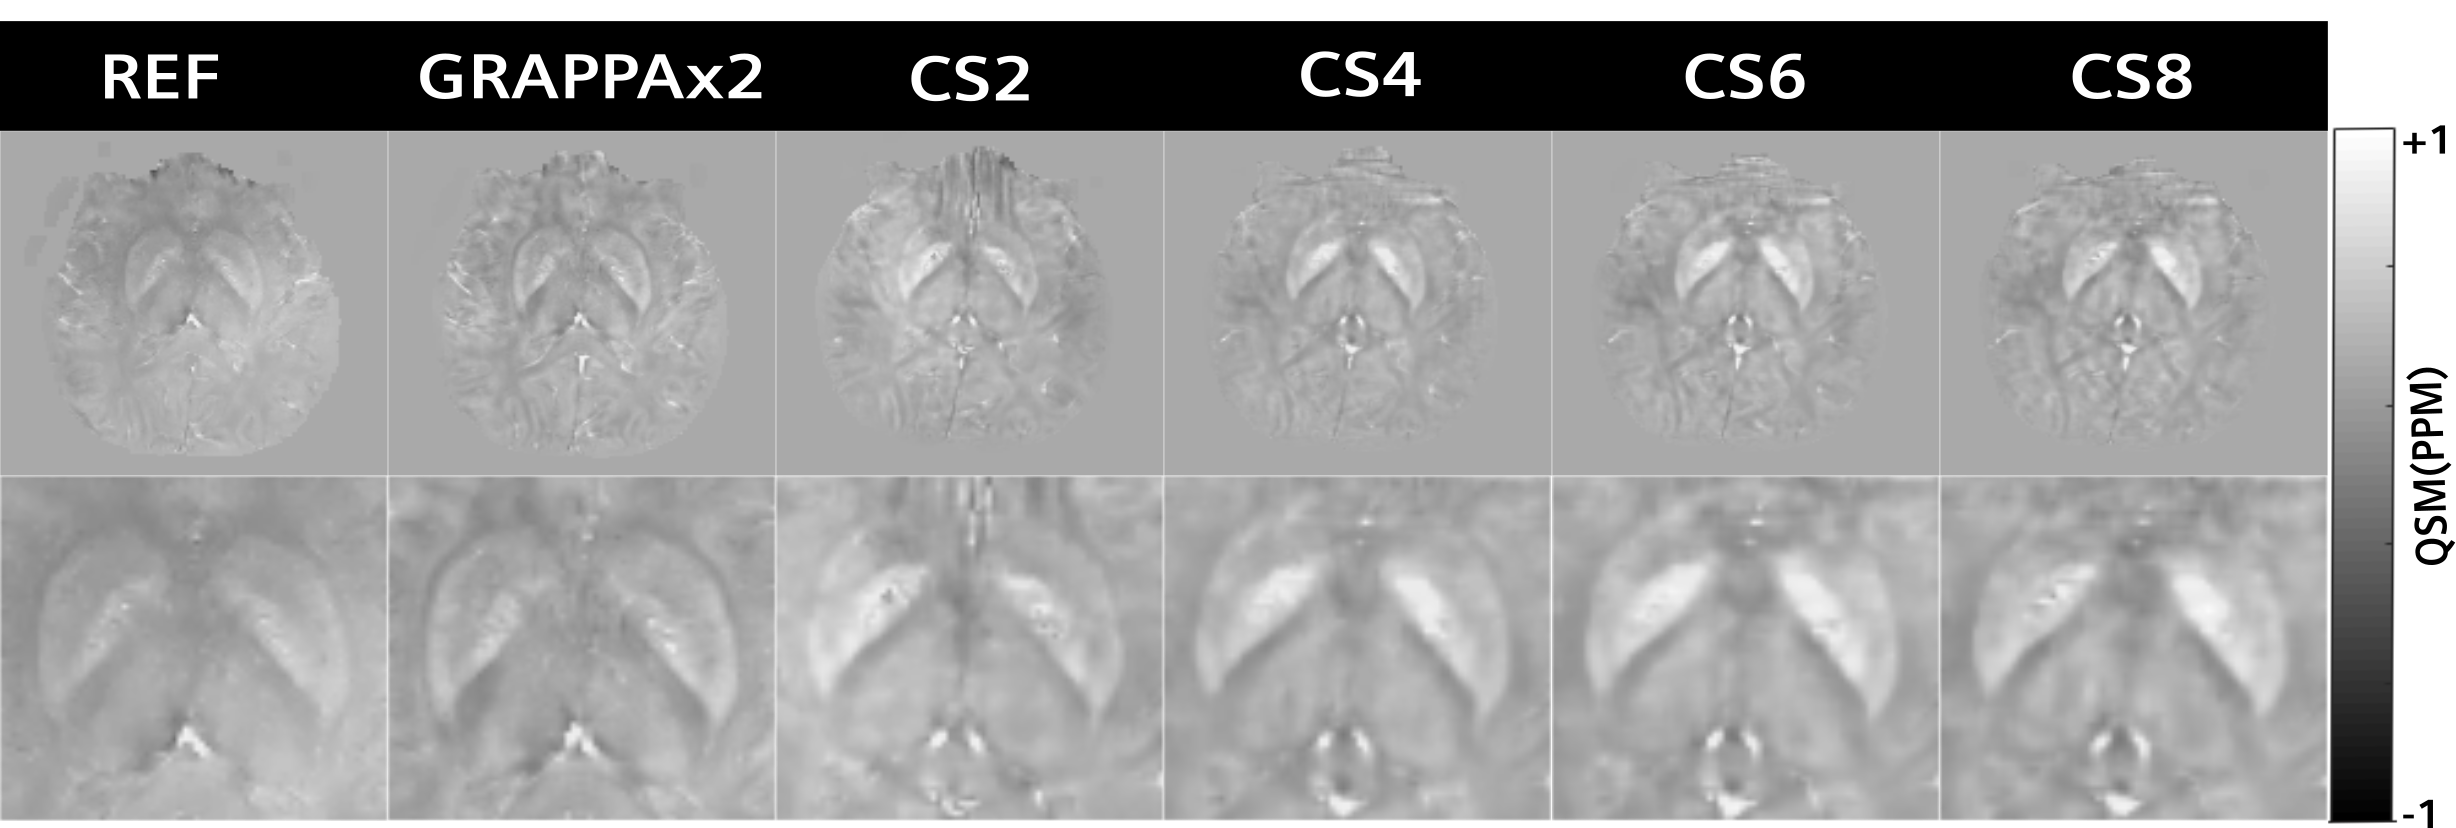
Figure 3:
QSM maps obtained from
reference, GRAPPAx2 and compressed sensing reconstructions with acceleration
factors 2, 4, 6, 8. Zoomed images of these QSM maps are displayed in the bottom
row.
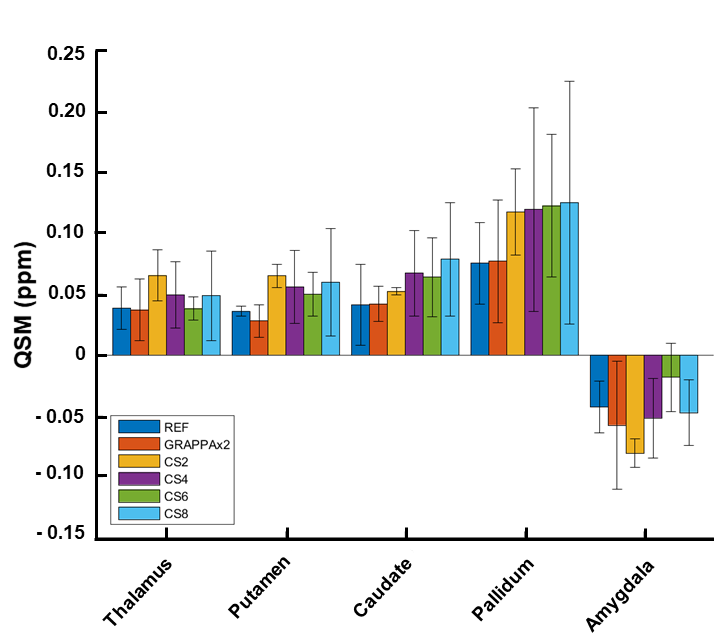
Figure 4:
Median QSM values over three subjects obtained
from different regions of the brain.