3251
Renal Susceptibility Imaging: Analysis of Susceptibility Weighted Imaging and Quantitative Susceptibility Mapping in Transplanted Kidneys1Bio and Brain Engineering, Korea Advanced Institute of Science and Technology, Daejeon, Republic of Korea, 2Department of Radiology, Bio medical Research Institute of Chonbuk National University Hospital, Jeonju, Republic of Korea
Synopsis
Renal susceptibility imaging is challenging due to the motion artifacts in kidney. In this study, susceptibility weighted imaging (SWI) and quantitative susceptibility mapping (QSM) were performed on transplanted kidney patients, who show less kidney motions. QSM images successfully demonstrated oxygen gradients in kidney, i.e., the hypoxic state in medulla and the fully oxygenated state in cortex. Heterogeneous susceptibility distributions were observed near medullary veins, presumably due to medullary hypoxia and incomplete local phase unwrapping. Further studies are necessary for more complete local phase unwrapping and quantification of oxygenation levels in medullary veins from QSM images.
Introduction
Magnetic susceptibility MRI has been widely applied to characterizing tissue properties in organs including brain, liver, and cartilage. Recent study showed a strong linear relationship between iron deposition and quantitative susceptibility estimates in brain and liver1. Also, venous oxygenation level in brain can be estimated from the MR phase signals induced by paramagnetic deoxy-hemoglobins2. Kidneys play a key role in regulating body fluids and levels of electrolytes. Since there is a sufficient blood supply to the renal cortex, most cortical areas are fully oxygenated. On the other hand, the renal medulla shows hypoxic conditions due to both countercurrent exchange of oxygen within the vasa recta and the consumption of oxygen by the medullary thick ascending limbs.Since severe motion exists and sources of magnetic susceptibility are not diverse in kidney, susceptibility imaging in kidney has been underexplored3-5. In this study, renal susceptibility MRI was performed on transplanted kidney patients. With 3-D gradient echo sequence at 3T MRI, susceptibility weighted images (SWI) and quantitative susceptibility maps (QSM) of the transplanted kidney were obtained, and susceptibility distributions of the renal cortex, medulla, and veins were analyzed.
Methods
AcquisitionTransplanted kidney patients in early postoperative period (within one week after surgery) were examined on a 3T MRI scanner (40.3±9.0Y, n=3; MAGNETOM Verio Siemens Healthcare, Erlangen, Germany). Patients were instructed to breathe freely during the scan. Following parameters were used for 3-D gradient echo imaging: TR=48ms; TE1=8.2ms, ΔTE=8.2ms, 5 echoes; flip angle=25°; resolution=0.94×0.94×2 mm3; matrix size=240×320×40; flow compensation; imaging direction=sagittal, and scan time=8:28 min. For one patient, 75% partial Fourier was applied on both phase and slice encoding directions, resulting in scan time = 4:46 min.
Analysis
The R2* map was estimated through mono-exponential fitting of the multi-echo magnitude images. Multi-echo phase images were combined with projection onto dipole fields6. For SWI images, the phase images were processed using 36×48×6 high-pass filter and the negative phase mask that was multiplied to the magnitude image 4 times. Minimum intensity projection (mIP) was applied to four slices to visualize veins better7. For QSM images, Laplacian-based phase unwrapping and V-SHARP based background removal8 were applied on the phase image. Finally, ALOHA-QSM algorithm9 was used to solve the dipole inversion problem. For analysis, renal medulla (green area in Fig.3B) and cortex (red area in Fig.3B) were manually segmented from magnitude images, and 5-percentiled region from the SWI weighting mask was segmented as vein (blue area in Fig.3B).
Results and Discussion
Figure 1A shows the sagittal section of kidney. Veins were detected better in medulla than cortex, presumably related to the hypoxic conditions in medulla. Because veins contain paramagnetic deoxy‑hemoglobin, both intra‑ and extra‑vascular regions were dark in the phase image, which were depicted better in SWI than the magnitude image (red arrows). QSM reconstruction process is shown in Fig.1B. In the QSM image, veins showed higher/lower susceptibilities than surrounding medulla. This heterogeneity in susceptibility values in medullary veins might be related to (i) paramagnetic deoxy‑hemoglobin accentuated by the medullary hypoxia and (ii) incomplete phase unwrapping in these regions. Detailed QSM images are shown in Fig.2. Susceptibility distributions were visually consistent across subjects. Quality of QSM images acquired without partial Fourier was similar to that acquired with partial Fourier, even with 43.7% shorter scan time, which can potentially decrease motion artifacts.Histograms in cortex, medulla, and veins from each image type are shown in Fig.3A. In medulla, signals in SWI were slightly shifted to left compared to the magnitude signals, and most signals in veins were suppressed. In R2* mapping, most signals were normally distributed in cortex and medulla, but some were suppressed. Because of deoxy-hemoglobin, R2* values increased in veins compared to cortex and medulla. In QSM images, signal distribution in the cortex were centered at 0 ppm and ranged mostly (~93.7%) within -0.1~0.1 ppm. No visually identifiable susceptibility sources existed in renal cortex. On the other hand, the signal variation was larger in the medulla, and some signals exceeded normal range of susceptibility values (-0.2~0.3 ppm). The over-ranged signals also have been found in veins, however most signals were uniformly distributed. This distinctive distribution between areas in renal QSM image is presumably due to different susceptibility characteristics induced by different oxygenation status between the areas. Since most of renal cortex is fully oxygenated, susceptibilities in renal cortex were normally distributed with small variance. However, because of medullary hypoxia, oxygenation states can vary and resulting in greater variance in renal medulla susceptibilities. The over-ranged medullary signals in histogram seem to be due to phase unwrapping failure near veins. It could be confirmed in Fig.3B, the over-ranged medullary signals (yellow area) were placed near veins (blue area).
Conclusion
We presented preliminary results of renal SWI and QSM in transplanted kidney patients. Images were analyzed both qualitatively and quantitatively. Susceptibility distributions of QSM image were different in regions, which reflects high oxygen gradient between cortex and medulla. Heterogeneous susceptibility distributions near veins in medulla are presumably about medullary hypoxia and incomplete local phase unwrapping due to the rapid phase changes in this region. Further studies are necessary for more complete local phase unwrapping and quantification of oxygenation levels in medullary veins from QSM images.Acknowledgements
No acknowledgement found.References
[1] Deistung, A., Schweser, F., & Reichenbach, J. R. (2017). Overview of quantitative susceptibility mapping. NMR in Biomedicine, 30(4).
[2] Fan, A. P., Bilgic, B., Gagnon, L., Witzel, T., Bhat, H., Rosen, B. R., & Adalsteinsson, E. (2014). Quantitative oxygenation venography from MRI phase. Magnetic resonance in medicine, 72(1), 149-159.
[3] Ding, J., Xing, W., Wu, D., Chen, J., Pan, L., Sun, J., . . . Dai, Y. (2015). Evaluation of renal oxygenation level changes after water loading using susceptibility-weighted imaging and T2* mapping. Korean journal of radiology, 16(4), 827-834.
[4] Mie, M. B., Nissen, J. C., Zöllner, F. G., Heilmann, M., Schoenberg, S. O., Michaely, H. J., & Schad, L. R. (2010). Susceptibility weighted imaging (SWI) of the kidney at 3 T–initial results. Zeitschrift für medizinische Physik, 20(2), 143-150.
[5] Sun, J., Yu, S., Chen, J., Xing, Z., Zha, T., Fan, M., . . . Xing, W. (2019). Assessment of delayed graft function using susceptibility-weighted imaging in the early period after kidney transplantation: a feasibility study. Abdominal Radiology, 44(1), 218-226.
[6] De Rochefort, L., Brown, R., Prince, M. R., & Wang, Y. (2008). Quantitative MR susceptibility mapping using piece‐wise constant regularized inversion of the magnetic field. Magnetic resonance in medicine, 60(4), 1003-1009.
[7] Haacke, E. M., Xu, Y., Cheng, Y. C. N., & Reichenbach, J. R. (2004). Susceptibility weighted imaging (SWI). Magnetic Resonance in Medicine: An Official Journal of the International Society for Magnetic Resonance in Medicine, 52(3), 612-618.
[8] Li, W., Wu, B., & Liu, C. (2011). Quantitative susceptibility mapping of human brain reflects spatial variation in tissue composition. Neuroimage, 55(4), 1645-1656.
[9] Ahn, H.-S., Park, S.-H., & Ye, J. C. Quantitative susceptibility map reconstruction using annihilating filter-based low-rank Hankel matrix approach. Magnetic resonance in medicine, in press. doi:10.1002/mrm.27976
Figures
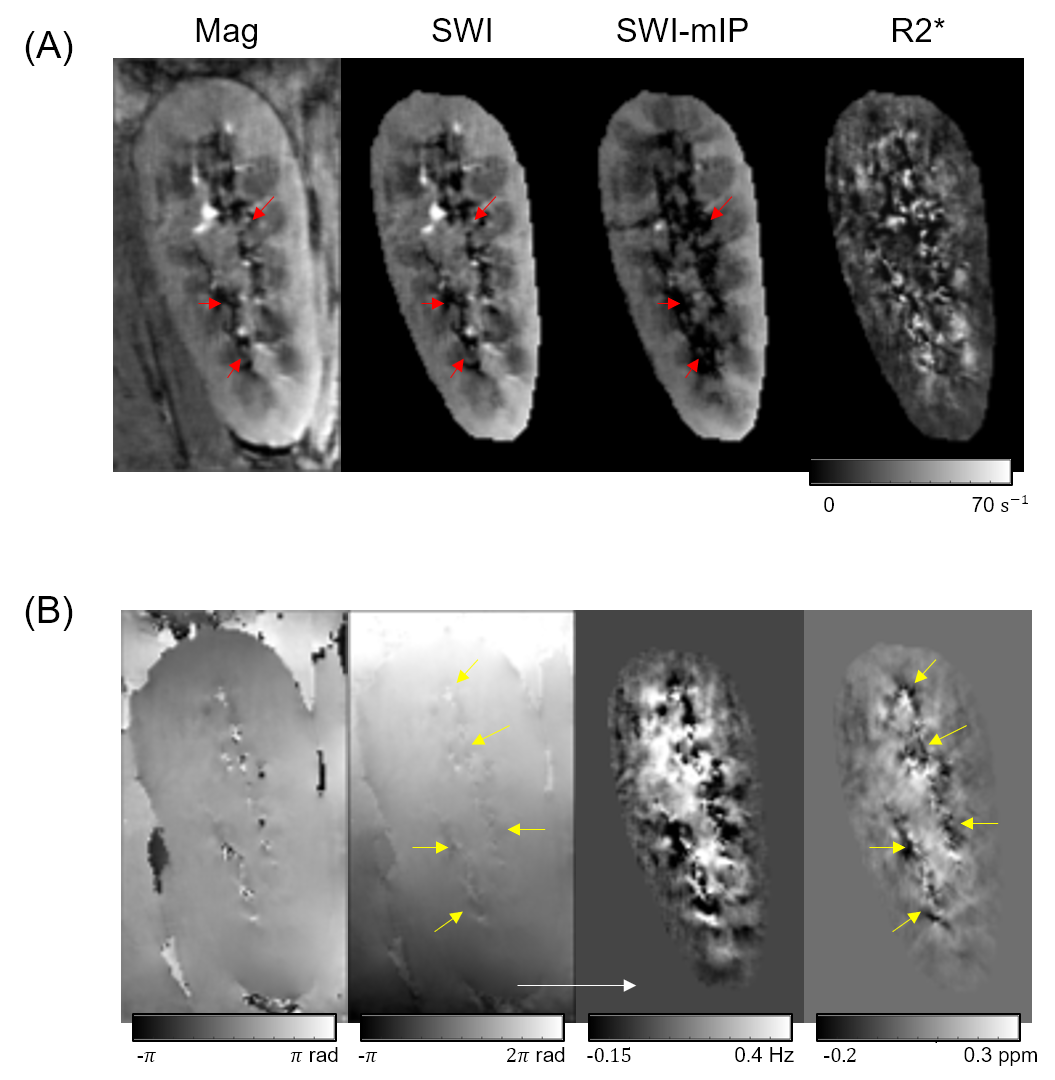
Figure 1. (A) Kidney MRI sagittal slices of magnitdue image, susceptibility weighted image (SWI), SWI with minimum intensity projection (SWI-mIP), and R2* map.
(B) Process of renal QSM reconstruction. From left to right: multi-echo combined phase image, unwrapped phase image, background removed phase image, and QSM image.
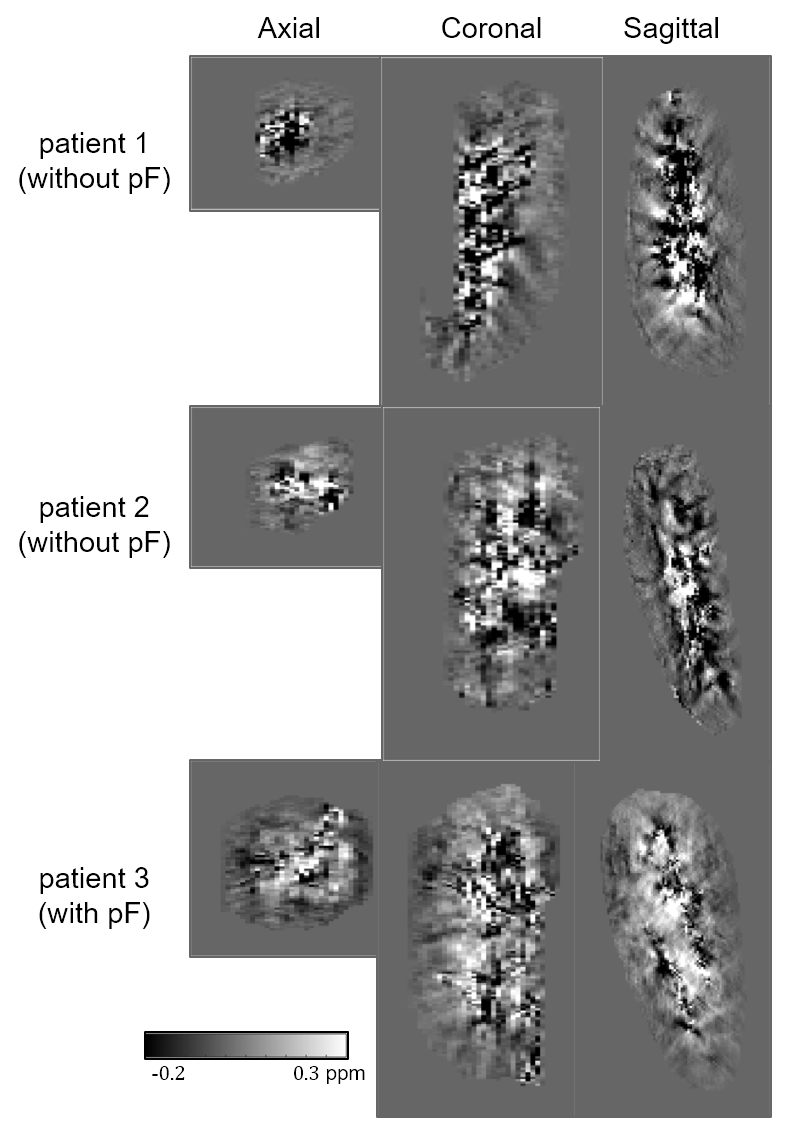
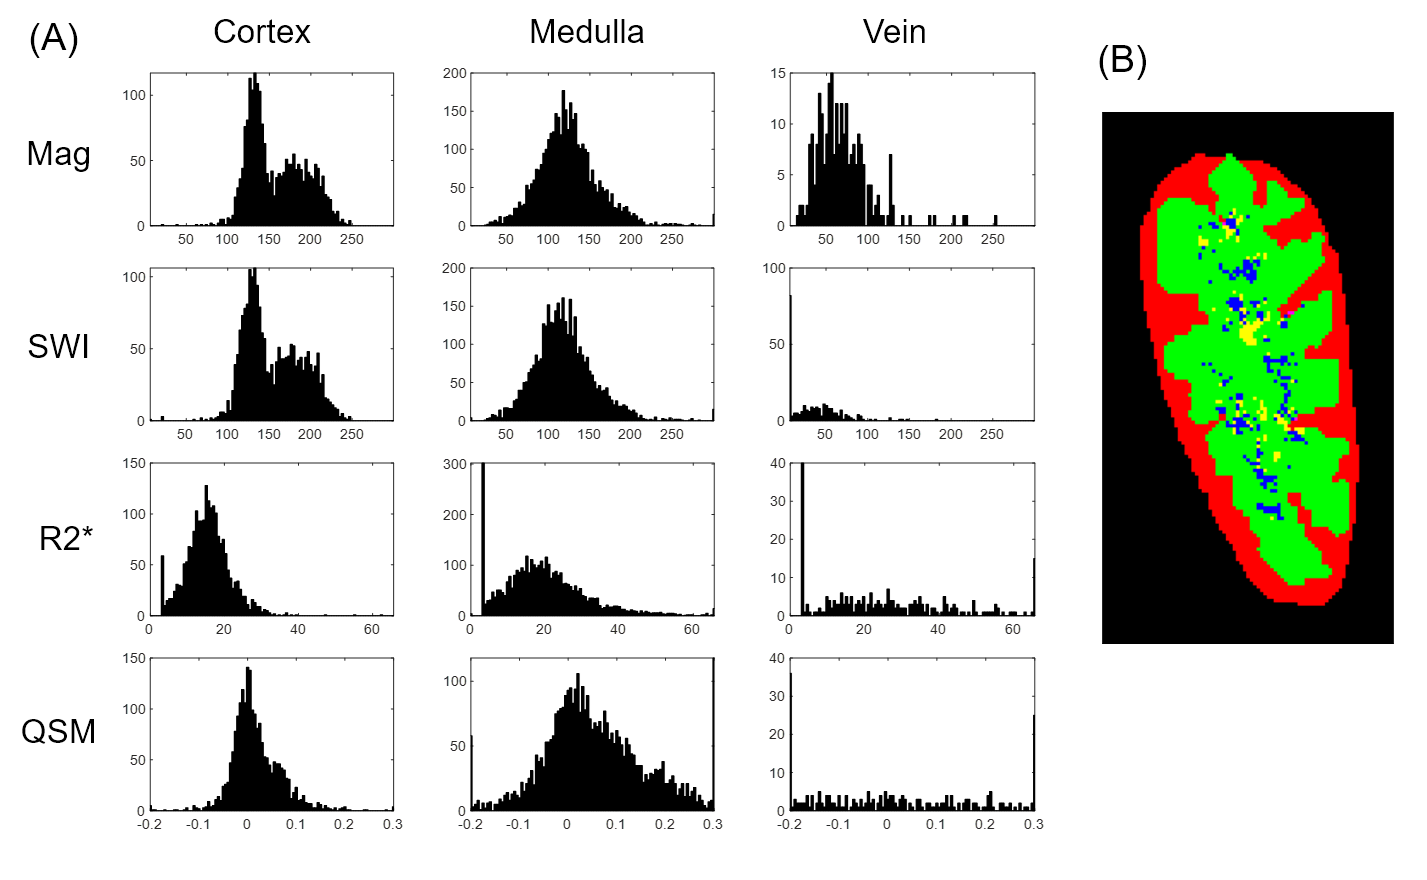
Figure 3. (A) Plots of kidney magnitude, SWI, R2*, and QSM images, histograms in cortex, medulla, and veins.
(B) Renal cortex, medulla, and veins segmented as red, green and blue, respectively. Specifically, over-ranged susceptibility values in medullar are marked as yellow.