3250
Reliability Study of Quantitative Susceptibility Mapping from Three-Dimensional Echo-Planar Imaging with 2 Minutes Scan Time
Krishna Pandu Wicaksono1, Yasutaka Fushimi1, Tomohisa Okada2, Satoshi Nakajima1, Sonoko Oshima1, Yusuke Yokota1, Azusa Sakurama1, Sayo Otani1, and Kaori Togashi1
1Department of Diagnostic Imaging and Nuclear Medicine, Kyoto University, Graduate School of Medicine, Kyoto, Japan, 2Human Brain Research Center, Kyoto University, Graduate School of Medicine, Kyoto, Japan
1Department of Diagnostic Imaging and Nuclear Medicine, Kyoto University, Graduate School of Medicine, Kyoto, Japan, 2Human Brain Research Center, Kyoto University, Graduate School of Medicine, Kyoto, Japan
Synopsis
3D-EPI QSM has been proposed as one solution of QSM long scan time which hinders its routine application. As its validity has been ascertained in our phantom study, in-vivo reliability study is warranted. This healthy participant study demonstrated excellent reliability of 3D-EPI QSM with 2 minutes’ scan time, compared to the “standard” 5 minutes’ GRE QSM, favoring further study to evaluate its actual clinical performance.
Introduction
Various studies have introduced the clinical purposes of Quantitative Susceptibility Mapping (QSM), particularly in the neurologic field.1-4 As one solution of relatively long scan time which hinders its routine application, 3D-EPI QSM5 has been proposed and validated in our previously conducted phantom study. Yet, its in-vivo reliability still needs to be determined. Therefore, the purpose of this study is to assess the reliability of 2 minutes’ 3D-EPI QSM, compared to the 5 minutes’ multi-TE and single-TE GRE QSM among healthy participants.Methods
Approval from the ethics committee and written consent from participants were obtained. Forty healthy participants without known neurological disease agreed to join this study. Each participant underwent three consecutive brain QSM sequences on 3T MAGNETOM Skyra (Siemens Healthineers, Erlangen, Germany) with a 32-channel head coil. QSM sequences were 3D-EPI, single-TE GRE and multi-TE GRE. The acquisition parameters are shown in Table 1. T1-weighted images were also acquired using 3D-MPRAGE (TR, 1900 ms; TE, 2.6 ms; TI, 900 ms; FA, 9o; FOV, 230 × 230 mm2; matrix, 256 × 256; slice thickness, 0.9 mm; GRAPPA 2×).In-house script based on STI Suite 3 (https://people.eecs.berkeley.edu/~chunlei.liu/software.html) was used for QSM reconstruction, run under MATLAB 2016b (Mathworks, Natick, Massachusetts, US), utilizing brain extraction tool (BET) of FSL (https://fsl.fmrib.ox.ac.uk/fsl/fslwiki/BET), Laplacian-based phase unwrapping, variable-kernel sophisticated harmonic artifact reduction for phase data (V-SHARP), and improved sparse linear equation and least‐squares (iLSQR) algorithm.
T1-weighted images were coregistered and segmented to create the DARTEL template using SPM12 (https://www.fil.ion.ucl.ac.uk/spm/software/spm12/). This template was used for normalizing QSM to the MNI space and creating average QSM. Based on this, seventeen volumes of interest (VOIs) were drawn semi-automatically using ITK-SNAP (www.itksnap.org), including paramagnetic structures (dentate nucleus, substantia nigra, red nucleus, putamen, globus pallidus, and caudate nucleus) and diamagnetic structures (corpus callosum, internal capsule, optic radiation). Regions of interest (ROIs) were also created on choroid plexus calcifications. This task was performed by two neuroradiologists (7 and 22 years of experience).
VOIs were smoothed and reversely transferred to each individual space. REX toolkit (https://web.mit.edu/swg/software.htm) was used for extracting mean susceptibility values automatically, then statistical analyses were performed, including ANOVA, linear regression (r2), intraclass correlation coefficient (ICC) and Bland-Altman plot.
Results
Participants consisted of 15 men and 25 women with a mean age of 58.9 years (23 – 81 years). Representative average QSM images from 3D-EPI, multi-TE and single-TE GRE depicted contrast consistencies among various brain structures (Figure 1). The mean susceptibility values of each VOI are shown in Figure 2. There were no significant differences in mean susceptibility values between QSM sequences (ANOVA p > .05). Regression lines (Figure 3) demonstrated excellent linearity between 3D-EPI and multi-TE or single-TE GRE QSM (r2 = 0.98, slope = 0.96; r2 = 0.98, slope = 1.02, p < .01, respectively), approaching the linearity between GRE QSMs (r2 = 0.99, slope = 0.99, p < .01). Correlation-agreements between 3D-EPI and GRE QSMs were also excellent, ICC = 0.988 (0.981 – 0.992) to single-TE GRE and ICC = 0.990 (0.987 – 0.992) to multi-TE GRE QSM, only slightly lower than the ICC between GRE QSMs, ICC = 0.993 (0.992 – 0.994). Regional ICC calculation (Table 2) showed a relatively higher ICC of paramagnetic than diamagnetic VOIs. Bland-Altman plots in Figure 3 furtherly supported the excellent agreement between 3D-EPI and GRE QSMs. The mean difference between 3D-EPI and single-TE GRE QSM was 4 ppb (95% CI: -15 - 23 ppb), while 3D-EPI to multi-TE GRE QSM was 3 ppb (95% CI: -15 - 20 ppb). As a reference comparison, the plot between multi-TE and single-TE GRE QSM had a mean difference of 1 ppb (95% CI: -16 - 14 ppb).Discussion
Several QSM reproducibility studies on human participants have been conducted, yet none of them compared 3D-EPI to GRE QSM. Previous studies investigated the reproducibility of QSM on the different field strength6,7, vendor6, site8, and QSM algorithm7,9. Nevertheless, excellent agreements between 3D-EPI and GRE QSM in our study (bias ≤ 4 ppb, 95% CI: -15 - 23 ppb), were quite comparable to the previous study which evaluated 2D-EPI QSM (bias = -5 ppb, 95% CI: -11 - 20 ppb [3D processing]; bias = -1 ppb, 95%CI: -15 - 13 ppb [2D+3D processing])9. These low biases represented the low probability of systematic error. Several outliers on the Bland-Altman plots were proportionally small as we had 680 VOI measurement points in total. Furthermore, 3D-EPI QSM demonstrated very high ICC, which is a relevant metrics of correlation-agreement, to GRE QSMs. Relatively lower ICCs depicted on the diamagnetic VOIs were thought to be influenced by the anisotropy of highly-oriented white matter structures. This argument was consistent with the higher ICC we had on plexus choroid calcification, which is relatively isotropic. Yet, several limitations were noted in this study, including no susceptibility value referencing, presence of some air-tissue interface artifact and also no test-retest evaluation.Conclusion
Faster 3D-EPI QSM which is more clinically feasible demonstrated excellent in-vivo reliability compared to the GRE QSM, augmenting the excellent validity determined in the former phantom study, yet the actual clinical performance is still needed to be evaluated.Acknowledgements
Indonesia Endowment Fund for Education (LPDP), for providing financial support during this Ph.D. program.
Mr. Yuta Urushibata, Siemens Healthcare Japan KK, for helpful discussions.
References
- Kim H-G, Park S, Rhee HY, et al. Quantitative susceptibility mapping to evaluate the early stage of Alzheimer's disease. NeuroImage: Clinical. 2017;16:429-438.
- Langkammer C, Pirpamer L, Seiler S, et al. Quantitative susceptibility mapping in Parkinson's disease. PLoS One. 2016;11(9):e0162460.
- Nakagawa D, Kudo K, Awe O, et al. Detection of microbleeds associated with sentinel headache using MRI quantitative susceptibility mapping: pilot study. Journal of neurosurgery. 2018;130(4):1391-1397.
- Chandran AS, Bynevelt M, Lind CRP. Magnetic resonance imaging of the subthalamic nucleus for deep brain stimulation. Journal of neurosurgery. 2016;124(1):96-105.
- Sati P, Thomasson DM, Li N, et al. Rapid, high-resolution, whole-brain, susceptibility-based MRI of multiple sclerosis. Multiple Sclerosis Journal. 2014;20(11):1464-1470.
- Deh K, Nguyen TD, Eskreis‐Winkler S, et al. Reproducibility of quantitative susceptibility mapping in the brain at two field strengths from two vendors. Journal of magnetic resonance imaging. 2015;42(6):1592-1600.
- Hinoda T, Fushimi Y, Okada T, et al. Quantitative susceptibility mapping at 3 T and 1.5 T: evaluation of consistency and reproducibility. Investigative radiology. 2015;50(8):522-530.
- Lin PY, Chao TC, Wu ML. Quantitative susceptibility mapping of human brain at 3T: a multisite reproducibility study. American Journal of Neuroradiology. 2015;36(3):467-474.
- Wei H, Zhang Y, Gibbs E, Chen NK, Wang N, Liu C. Joint 2D and 3D phase processing for quantitative susceptibility mapping: application to 2D echo‐planar imaging. NMR in Biomedicine. 2017;30(4):e3501.
Figures
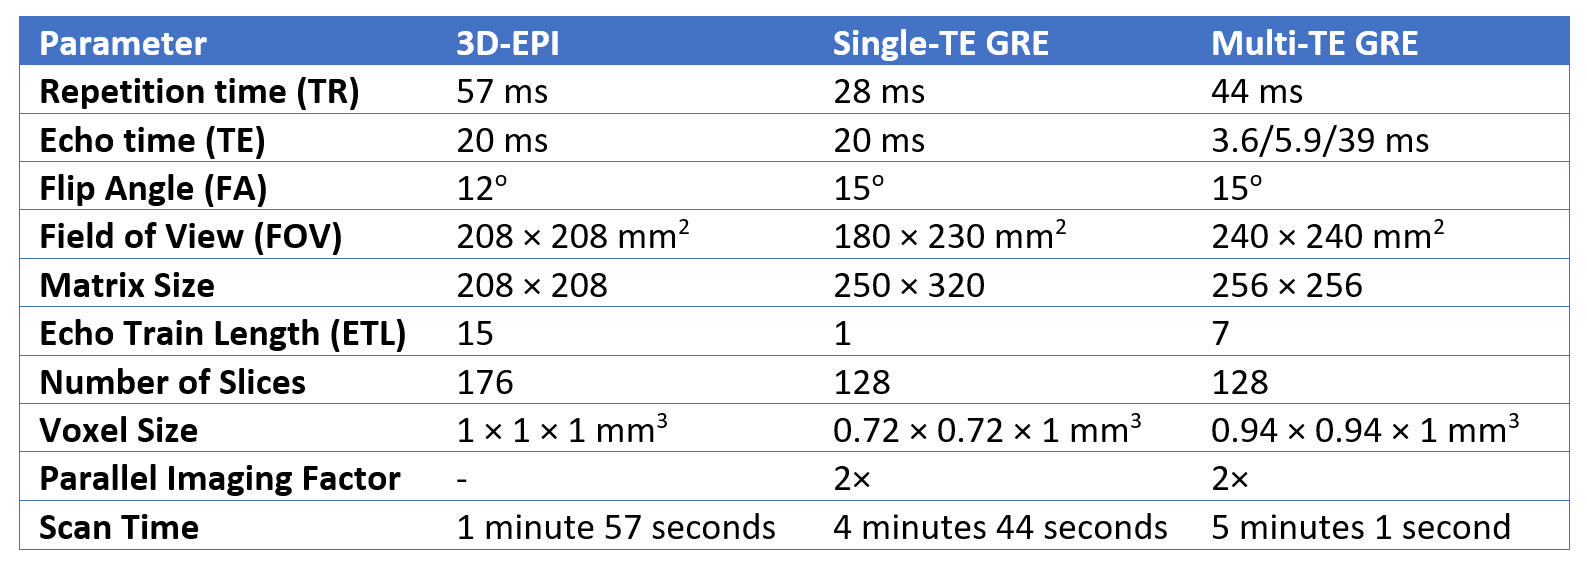
Table 1. Acquisition parameters of applied QSM
sequences. With comparable resolution,
3D-EPI QSM scan time is only about 40% of GRE QSM.
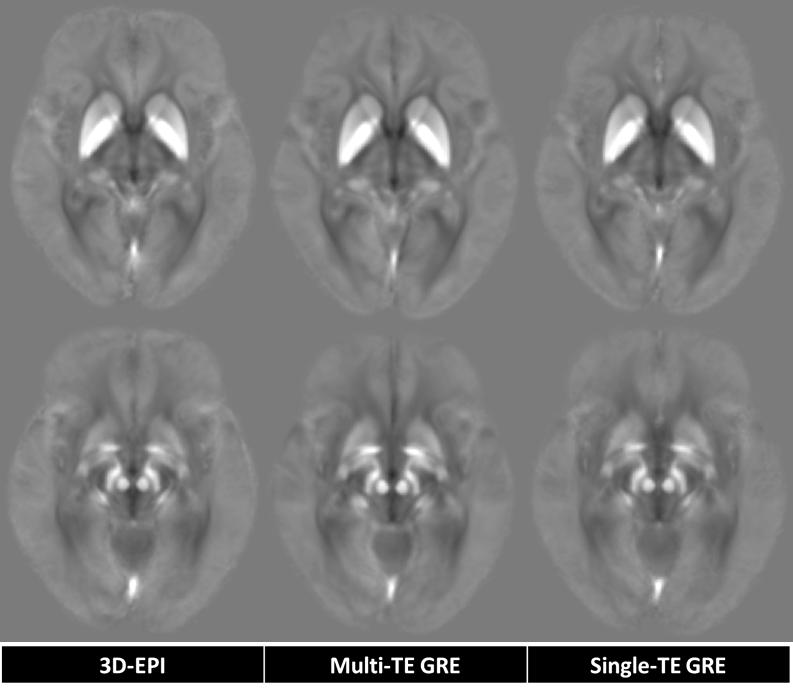
Figure 1. Comparison of average QSM generated
from 3D-EPI, multi-TE and single-TE GRE on the same slice. The intensities of
several paramagnetic and diamagnetic structures were visually consistent.
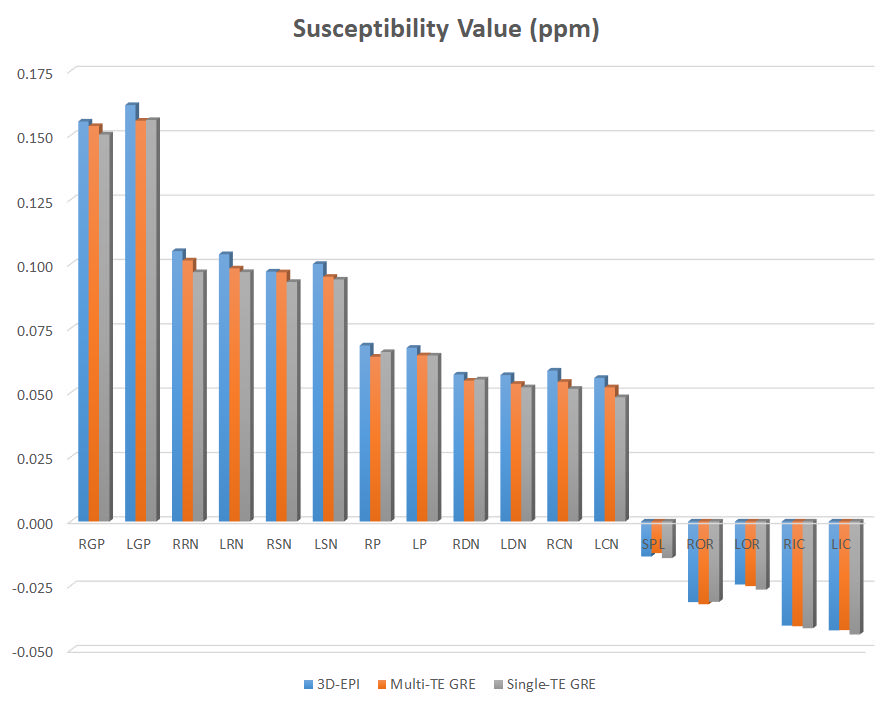
Figure 2. Mean susceptibility values of VOIs
from each QSM sequence. There were no significant differences between QSM
sequences (ANOVA p > .05).
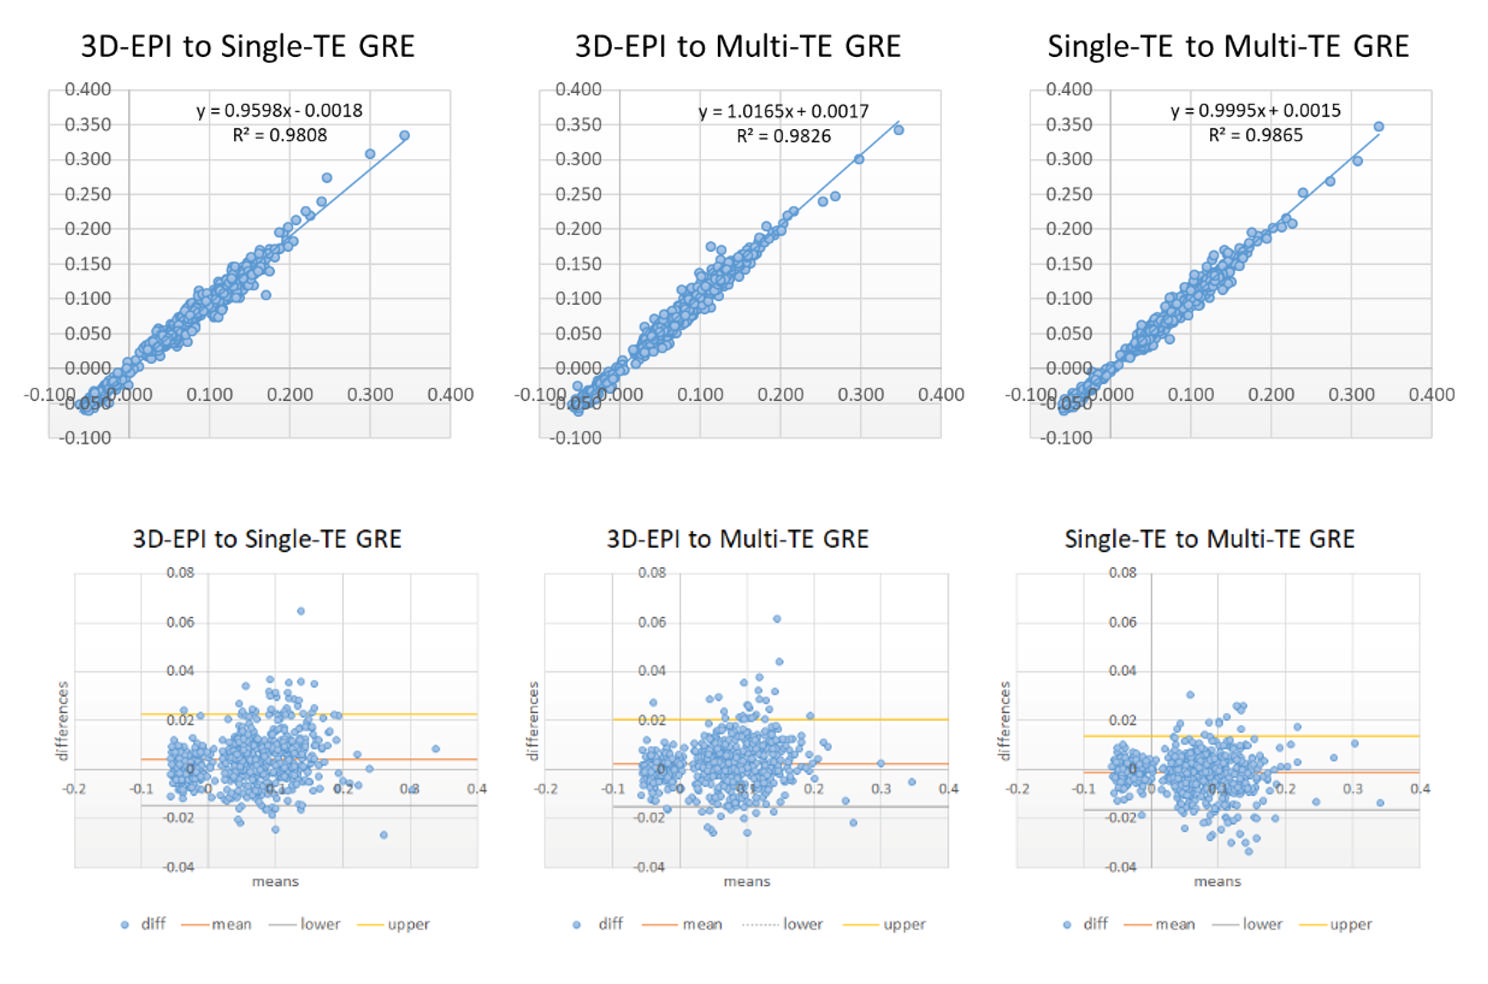
Figure 3. Regression lines and Bland-Altman
plots between 3D-EPI, multi-TE and single-TE GRE QSM. Linearities and
agreements between QSM sequences are well depicted.
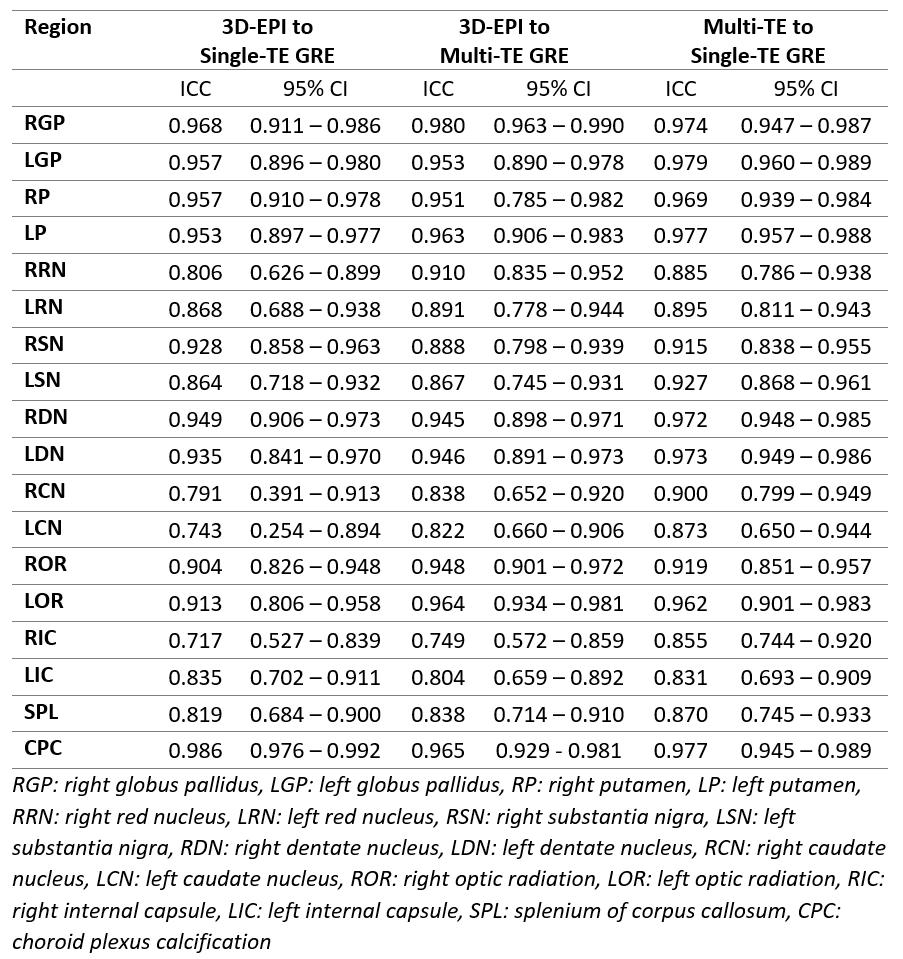
Table 2. Regional ICC calculation between QSM
sequences. Relatively higher correlation-agreements were noted on the
paramagnetic VOIs.