3249
On the Saturation Scheme in Chemical Exchange Saturation Transfer Imaging with B0 Inhomogeneity1Key Laboratory for Biomedical Engineering of Ministry of Education, Department of Biomedical Engineering, College of Biomedical Engineering & Instrument Science, Zhejiang University, Hangzhou, Zhejiang, China, 2MR Collaboration, Siemens Healthcare Ltd., Shanghai, China
Synopsis
Saturation pulses are an indispensable part in Chemical Exchange Saturation Transfer (CEST) imaging. Different saturation schemes can be designed for CEST imaging, including the pulse shape, duration of each pulse element, number of pulse elements, inter-pulse spoiler gradient, and inter-pulse gap, etc. Here, the impact of saturation schemes subject to practical B0 inhomogeneity is investigated, using Bloch simulations, and phantom and human experiments. Specifically, it’s shown that Gaussian and rectangular saturation pulses demonstrate substantially different susceptibility to imaging artifacts in the presence of B0 inhomogeneity when changing the duration of each saturation pulse element, and the inter-pulse spoiler gradients.
Introduction
Chemical Exchange Saturation Transfer (CEST) imaging is capable of measuring the low-concentration solute metabolites with frequency-selective radiofrequency (RF) saturation pulses.1,2 Unsurprisingly, the RF saturation schemes play a crucial role in CEST imaging. In addition, CEST imaging is exquisitely sensitive to B0 inhomogeneity with magnetization transfer ratio asymmetry (MTRasym) analysis.3 To date, several studies have investigated the optimization of RF saturation power or total RF saturation duration.4,5 However, to the best of our knowledge, no prior literature demonstrated the impact of the duration of each pulse element and spoiler gradients on CEST imaging with the consideration of B0 inhomogeneity. Here, it is shown that the two mostly-used saturation pulse shapes in CEST imaging, rectangular and Gaussian shapes, 6-11 have drastically different susceptibility to imaging artifacts subject to practical B0 inhomogeneity. Furthermore, it’s revealed that the duration of each RF pulse element instead of the total RF duration, and the inter-pulse spoiler gradients are the two major factors affecting image artifacts under practical B0 inhomogeneity.Methods
Simulations. The Amide Proton Transfer weighted (APTw) signal was simulated with two-pool Bloch-McConnell equations.12 Specifically, four 1s-long saturation combinations were tested, including: (a) ten 100ms-long pulse elements without inter-pulse spoiler gradients (Group 1); (b) ten 100ms-long pulse elements with 15mT/m inter-pulse spoiler gradients (Group 2); (c) five 200ms-long pulse elements without inter-pulse spoiler gradients (Group 3); and (d) five 200ms-long pulse elements with 15mT/m inter-pulse spoiler gradients (Group 4). In addition, the simulations were performed using rectangular or Gaussian RF saturation pulses without or with B0 inhomogeneity, which resulted in 16 total saturation schemes. Other key parameters of the two-pool model were as follows 4,6: B0, 3T; B1, 2uT; frequency offset of the amide pool, 3.5ppm; fraction of the amide pool with respect to the water pool, 1/500; amide-water exchange rate, 30Hz; T1 and T2 of water, 3s and 1s, respectively; T1 and T2 of amide, 1s and 15ms, respectively.Experiments. Phantom and human experiments were conducted with the aforementioned saturation schemes. The phantom consisted of a flask filled with 2% agarose gel and two test tubes. One test tube was made of 10% bovine serum albumin (BSA) immersed in phosphate-buffered saline (PBS), and the other one with 5% BSA dissolved in PBS. Two healthy normal volunteers were recruited with approval of the local IRB and written consent was obtained from each participant.
MRI. Both phantom and human experiments were performed on a 3T Siemens scanner (MAGNETOM Prisma, Siemens Healthcare, Erlangen, Germany) with the frequency-stabilized CEST sequence 13 to eliminate the effects of temporal B0 drift in real time, using main acquisition parameters of TR=3s, TE=6.7ms, slice thickness=5mm, FOV=212x186mm2, and resolution=2.2x2.2mm2.
Results
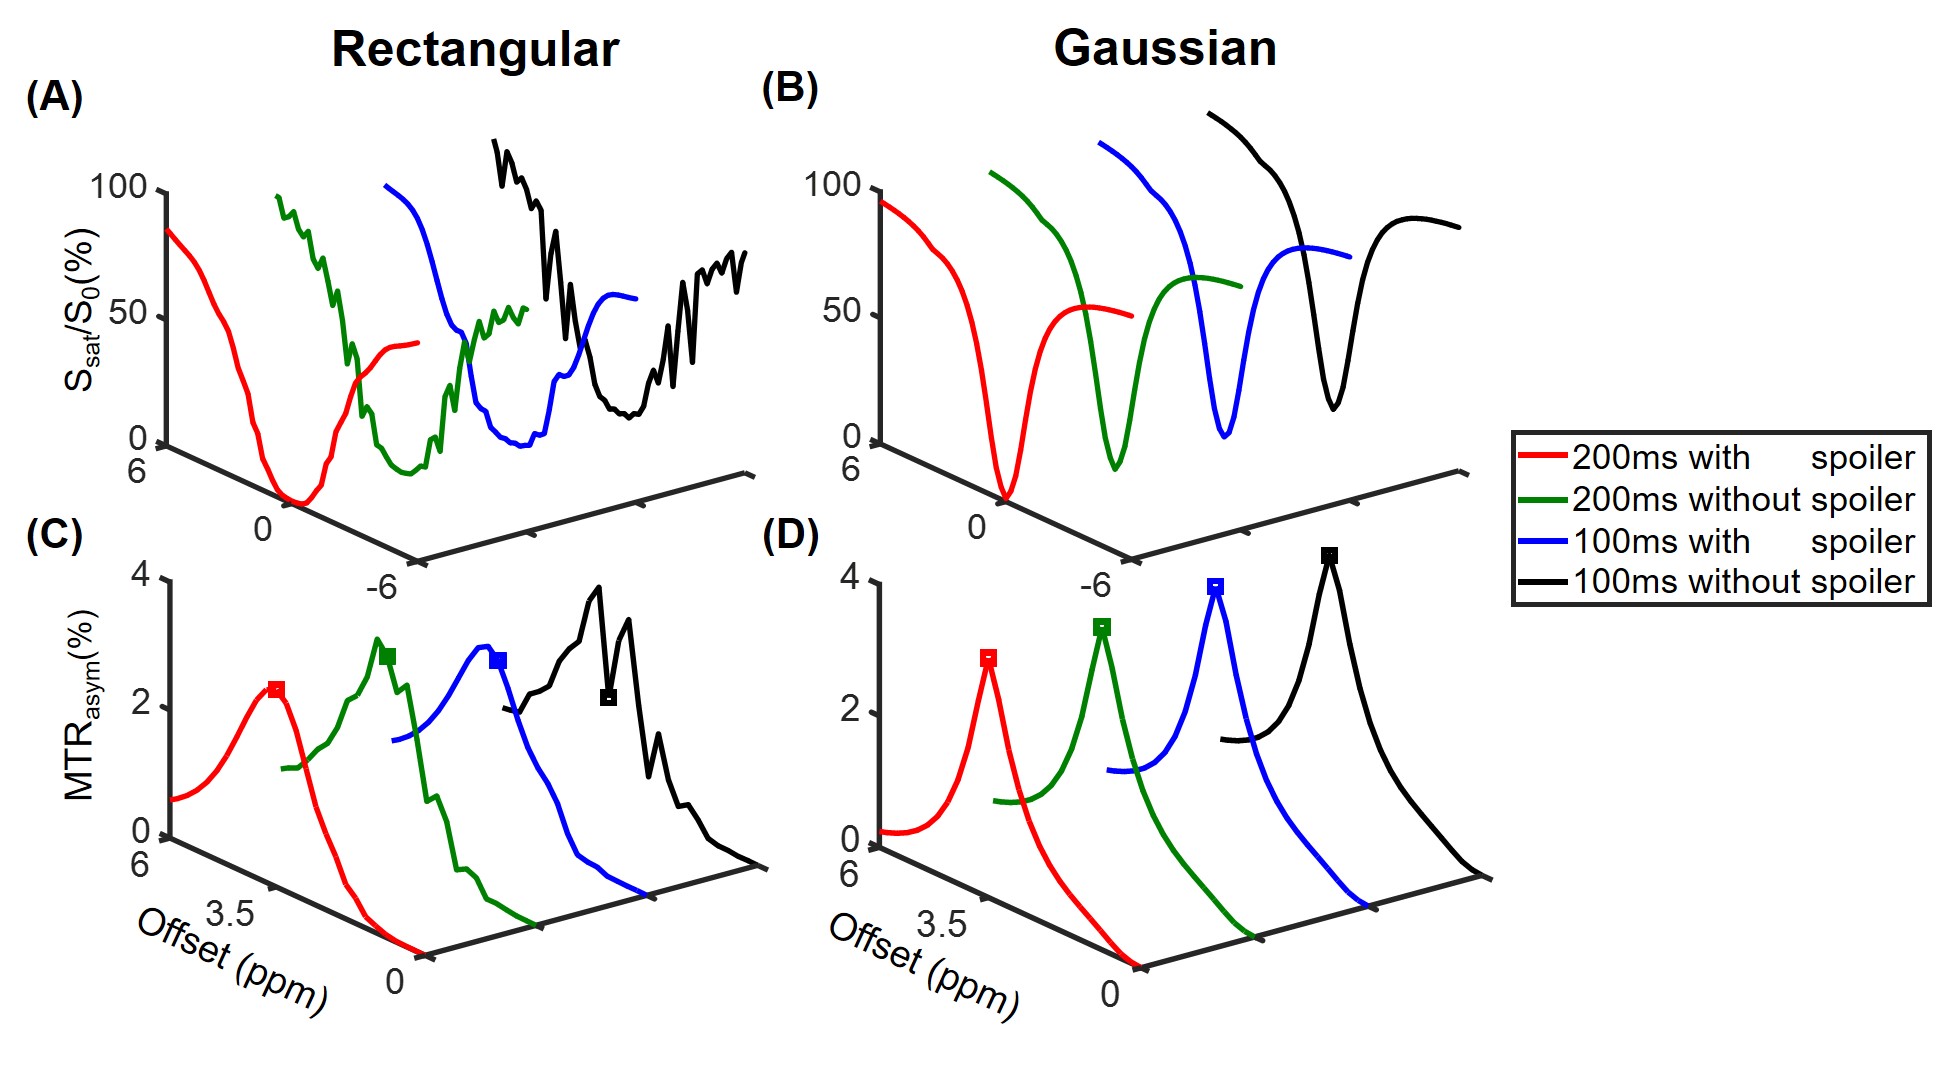
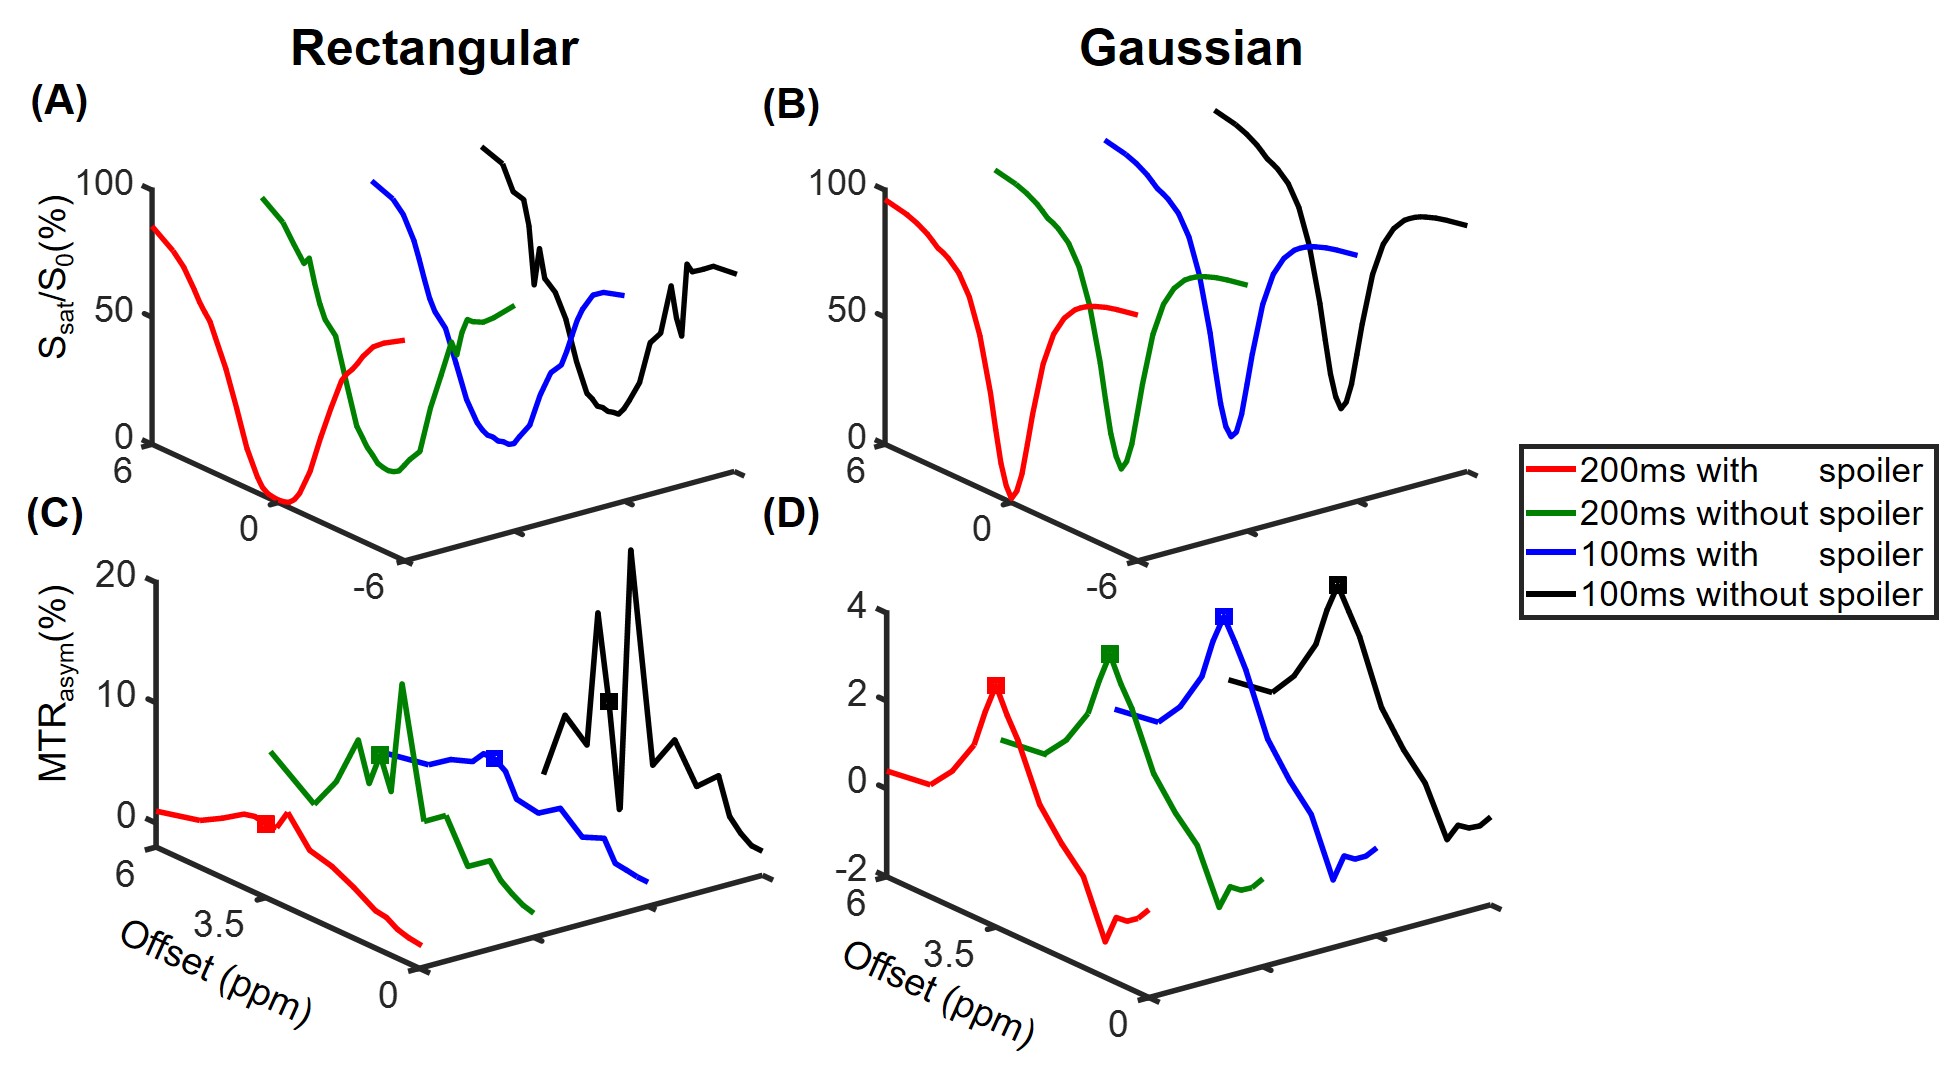
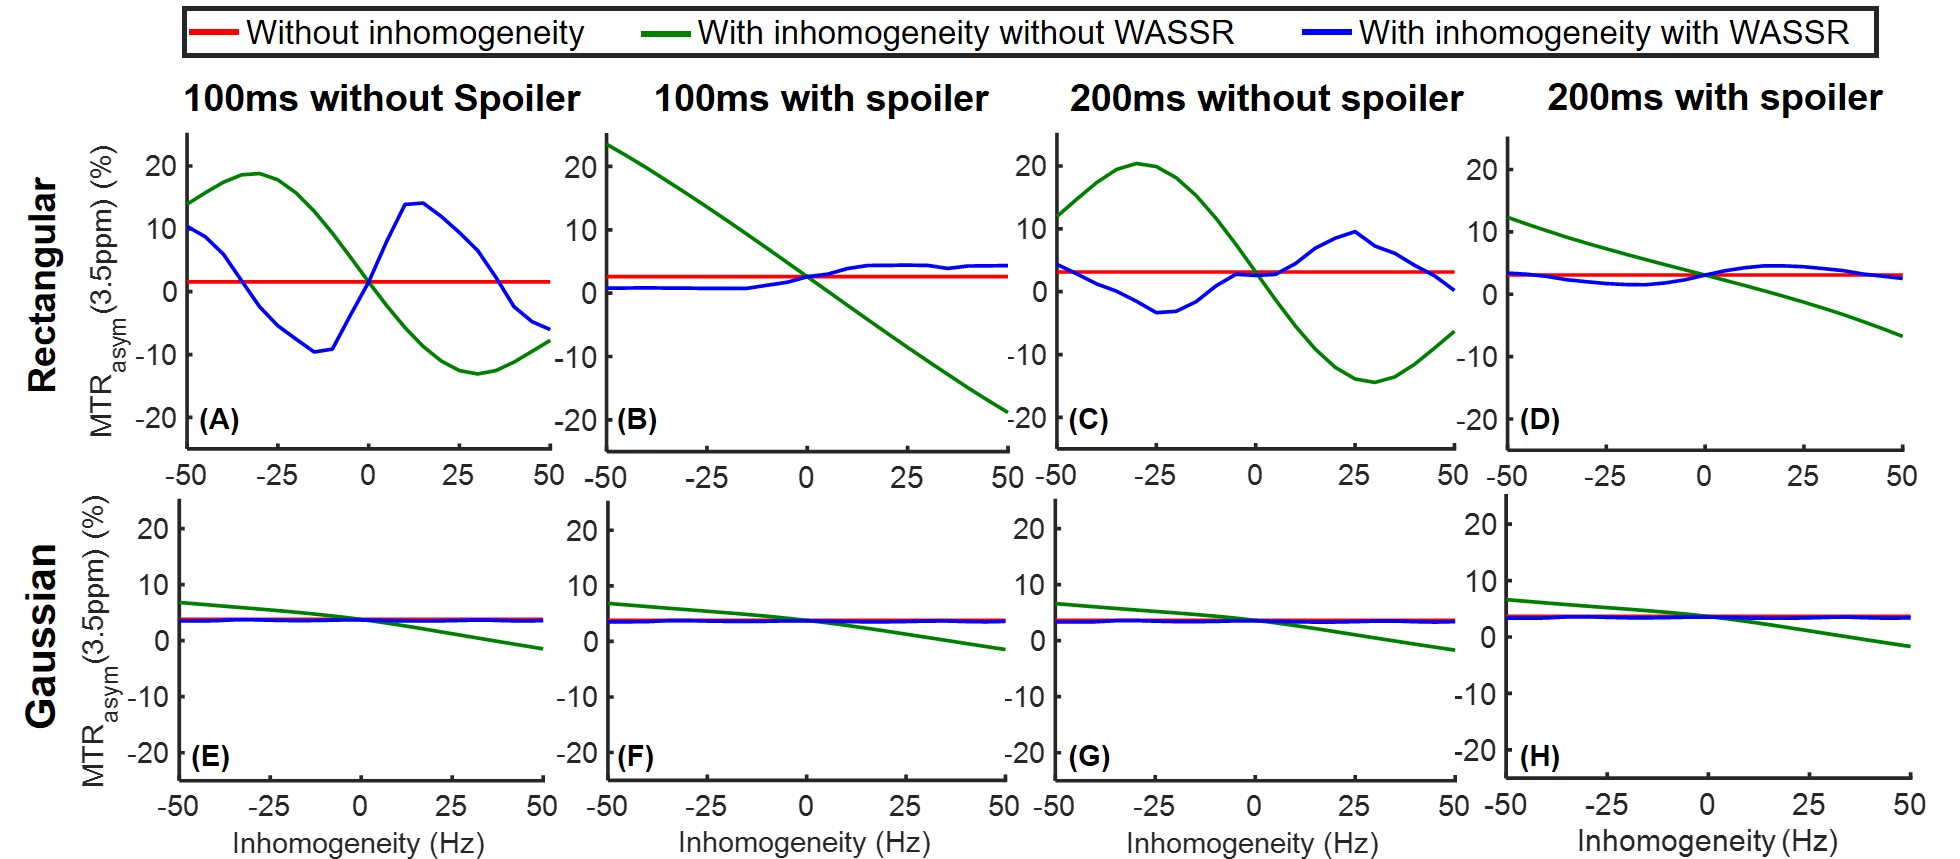
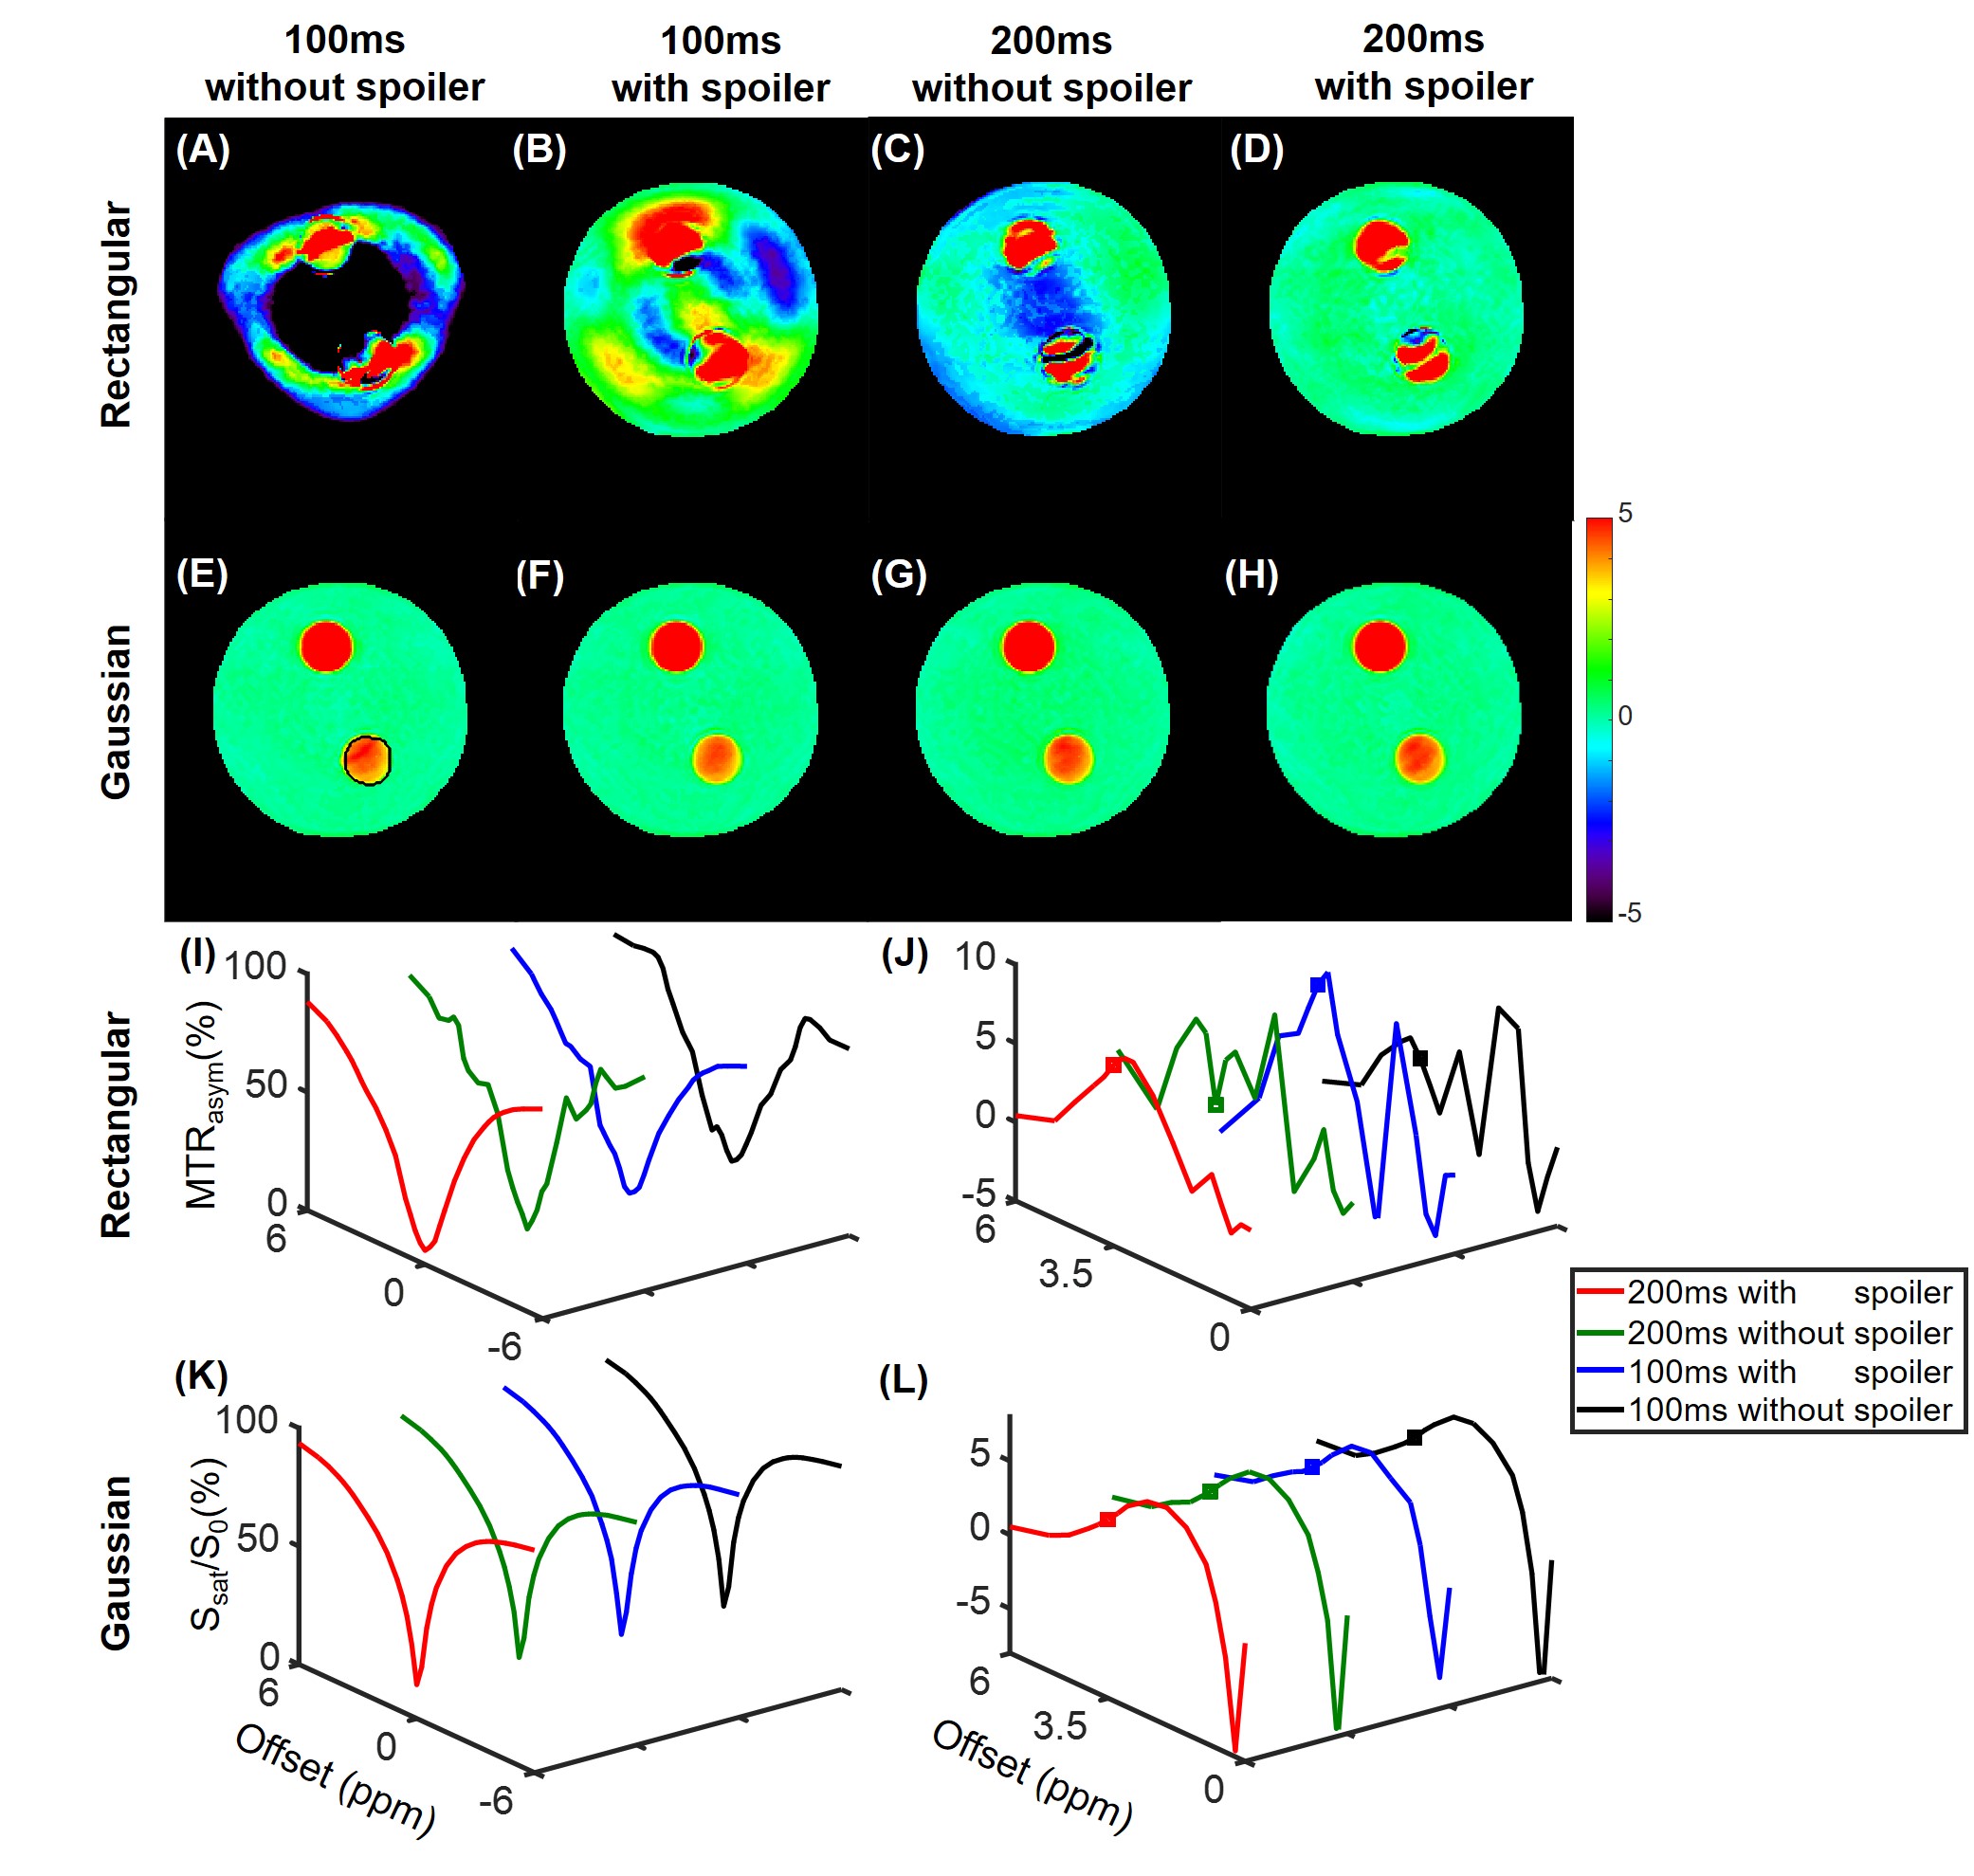
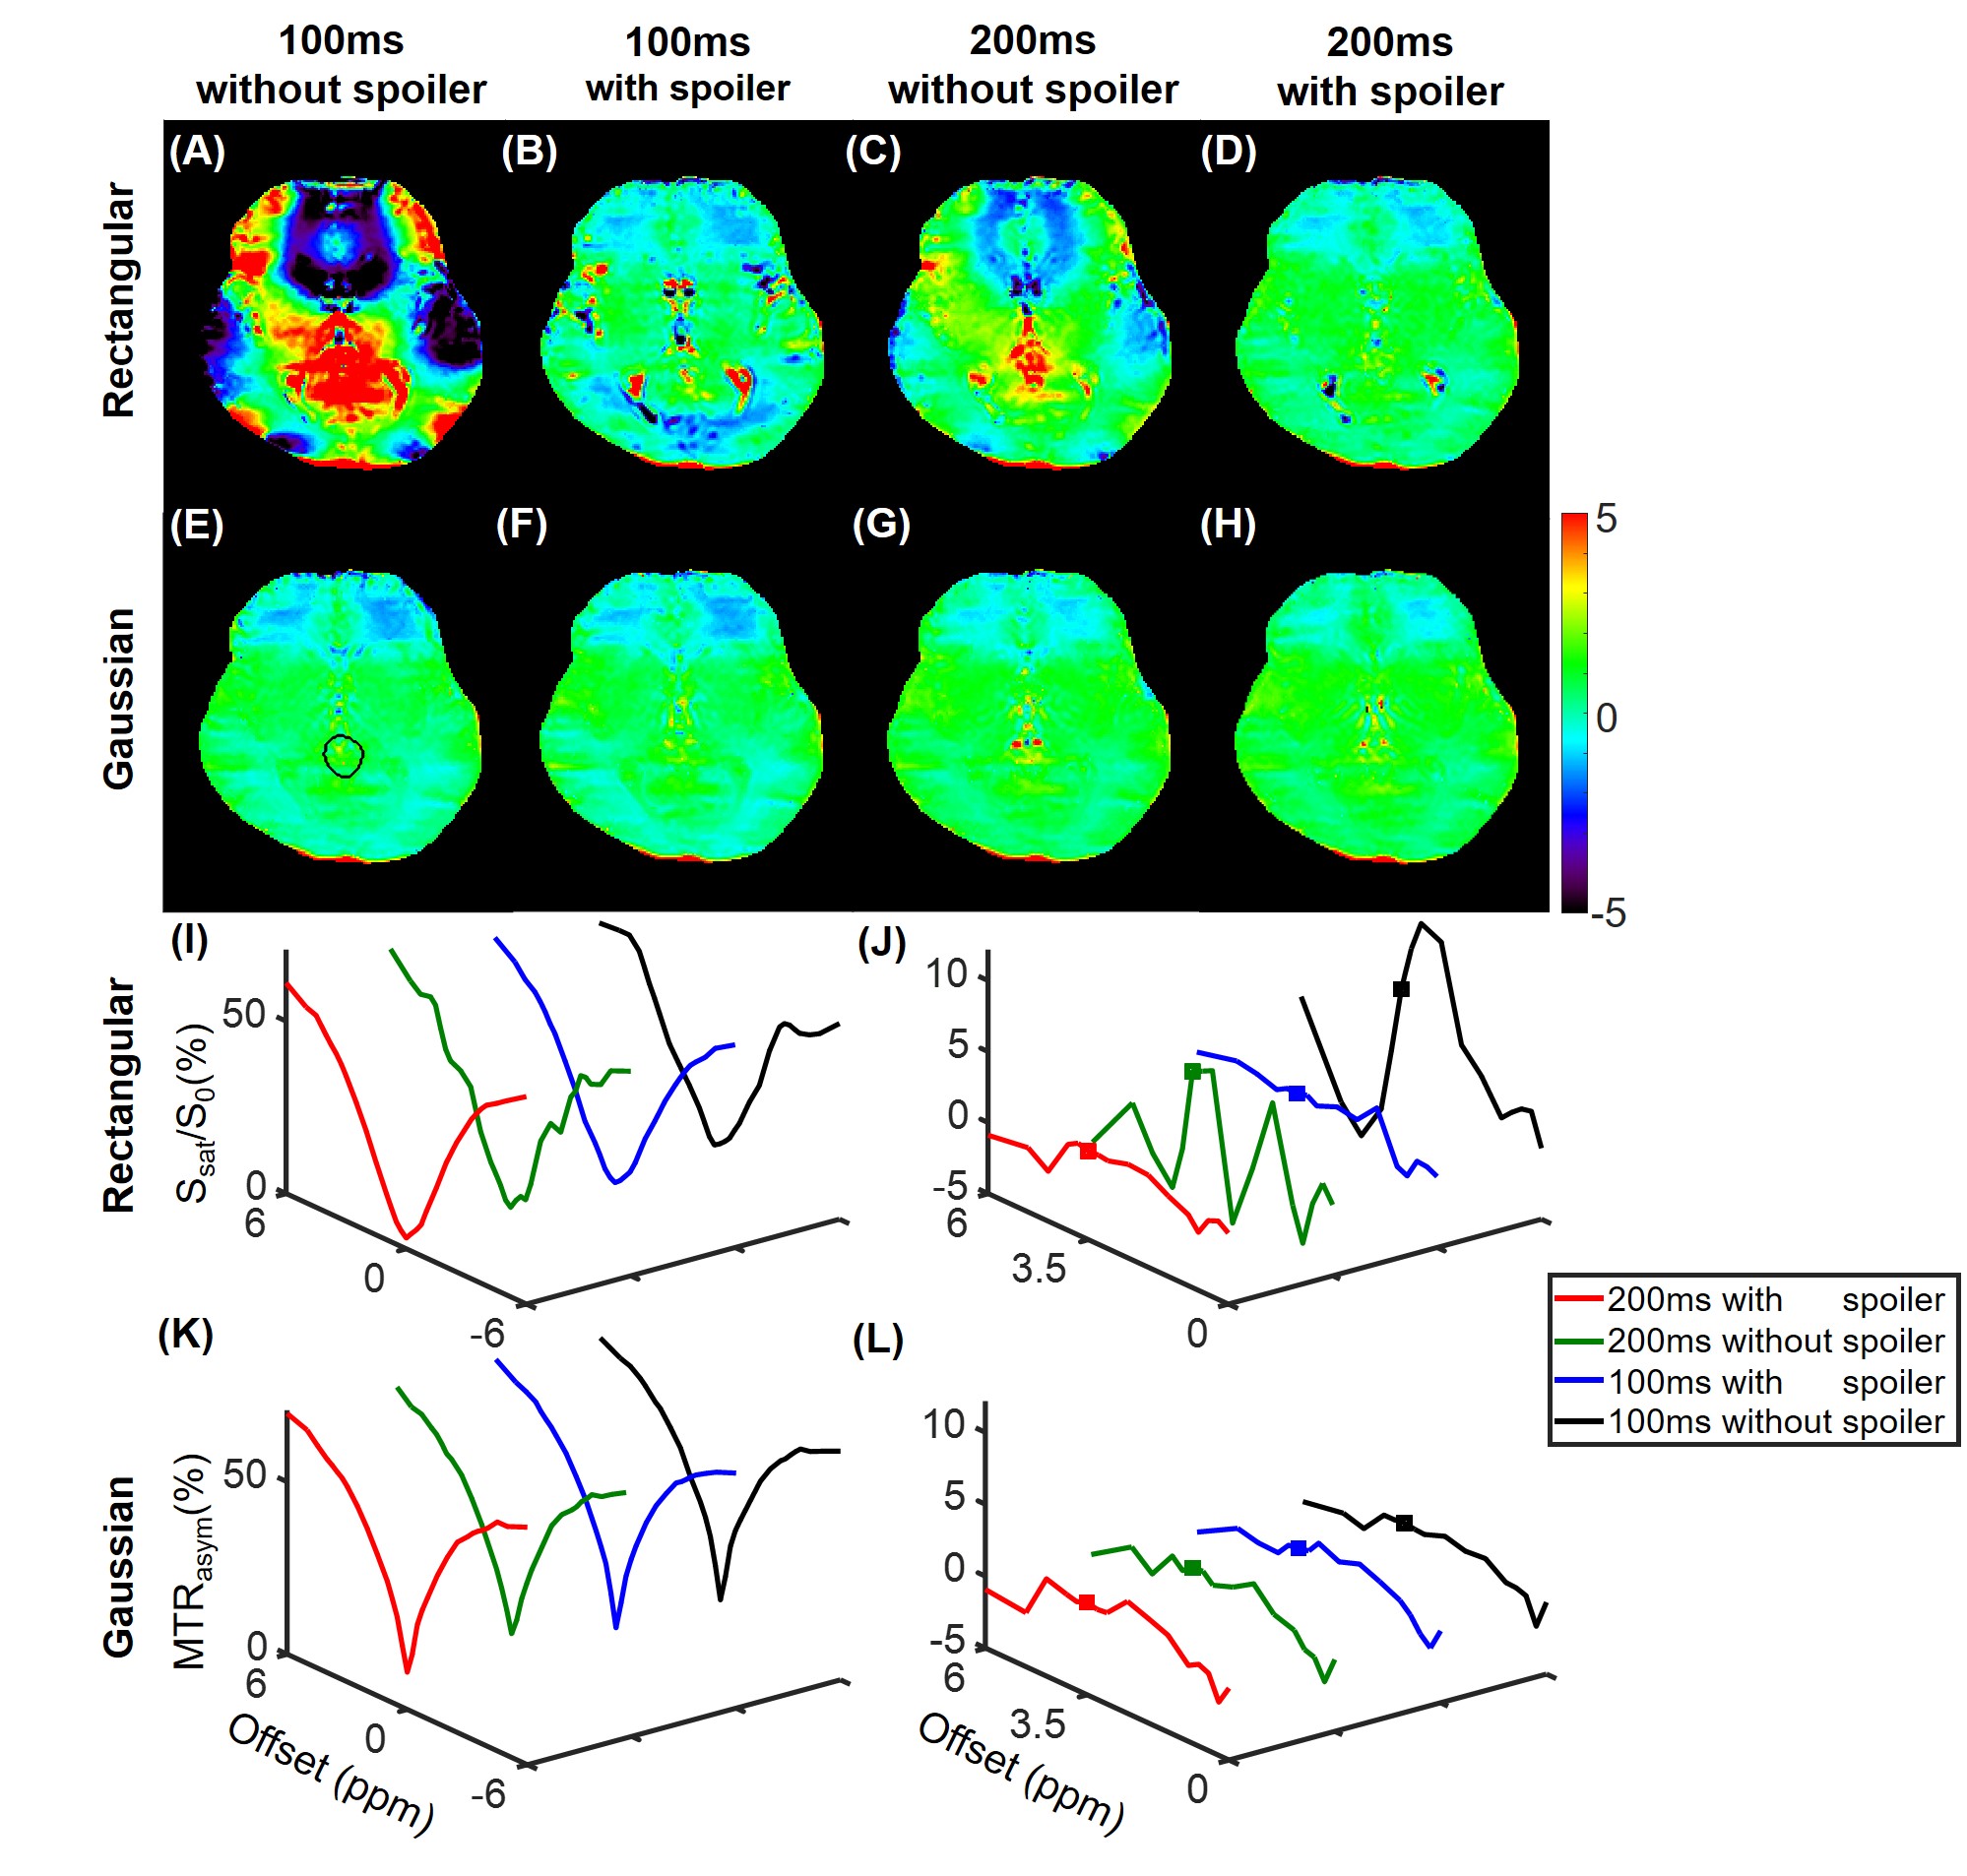
Simulations show that the z spectra and MTRasym spectra obtained from Gaussian pulses were smoother than those generated from rectangular pulses in line with the prior report 14 (Fig. 1). In addition, the inter-pulse spoiler gradients and longer pulse element duration were both able to substantially reduce the oscillations in z spectra and MTRasym spectra when B0 inhomogeneity was absent (Fig. 1). However, when a 30-Hz B0 inhomogeneity was present, the severe artifacts in the MTRasym spectra for rectangular saturation pulses could not be corrected by spoiler gradients or longer pulse element duration even after WASSR correction 3 (Fig. 2C), while reasonable MTRasym spectra were obtained for the Gaussian saturation pulses after WASSR correction (Fig. 2D). Furthermore, the B0 inhomogeneity would result in significantly erroneous APTw signals for both rectangular and Gaussian pulses without WASSR correction (green lines, Fig. 3), whereas WASSR correction restored the APTw signals for Gaussian pulses instead of rectangular pulses (blue lines, Fig. 3). In the phantom study where practical B0 inhomogeneity existed, Gaussian pulses yielded high-quality APTw maps and MTRasym spectra for all saturation groups, but rectangular pulses could only generate APTw and MTRaysm spectra with minor artifacts using 200ms-long pulse elements and inter-pulse spoiler gradients (Fig. 4). In the human study, Gaussian pulses also generated APTw images and MTRasym spectra with fewer artifacts than rectangular pulses (Fig. 5). As for rectangular pulses, the saturation scheme with 200ms-long pulse elements and inter-pulse spoiler gradients yielded the best results among all cases (Fig. 5).Discussion and Conclusion
Here, we studied the effects of different saturation schemes on CEST imaging, including different pulse shapes, durations of pulse elements, and settings of spoiler gradients, in Bloch simulations and experimental studies. Due to the scan time limitation, although the tested schemes were certainly not exhaustive, four key novel findings were demonstrated. First, the Gaussian pulses were remarkably more robust to various saturation schemes than the rectangular pulses, which is relevant to many simulations or experimental studies considering the ubiquitous use of rectangular pulses in the CEST field. Second, the duration of each pulse element, though with the same total saturation duration, played a significant role in affecting the quality of final CEST maps and MTRasym spectra. Third, the inter-pulse spoiler gradients were critical for ensuring good-quality CEST results, especially for rectangular pulses. Last but not least, the experimental results in Figs. 4 and 5, especially those abnormally positive and negative APTw signals, could only be explained by Bloch simulations with consideration of B0 inhomogeneity (Fig.2 vs. Fig.1).Acknowledgements
NSFC grant number: 61801421, 81971605. Zhejiang Lab grant number: 2018EB0ZX01. This work is also supported by “the Fundamental Research Funds for the Central Universities (2019FZJD005)”.References
1. Ward K, Aletras A, Balaban RS. A new class of contrast agents for MRI based on proton chemical exchange dependent saturation transfer (CEST). J Magn Reson 2000;143(1):79-87.
2. Van Zijl PC, Yadav NN. Chemical exchange saturation transfer (CEST): what is in a name and what isn't? Magn Reson Med 2011;65(4):927-948.
3. Kim M, Gillen J, Landman BA, Zhou J, van Zijl PC. Water saturation shift referencing (WASSR) for chemical exchange saturation transfer (CEST) experiments. Magn Reson Med 2009;61(6):1441-1450.
4. Sun PZ, Wang E, Cheung JS, Zhang X, Benner T, Sorensen AG. Simulation and optimization of pulsed radio frequency irradiation scheme for chemical exchange saturation transfer (CEST) MRI—demonstration of pH‐weighted pulsed‐amide proton CEST MRI in an animal model of acute cerebral ischemia. Magn Reson Med 2011;66(4):1042-1048.
5. Sun PZ, van Zijl PC, Zhou J. Optimization of the irradiation power in chemical exchange dependent saturation transfer experiments. J Magn Reson 2005;175(2):193-200.
6. Zhou J, Payen J-F, Wilson DA, Traystman RJ, Van Zijl PC. Using the amide proton signals of intracellular proteins and peptides to detect pH effects in MRI. Nat Med 2003;9(8):1085.
7. Cai K, Haris M, Singh A, Kogan F, Greenberg JH, Hariharan H, Detre JA, Reddy R. Magnetic resonance imaging of glutamate. Nat Med 2012;18(2):302.
8. Zhou J, Lal B, Wilson DA, Laterra J, Van Zijl PC. Amide proton transfer (APT) contrast for imaging of brain tumors. Magn Reson Med 2003;50(6):1120-1126.
9. Liu G, Song X, Chan KW, McMahon MT. Nuts and bolts of chemical exchange saturation transfer MRI. NMR Biomed 2013;26(7):810-828.
10. Yoshimaru ES, Randtke EA, Pagel MD, Cárdenas-Rodríguez J. Design and optimization of pulsed Chemical Exchange Saturation Transfer MRI using a multiobjective genetic algorithm. J Magn Reson 2016;263:184-192.
11. Wu Y, Chen Y, Zhao Y, Yang S, Zhao J, Zhou J, Chen Z, Sun PZ, Zheng H. Direct radiofrequency saturation corrected amide proton transfer tumor MRI at 3T. Magn Reson Med 2019;81(4):2710-2719.
12. Woessner DE, Zhang S, Merritt ME, Sherry AD. Numerical solution of the Bloch equations provides insights into the optimum design of PARACEST agents for MRI. Magn Reson Med 2005;53(4):790-799.
13. Liu R, Zhang H, Niu W, Lai C, Ding Q, Chen W, Liang S, Zhou J, Wu D, Zhang Y. Improved chemical exchange saturation transfer imaging with real‐time frequency drift correction. Magn Reson Med 2019;81(5):2915-2923.
14. Dewey B. Simulation and optimization of pulsed Chemical Exchange Saturation Transfer for clinical application at 3T[D]. Vanderbilt University. Department of Physics and Astronomy; 2013.
Figures